Operations Management Operations and Productivity Chapter 1 1
- Slides: 26
Operations Management Operations and Productivity Chapter 1 1
Outline Global company profile: Whirlpool l What is Operations Management? l ¡ ¡ ¡ The heritage of Operations Management Why study OM? What Operations Managers do Organizing to produce goods and services l Where are the OM jobs? l ¡ Exciting new trends in Operations Management Operations in the service sector l The Productivity challenge l 2
Learning Objectives When you complete this chapter, you should be able to: l Identify or Define: ¡ ¡ l Production and productivity Operations Management (OM) What operations managers do Services Describe or Explain: ¡ ¡ ¡ A brief history of operations management The future of the discipline Measuring productivity 3
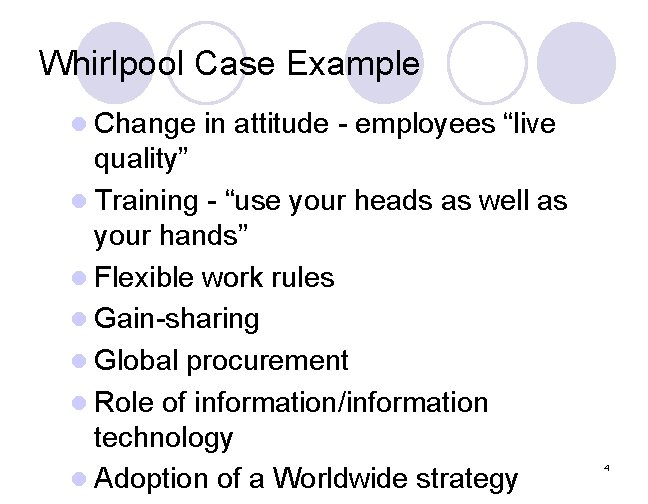
Whirlpool Case Example l Change in attitude - employees “live quality” l Training - “use your heads as well as your hands” l Flexible work rules l Gain-sharing l Global procurement l Role of information/information technology l Adoption of a Worldwide strategy 4
What Is Operations Management? l Production is the creation of goods and services Let’s define goods and services with specific examples 5
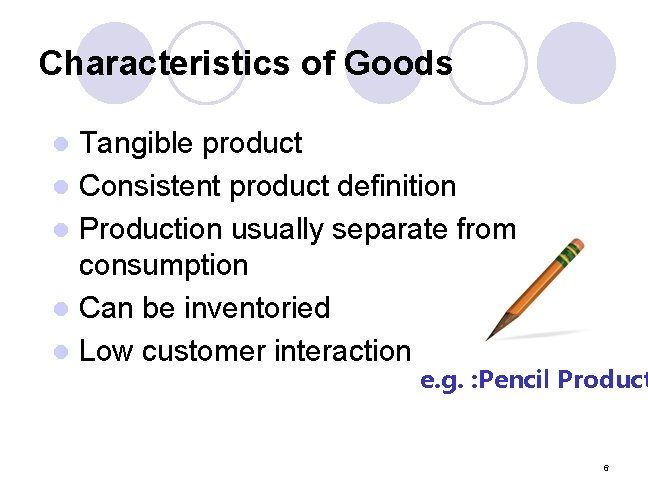
Characteristics of Goods Tangible product l Consistent product definition l Production usually separate from consumption l Can be inventoried l Low customer interaction l e. g. : Pencil Product 6
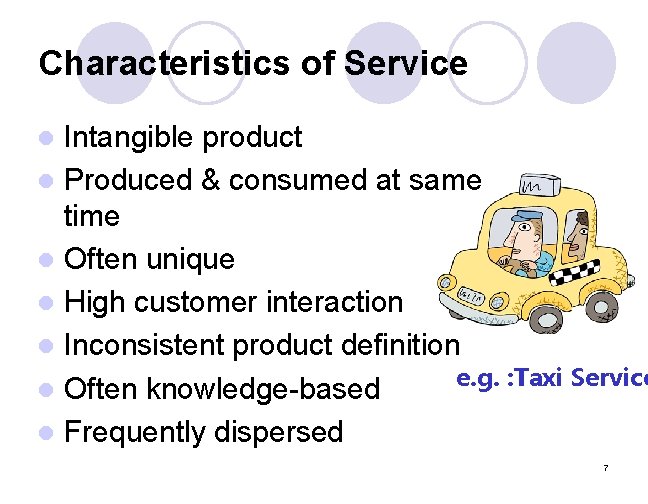
Characteristics of Service Intangible product l Produced & consumed at same time l Often unique l High customer interaction l Inconsistent product definition e. g. : Taxi Service l Often knowledge-based l Frequently dispersed l 7
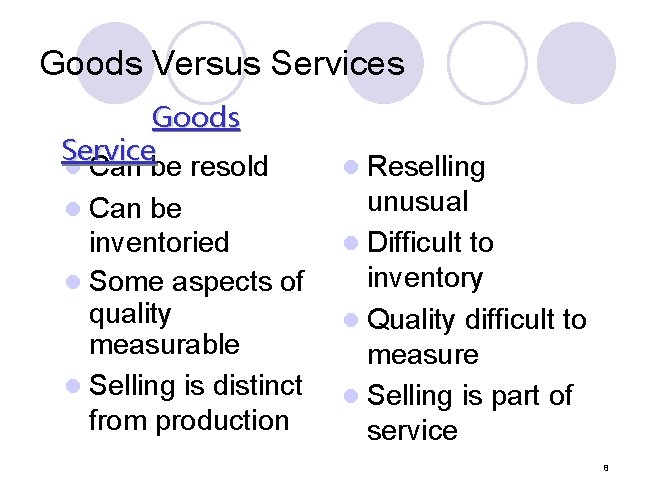
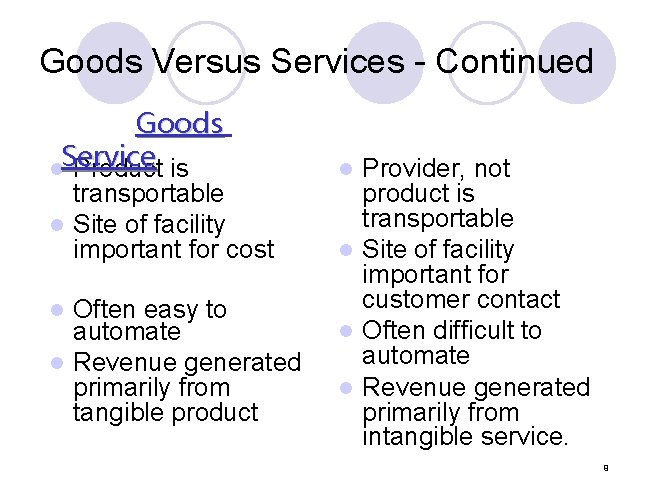
Goods Versus Services Goods Service l Can be resold l Can be inventoried l Some aspects of quality measurable l Selling is distinct from production l Reselling unusual l Difficult to inventory l Quality difficult to measure l Selling is part of service 8
Goods Versus Services - Continued Goods Service l Product is transportable l Site of facility important for cost Often easy to automate l Revenue generated primarily from tangible product l Provider, not product is transportable l Site of facility important for customer contact l Often difficult to automate l Revenue generated primarily from intangible service. l 9
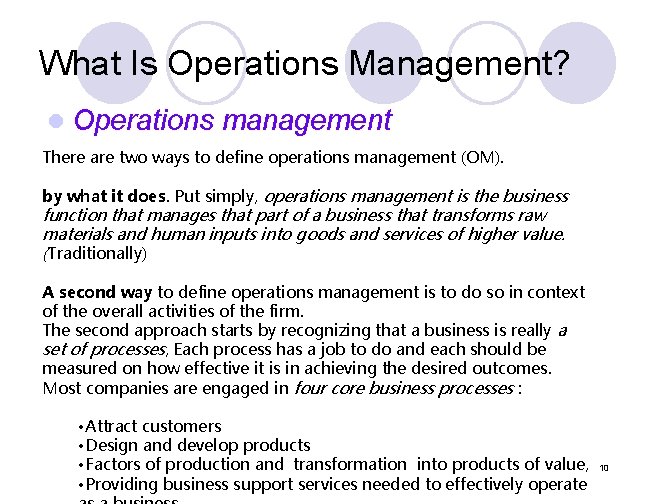
What Is Operations Management? l Operations management There are two ways to define operations management (OM). by what it does. Put simply, operations management is the business function that manages that part of a business that transforms raw materials and human inputs into goods and services of higher value. (Traditionally) A second way to define operations management is to do so in context of the overall activities of the firm. The second approach starts by recognizing that a business is really a set of processes, Each process has a job to do and each should be measured on how effective it is in achieving the desired outcomes. Most companies are engaged in four core business processes : • Attract customers • Design and develop products • Factors of production and transformation into products of value, • Providing business support services needed to effectively operate 10
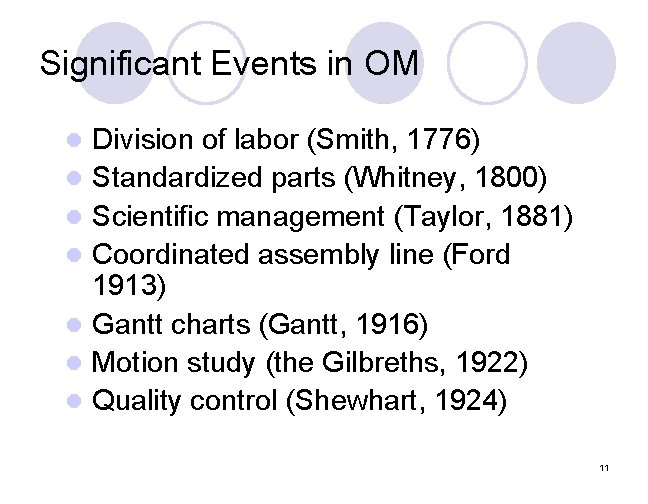
Significant Events in OM l l l l Division of labor (Smith, 1776) Standardized parts (Whitney, 1800) Scientific management (Taylor, 1881) Coordinated assembly line (Ford 1913) Gantt charts (Gantt, 1916) Motion study (the Gilbreths, 1922) Quality control (Shewhart, 1924) 11
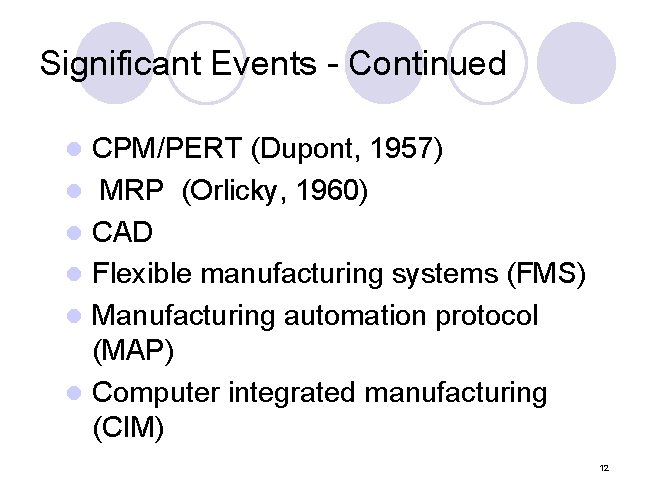
Significant Events - Continued l l l CPM/PERT (Dupont, 1957) MRP (Orlicky, 1960) CAD Flexible manufacturing systems (FMS) Manufacturing automation protocol (MAP) Computer integrated manufacturing (CIM) 12
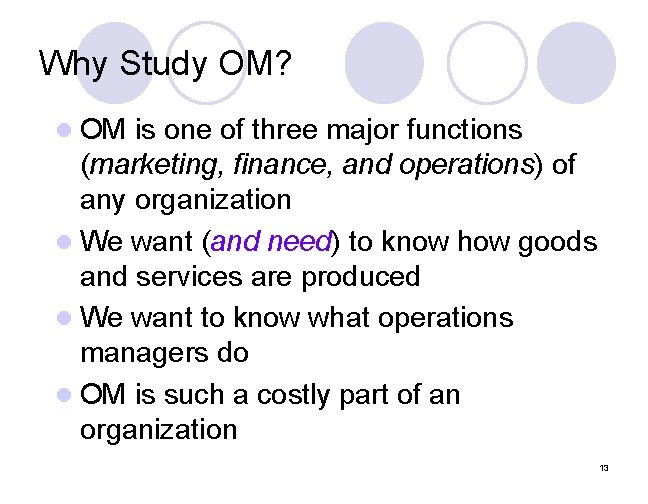
Why Study OM? l OM is one of three major functions (marketing, finance, and operations) of any organization l We want (and need) to know how goods and services are produced l We want to know what operations managers do l OM is such a costly part of an organization 13
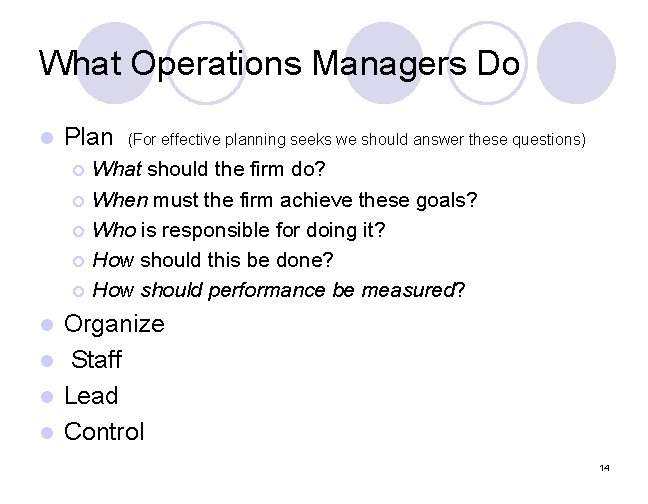
What Operations Managers Do l Plan ¡ ¡ ¡ (For effective planning seeks we should answer these questions) What should the firm do? When must the firm achieve these goals? Who is responsible for doing it? How should this be done? How should performance be measured? Organize l Staff l Lead l Control l 14
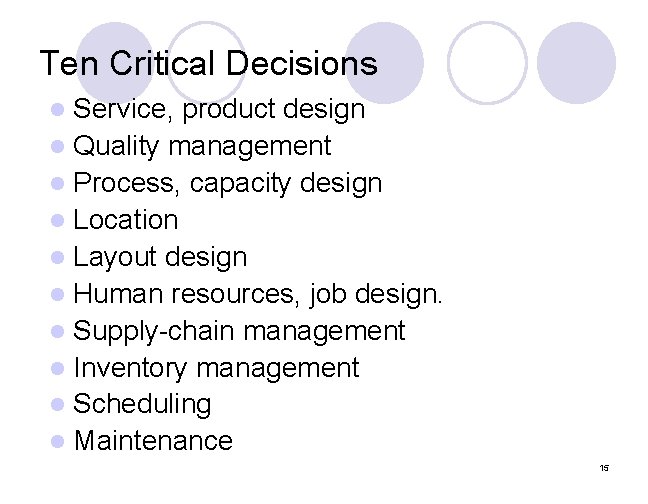
Ten Critical Decisions Service, product design l Quality management l Process, capacity design l Location l Layout design l Human resources, job design. l Supply-chain management l Inventory management l Scheduling l Maintenance l 15
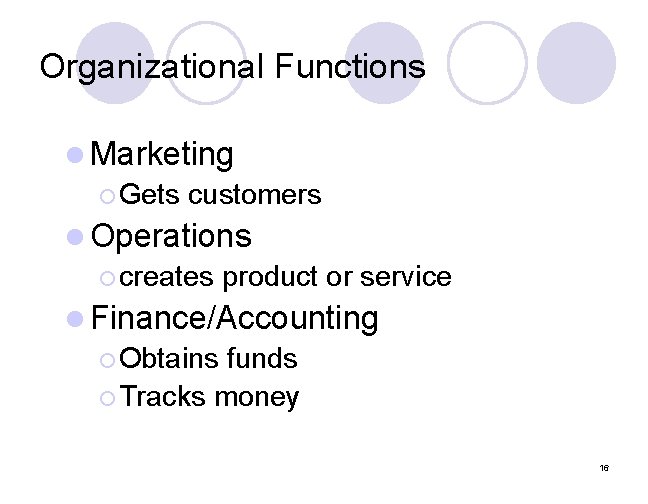
Organizational Functions l Marketing ¡ Gets customers l Operations ¡ creates product or service l Finance/Accounting ¡ Obtains funds ¡ Tracks money 16
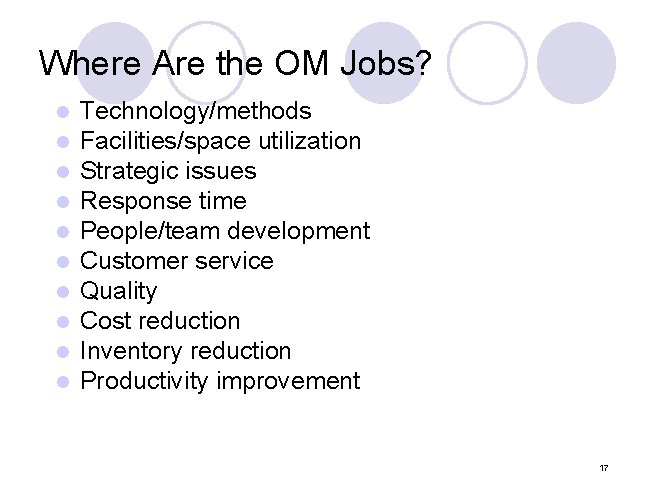
Where Are the OM Jobs? l l l l l Technology/methods Facilities/space utilization Strategic issues Response time People/team development Customer service Quality Cost reduction Inventory reduction Productivity improvement 17
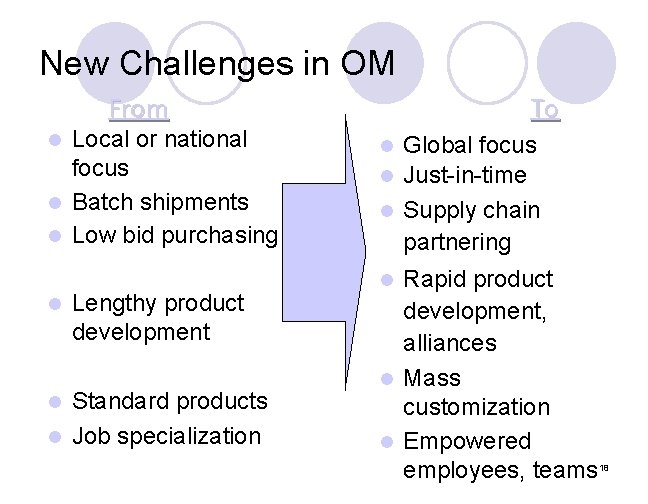
New Challenges in OM From l Local or national focus l Batch shipments l Low bid purchasing l Lengthy product development Standard products l Job specialization l To l Global focus l Just-in-time l Supply chain partnering Rapid product development, alliances l Mass customization l Empowered employees, teams l 18
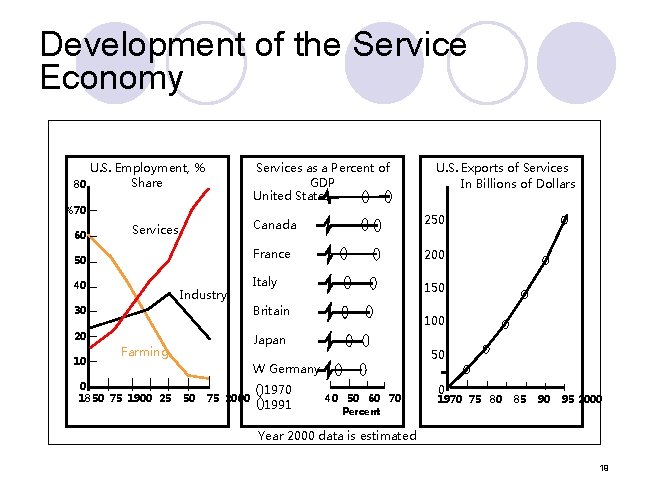
Development of the Service Economy U. S. Employment, % Share 80 Services as a Percent of GDP United States %70 60 Services 50 40 Industry 20 10 Canada 250 France 200 Italy 150 Britain 30 0 1850 75 1900 25 100 Japan Farming 50 W Germany 50 75 2000 U. S. Exports of Services In Billions of Dollars 1970 1991 40 50 60 70 Percent 0 1970 75 80 85 90 95 2000 Year 2000 data is estimated 19
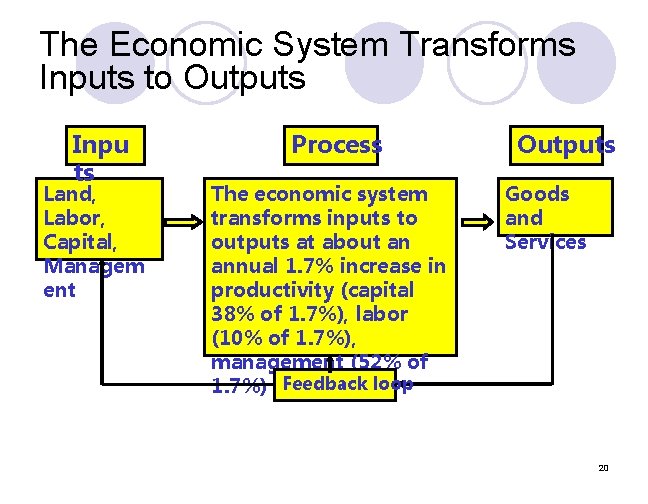
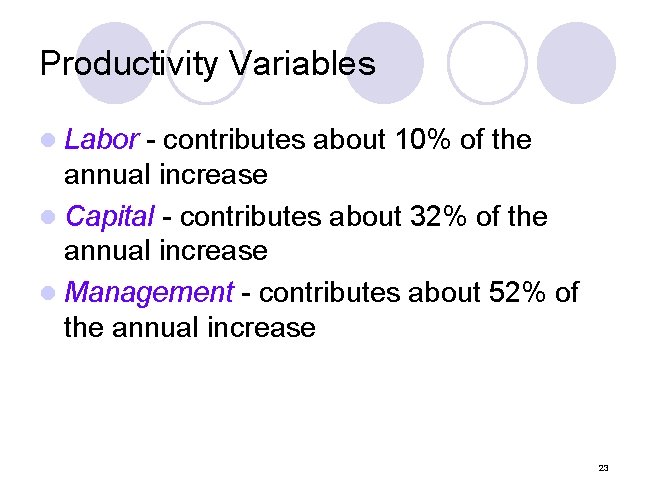
The Economic System Transforms Inputs to Outputs Inpu ts Land, Labor, Capital, Managem ent Process The economic system transforms inputs to outputs at about an annual 1. 7% increase in productivity (capital 38% of 1. 7%), labor (10% of 1. 7%), management (52% of 1. 7%) Feedback loop Outputs Goods and Services 20
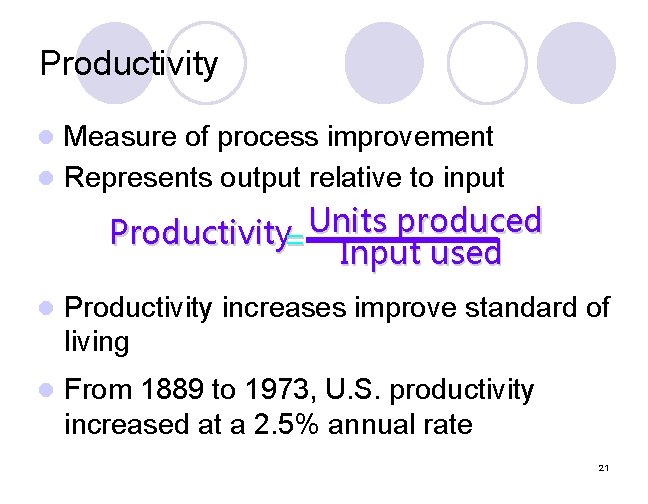
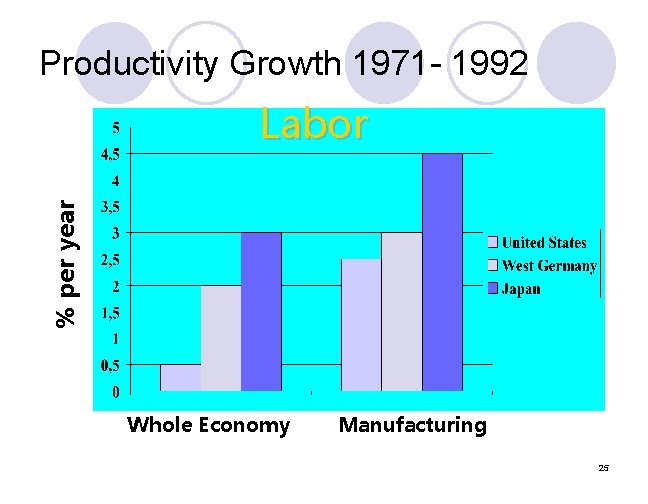
Productivity Measure of process improvement l Represents output relative to input l Productivity= Units produced Input used l Productivity increases improve standard of living l From 1889 to 1973, U. S. productivity increased at a 2. 5% annual rate 21
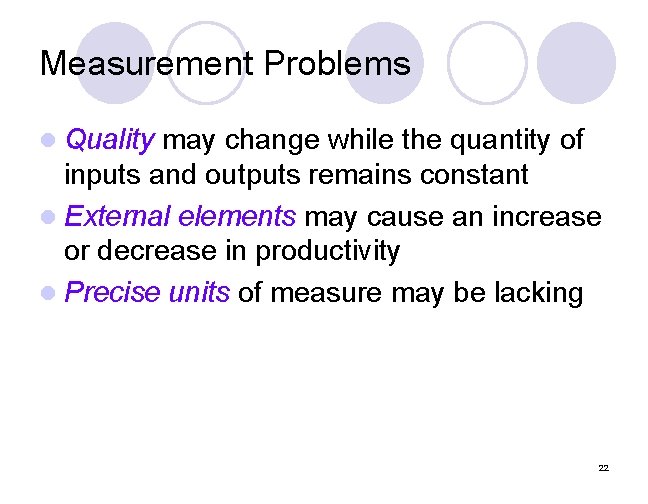
Measurement Problems l Quality may change while the quantity of inputs and outputs remains constant l External elements may cause an increase or decrease in productivity l Precise units of measure may be lacking 22
Productivity Variables l Labor - contributes about 10% of the annual increase l Capital - contributes about 32% of the annual increase l Management - contributes about 52% of the annual increase 23
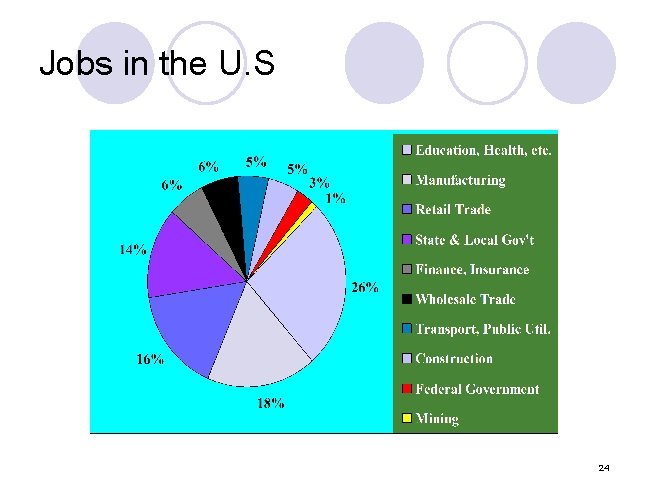
Jobs in the U. S 24
Productivity Growth 1971 - 1992 % per year Labor Whole Economy Manufacturing 25
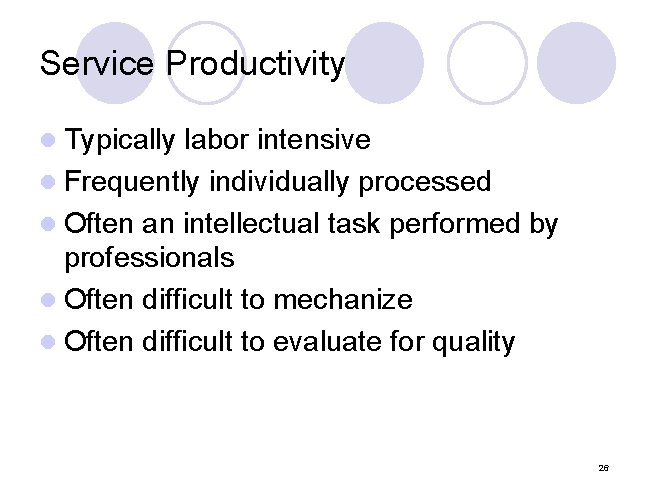
Service Productivity l Typically labor intensive l Frequently individually processed l Often an intellectual task performed by professionals l Often difficult to mechanize l Often difficult to evaluate for quality 26