Nordic EV Outlook 2018 Jacopo Tattini Copenhagen May

- Slides: 22
Nordic EV Outlook 2018 Jacopo Tattini Copenhagen, May 24 2018 IEA © OECD/IEA 2017
Electric Vehicles Initiative (EVI) • Government-to-government forum comprising 13 countries • Currently co-chaired by Canada, China and the United States*, and coordinated by the IEA • Released several analytical publications (Global EV Outlook, Nordic EV Outlook, City casebook) • Instrumental to mobilize action and commitments (Paris Declaration on Electro-Mobility and Climate Change at COP 21, Government Fleet Declaration at COP 22) Ø New project in preparation with the Global Environment Facility and UNEP for support to EV policy-making Ø Launched the EV 30@30 Campaign in June 2017, aiming to achieve a 30% market share for EVs by 2030 Ø Building of the Pilot City Programme network of cities (launch at CEM 9, Copenhagen, 24 May) EV 30@30 supporters: *U. S. co-leadership under review © OECD/IEA 2017
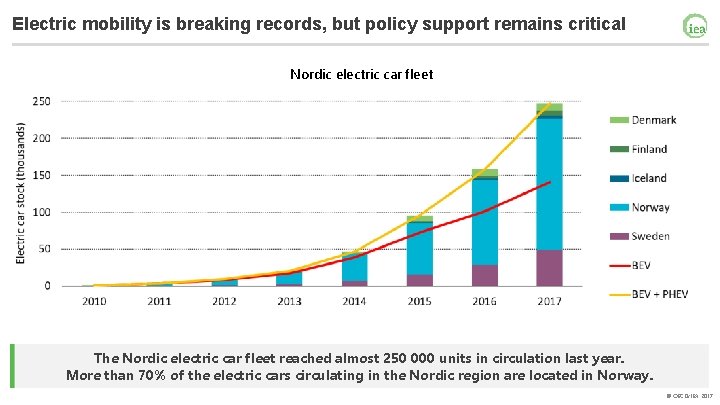
Electric mobility is breaking records, but policy support remains critical Nordic electric car fleet The Nordic electric car fleet reached almost 250 000 units in circulation last year. More than 70% of the electric cars circulating in the Nordic region are located in Norway. © OECD/IEA 2017
New electric car registrations almost 90 000 units in 2017 Electric car sales, market share, and BEV and PHEV sales, 2010 -17 2017 new electric car sales and market share increased in all Nordic countries but in Denmark. BEVs prevail in Norway and Denmark, while Finland, Iceland Sweden buy more PHEVs. © OECD/IEA 2017
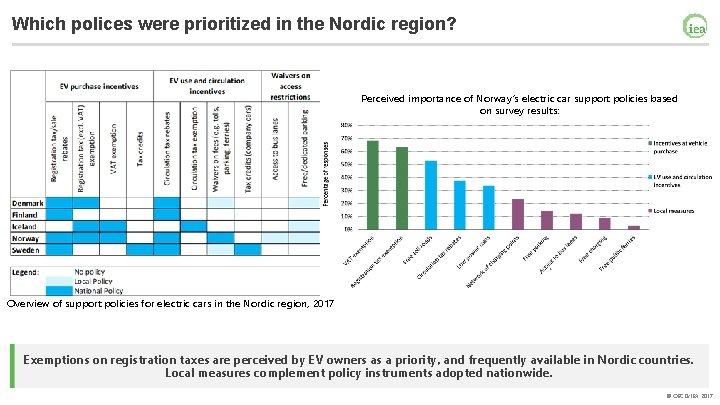
Which polices were prioritized in the Nordic region? Perceived importance of Norway’s electric car support policies based on survey results: Overview of support policies for electric cars in the Nordic region, 2017 Exemptions on registration taxes are perceived by EV owners as a priority, and frequently available in Nordic countries. Local measures complement policy instruments adopted nationwide. © OECD/IEA 2017
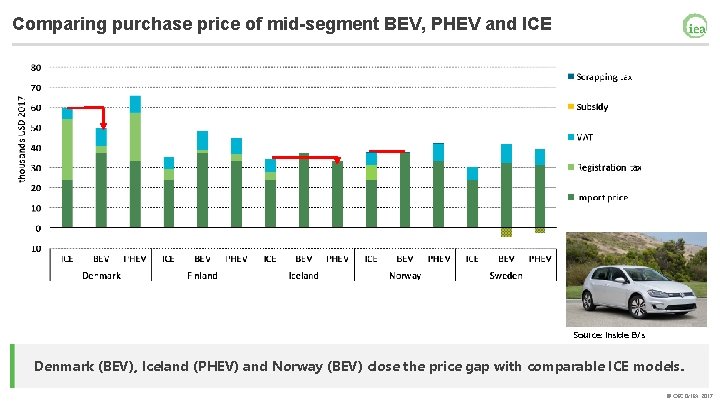
Comparing purchase price of mid-segment BEV, PHEV and ICE Source: Inside EVs Denmark (BEV), Iceland (PHEV) and Norway (BEV) close the price gap with comparable ICE models. © OECD/IEA 2017
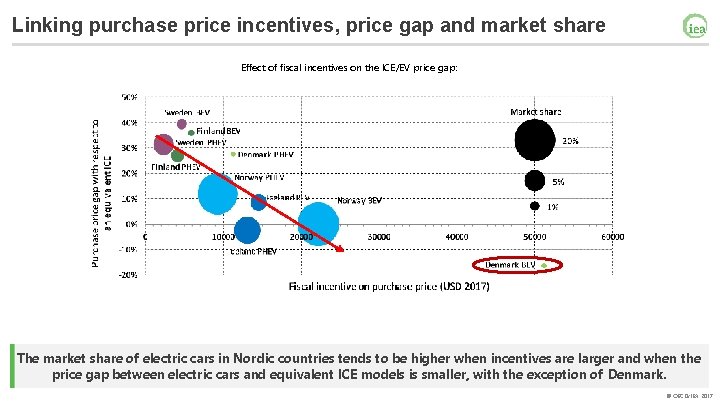
Linking purchase price incentives, price gap and market share Effect of fiscal incentives on the ICE/EV price gap: The market share of electric cars in Nordic countries tends to be higher when incentives are larger and when the price gap between electric cars and equivalent ICE models is smaller, with the exception of Denmark. © OECD/IEA 2017
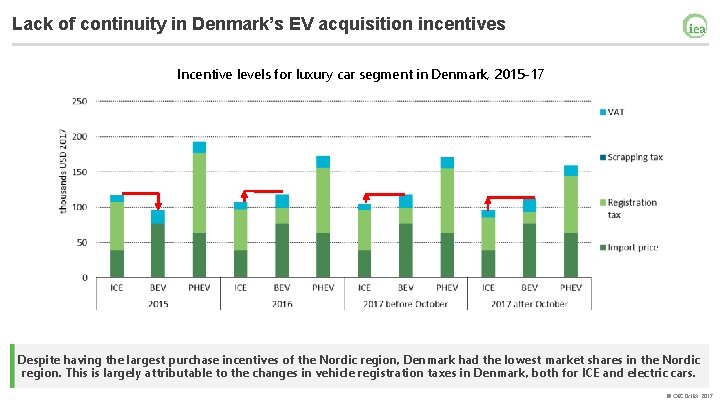
Lack of continuity in Denmark’s EV acquisition incentives Incentive levels for luxury car segment in Denmark, 2015 -17 Despite having the largest purchase incentives of the Nordic region, Denmark had the lowest market shares in the Nordic region. This is largely attributable to the changes in vehicle registration taxes in Denmark, both for ICE and electric cars. © OECD/IEA 2017
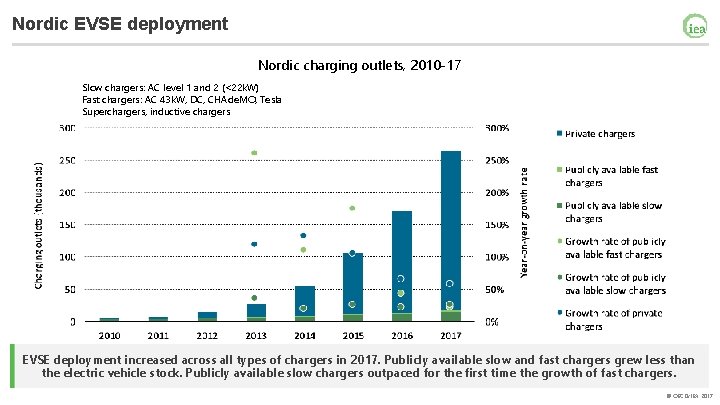
Nordic EVSE deployment Nordic charging outlets, 2010 -17 Slow chargers: AC level 1 and 2 (<22 k. W) Fast chargers: AC 43 k. W, DC, CHAde. MO, Tesla Superchargers, inductive chargers EVSE deployment increased across all types of chargers in 2017. Publicly available slow and fast chargers grew less than the electric vehicle stock. Publicly available slow chargers outpaced for the first time the growth of fast chargers. © OECD/IEA 2017
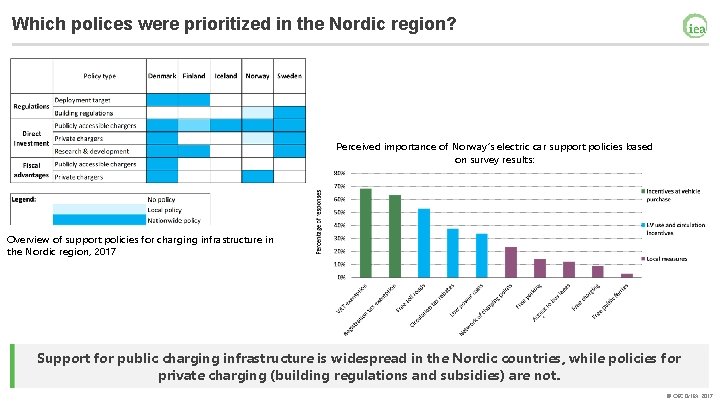
Which polices were prioritized in the Nordic region? Perceived importance of Norway’s electric car support policies based on survey results: Overview of support policies for charging infrastructure in the Nordic region, 2017 Support for public charging infrastructure is widespread in the Nordic countries, while policies for private charging (building regulations and subsidies) are not. © OECD/IEA 2017
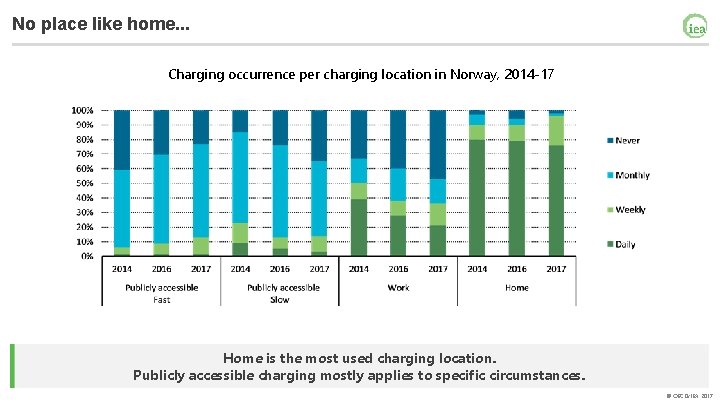
No place like home. . . Charging occurrence per charging location in Norway, 2014 -17 Home is the most used charging location. Publicly accessible charging mostly applies to specific circumstances. © OECD/IEA 2017
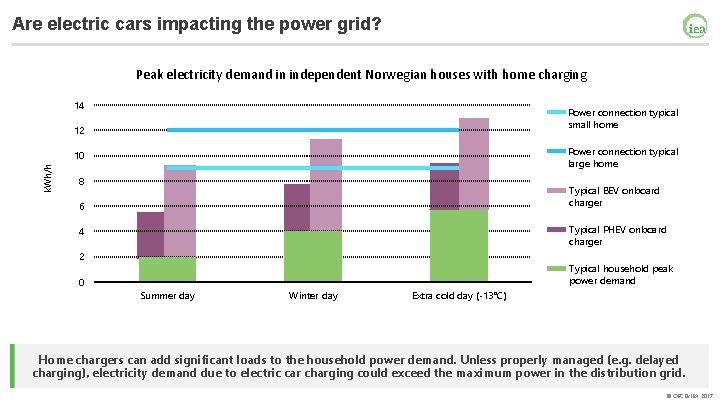
Are electric cars impacting the power grid? Peak electricity demand in independent Norwegian houses with home charging 14 Power connection typical small home 12 Power connection typical large home k. Wh/h 10 8 Typical BEV onboard charger 6 Typical PHEV onboard charger 4 2 0 Typical household peak power demand Summer day Winter day Extra cold day (-13°C) Home chargers can add significant loads to the household power demand. Unless properly managed (e. g. delayed charging), electricity demand due to electric car charging could exceed the maximum power in the distribution grid. © OECD/IEA 2017
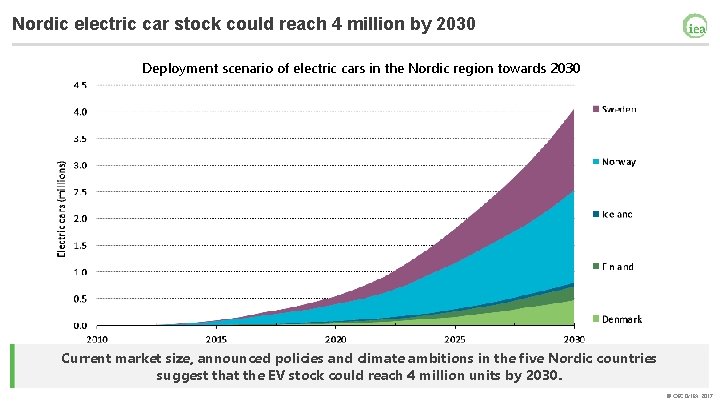
Nordic electric car stock could reach 4 million by 2030 Deployment scenario of electric cars in the Nordic region towards 2030 Current market size, announced policies and climate ambitions in the five Nordic countries suggest that the EV stock could reach 4 million units by 2030. © OECD/IEA 2017
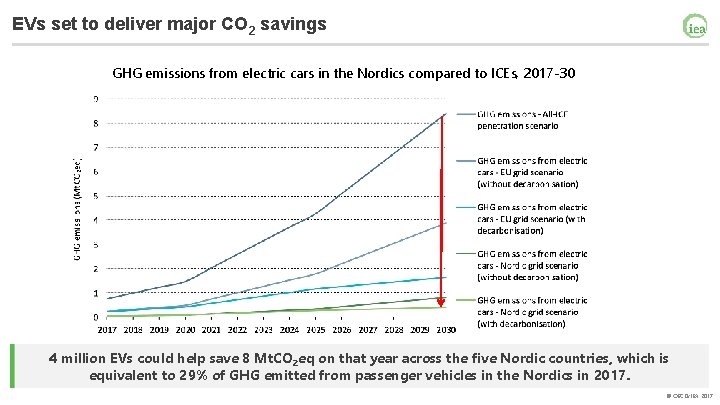
EVs set to deliver major CO 2 savings GHG emissions from electric cars in the Nordics compared to ICEs, 2017 -30 4 million EVs could help save 8 Mt. CO 2 eq on that year across the five Nordic countries, which is equivalent to 29% of GHG emitted from passenger vehicles in the Nordics in 2017. © OECD/IEA 2017
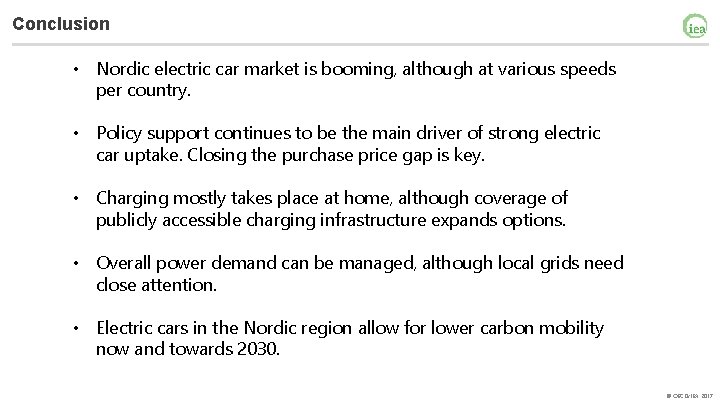
Conclusion • Nordic electric car market is booming, although at various speeds per country. • Policy support continues to be the main driver of strong electric car uptake. Closing the purchase price gap is key. • Charging mostly takes place at home, although coverage of publicly accessible charging infrastructure expands options. • Overall power demand can be managed, although local grids need close attention. • Electric cars in the Nordic region allow for lower carbon mobility now and towards 2030. © OECD/IEA 2017
Questions? transport@iea. org https: //www. iea. org/publications/freepublications/publication/nordic-ev-outlook-2018. html © OECD/IEA 2017
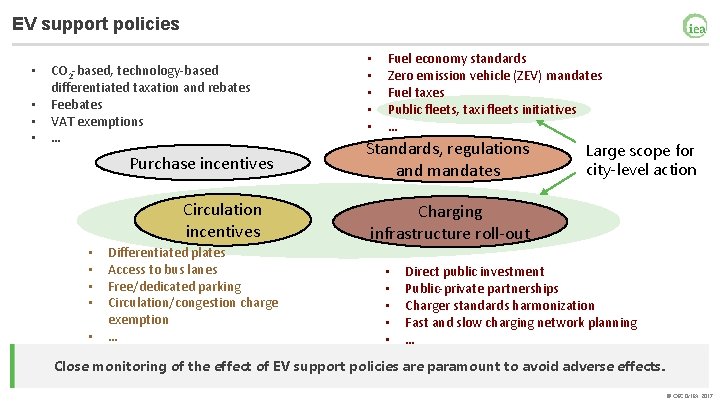
EV support policies • • CO 2 -based, technology-based differentiated taxation and rebates Feebates VAT exemptions … Purchase incentives Circulation incentives • • • Differentiated plates Access to bus lanes Free/dedicated parking Circulation/congestion charge exemption … • • • Fuel economy standards Zero emission vehicle (ZEV) mandates Fuel taxes Public fleets, taxi fleets initiatives … Standards, regulations and mandates Large scope for city-level action Charging infrastructure roll-out • • • Direct public investment Public-private partnerships Charger standards harmonization Fast and slow charging network planning … Close monitoring of the effect of EV support policies are paramount to avoid adverse effects. © OECD/IEA 2017
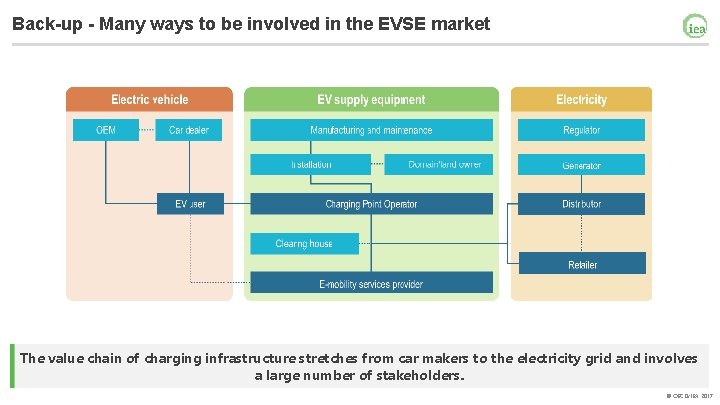
Back-up - Many ways to be involved in the EVSE market The value chain of charging infrastructure stretches from car makers to the electricity grid and involves a large number of stakeholders. © OECD/IEA 2017
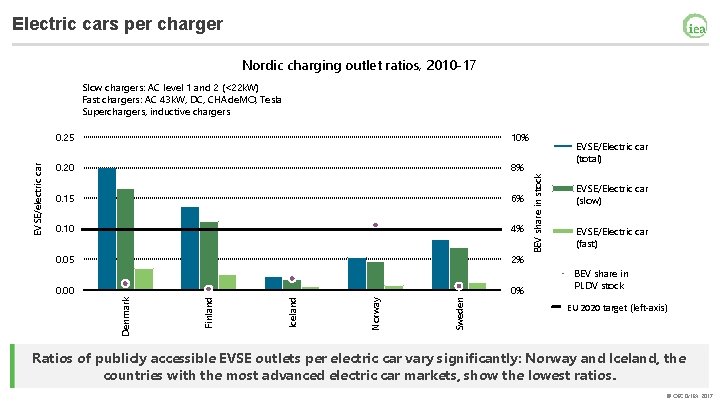
Electric cars per charger Nordic charging outlet ratios, 2010 -17 0. 25 10% 0. 20 8% 0. 15 6% 0. 10 4% 0. 05 2% Sweden Norway Iceland Finland 0% Denmark 0. 00 EVSE/Electric car (total) BEV share in stock EVSE/electric car Slow chargers: AC level 1 and 2 (<22 k. W) Fast chargers: AC 43 k. W, DC, CHAde. MO, Tesla Superchargers, inductive chargers EVSE/Electric car (slow) EVSE/Electric car (fast) BEV share in PLDV stock EU 2020 target (left-axis) Ratios of publicly accessible EVSE outlets per electric car vary significantly: Norway and Iceland, the countries with the most advanced electric car markets, show the lowest ratios. © OECD/IEA 2017
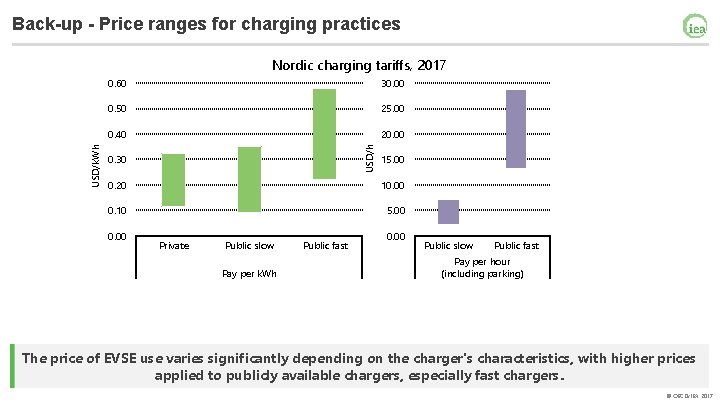
Back-up - Price ranges for charging practices 0. 60 30. 00 0. 50 25. 00 0. 40 20. 00 USD/h USD/k. Wh Nordic charging tariffs, 2017 0. 30 15. 00 0. 20 10. 00 0. 10 5. 00 0. 00 Private Public slow Pay per k. Wh Public fast 0. 00 Public slow Public fast Pay per hour (including parking) The price of EVSE use varies significantly depending on the charger's characteristics, with higher prices applied to publicly available chargers, especially fast chargers. © OECD/IEA 2017
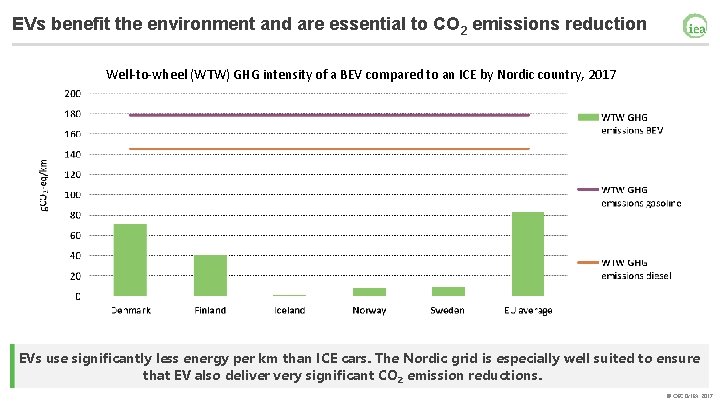
EVs benefit the environment and are essential to CO 2 emissions reduction Well-to-wheel (WTW) GHG intensity of a BEV compared to an ICE by Nordic country, 2017 EVs use significantly less energy per km than ICE cars. The Nordic grid is especially well suited to ensure that EV also deliver very significant CO 2 emission reductions. © OECD/IEA 2017
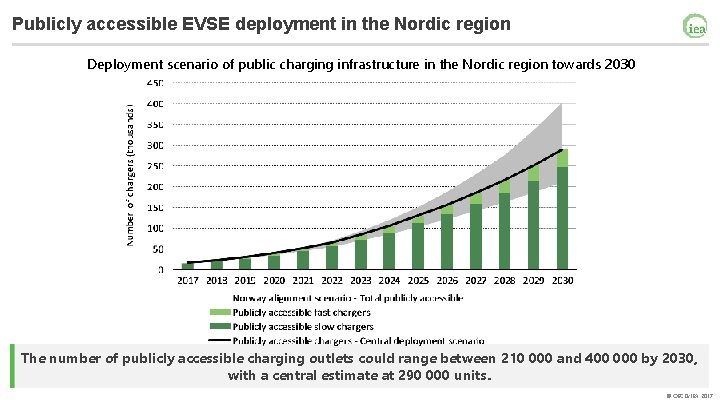
Publicly accessible EVSE deployment in the Nordic region Deployment scenario of public charging infrastructure in the Nordic region towards 2030 The number of publicly accessible charging outlets could range between 210 000 and 400 000 by 2030, with a central estimate at 290 000 units. © OECD/IEA 2017