
EMS Annual Meeting 2019 Copenhagen 9 13 September

EMS Annual Meeting 2019, Copenhagen, 9 -13 September 2019 Nonlinearity in global teleconnection patterns JIŘÍ MIKŠOVSKÝ Department of Atmospheric Physics, Charles University, Prague, Czech Republic Global Change Research Institute, Czech Academy of Sciences, Brno, Czech Republic jiri@miksovsky. info http: //www. miksovsky. info/EMS 2019. pptx
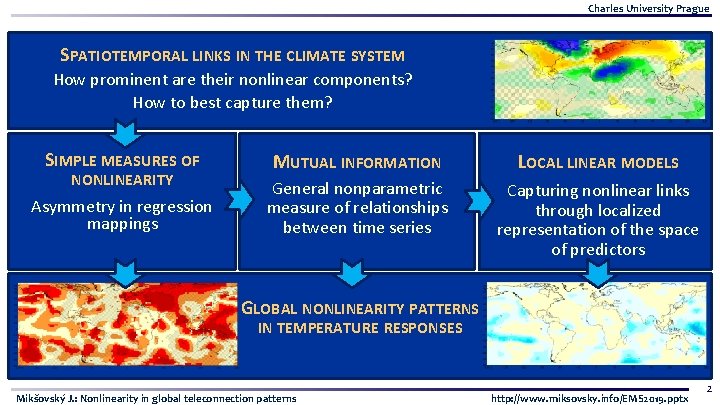
Charles University Prague SPATIOTEMPORAL LINKS IN THE CLIMATE SYSTEM How prominent are their nonlinear components? How to best capture them? SIMPLE MEASURES OF MUTUAL INFORMATION LOCAL LINEAR MODELS Asymmetry in regression mappings General nonparametric measure of relationships between time series Capturing nonlinear links through localized representation of the space of predictors NONLINEARITY GLOBAL NONLINEARITY PATTERNS IN TEMPERATURE RESPONSES Mikšovský J. : Nonlinearity in global teleconnection patterns http: //www. miksovsky. info/EMS 2019. pptx 2
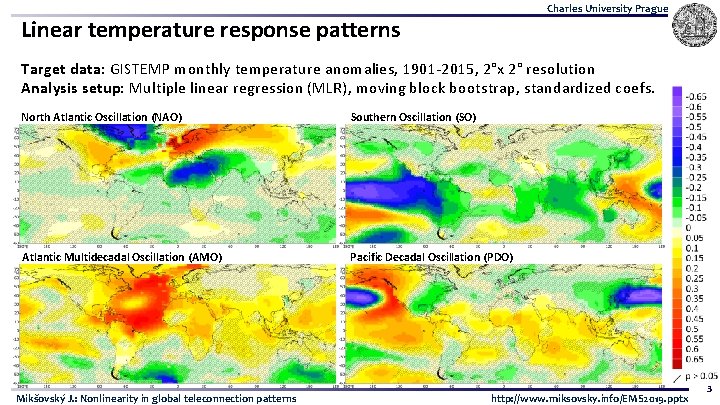
Charles University Prague Linear temperature response patterns Target data: GISTEMP monthly temperature anomalies, 1901 -2015, 2°x 2° resolution Analysis setup: Multiple linear regression (MLR), moving block bootstrap, standardized coefs. North Atlantic Oscillation (NAO) Southern Oscillation (SO) Atlantic Multidecadal Oscillation (AMO) Pacific Decadal Oscillation (PDO) Mikšovský J. : Nonlinearity in global teleconnection patterns http: //www. miksovsky. info/EMS 2019. pptx 3
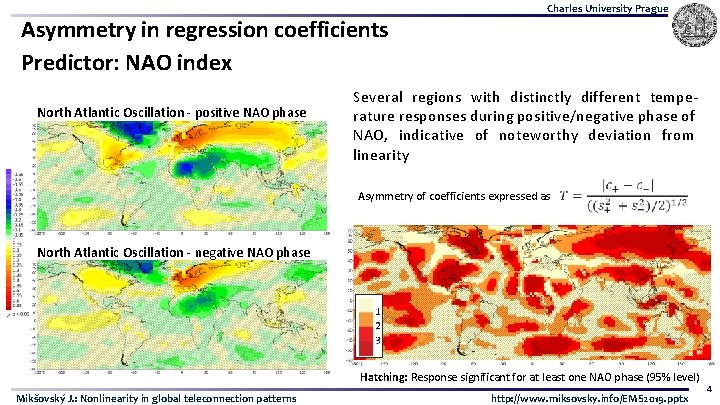
Asymmetry in regression coefficients Predictor: NAO index North Atlantic Oscillation - positive NAO phase Charles University Prague Several regions with distinctly different temperature responses during positive/negative phase of NAO, indicative of noteworthy deviation from linearity Asymmetry of coefficients expressed as North Atlantic Oscillation - negative NAO phase Hatching: Response significant for at least one NAO phase (95% level) Mikšovský J. : Nonlinearity in global teleconnection patterns http: //www. miksovsky. info/EMS 2019. pptx 4
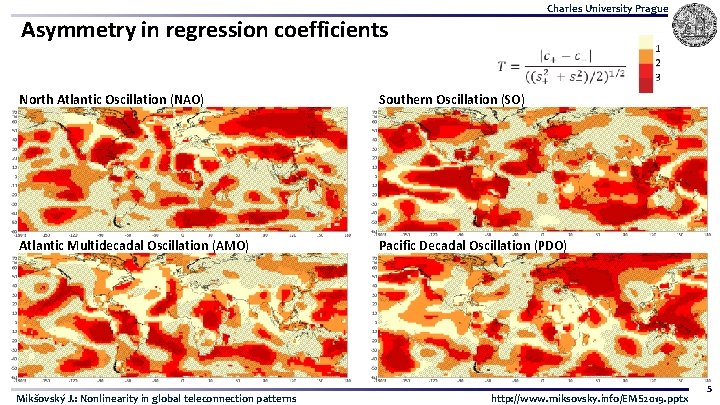
Charles University Prague Asymmetry in regression coefficients North Atlantic Oscillation (NAO) Southern Oscillation (SO) Atlantic Multidecadal Oscillation (AMO) Pacific Decadal Oscillation (PDO) Mikšovský J. : Nonlinearity in global teleconnection patterns http: //www. miksovsky. info/EMS 2019. pptx 5
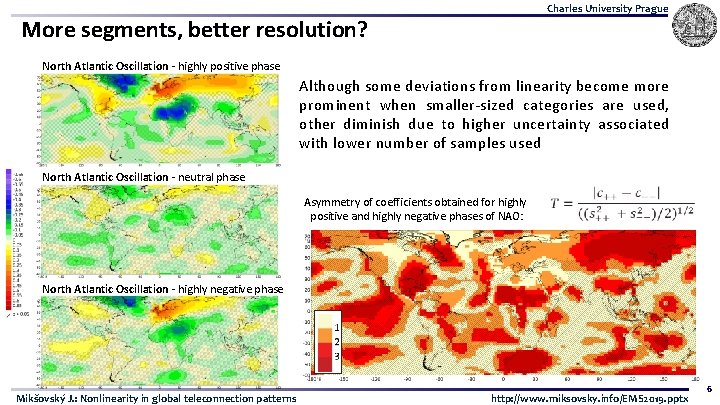
Charles University Prague More segments, better resolution? North Atlantic Oscillation - highly positive phase Although some deviations from linearity become more prominent when smaller-sized categories are used, other diminish due to higher uncertainty associated with lower number of samples used North Atlantic Oscillation - neutral phase Asymmetry of coefficients obtained for highly positive and highly negative phases of NAO: North Atlantic Oscillation - highly negative phase Mikšovský J. : Nonlinearity in global teleconnection patterns http: //www. miksovsky. info/EMS 2019. pptx 6
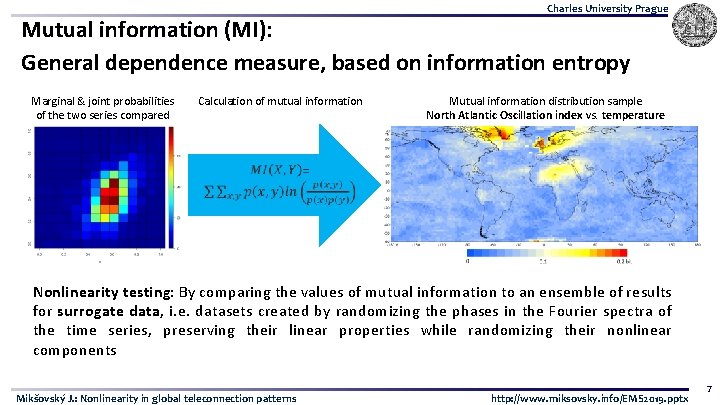
Charles University Prague Mutual information (MI): General dependence measure, based on information entropy Marginal & joint probabilities of the two series compared Calculation of mutual information Mutual information distribution sample North Atlantic Oscillation index vs. temperature Nonlinearity testing: By comparing the values of mutual information to an ensemble of results for surrogate data, i. e. datasets created by randomizing the phases in the Fourier spectra of the time series, preserving their linear properties while randomizing their nonlinear components Mikšovský J. : Nonlinearity in global teleconnection patterns http: //www. miksovsky. info/EMS 2019. pptx 7
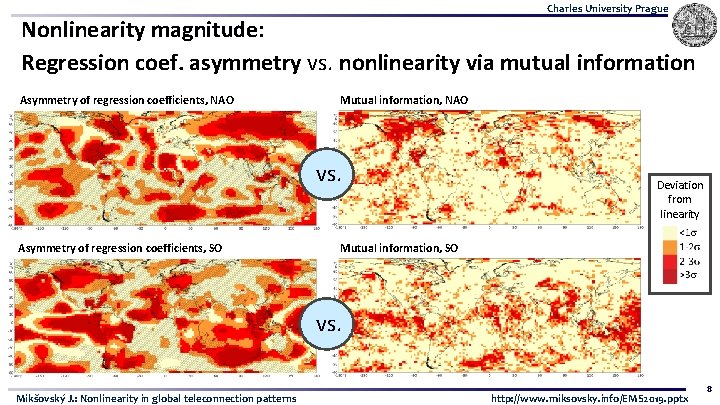
Charles University Prague Nonlinearity magnitude: Regression coef. asymmetry vs. nonlinearity via mutual information Asymmetry of regression coefficients, NAO Mutual information, NAO vs. Asymmetry of regression coefficients, SO Deviation from linearity Mutual information, SO vs. Mikšovský J. : Nonlinearity in global teleconnection patterns http: //www. miksovsky. info/EMS 2019. pptx 8
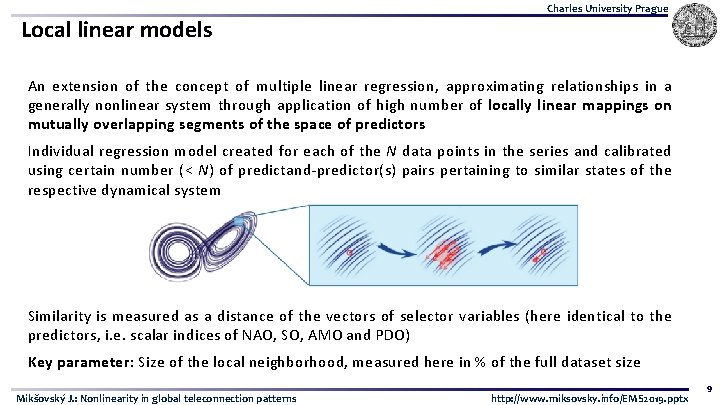
Local linear models Charles University Prague An extension of the concept of multiple linear regression, approximating relationships in a generally nonlinear system through application of high number of locally linear mappings on mutually overlapping segments of the space of predictors Individual regression model created for each of the N data points in the series and calibrated using certain number (< N) of predictand-predictor(s) pairs pertaining to similar states of the respective dynamical system Similarity is measured as a distance of the vectors of selector variables (here identical to the predictors, i. e. scalar indices of NAO, SO, AMO and PDO) Key parameter: Size of the local neighborhood, measured here in % of the full dataset size Mikšovský J. : Nonlinearity in global teleconnection patterns http: //www. miksovsky. info/EMS 2019. pptx 9
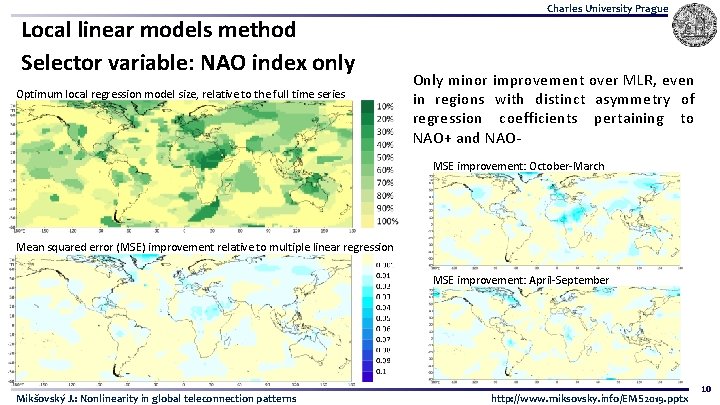
Local linear models method Selector variable: NAO index only Optimum local regression model size, relative to the full time series Charles University Prague Only minor improvement over MLR, even in regions with distinct asymmetry of regression coefficients pertaining to NAO+ and NAOMSE improvement: October-March Mean squared error (MSE) improvement relative to multiple linear regression MSE improvement: April-September Mikšovský J. : Nonlinearity in global teleconnection patterns http: //www. miksovsky. info/EMS 2019. pptx 10
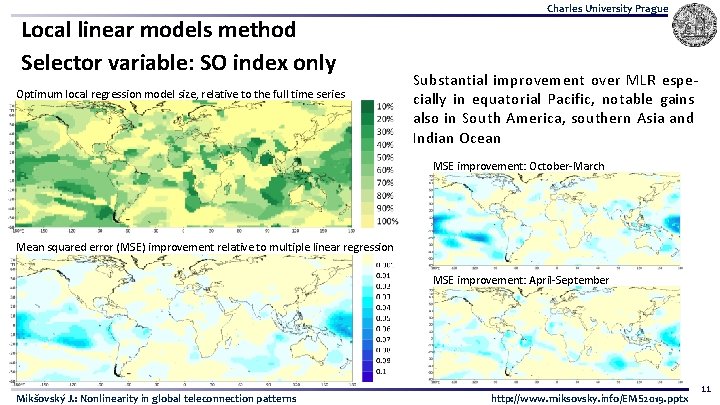
Local linear models method Selector variable: SO index only Optimum local regression model size, relative to the full time series Charles University Prague Substantial improvement over MLR especially in equatorial Pacific, notable gains also in South America, southern Asia and Indian Ocean MSE improvement: October-March Mean squared error (MSE) improvement relative to multiple linear regression MSE improvement: April-September Mikšovský J. : Nonlinearity in global teleconnection patterns http: //www. miksovsky. info/EMS 2019. pptx 11
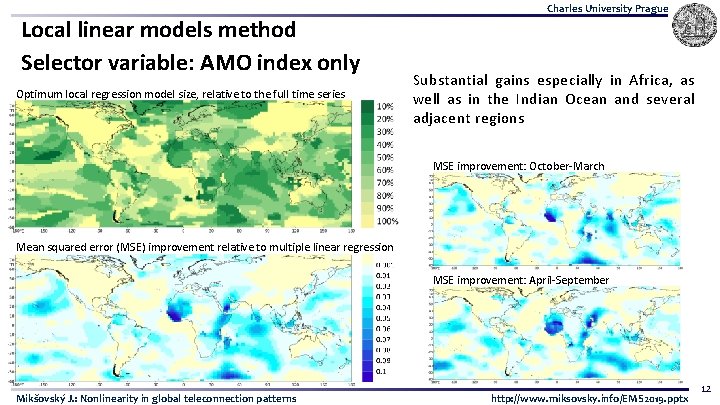
Local linear models method Selector variable: AMO index only Optimum local regression model size, relative to the full time series Charles University Prague Substantial gains especially in Africa, as well as in the Indian Ocean and several adjacent regions MSE improvement: October-March Mean squared error (MSE) improvement relative to multiple linear regression MSE improvement: April-September Mikšovský J. : Nonlinearity in global teleconnection patterns http: //www. miksovsky. info/EMS 2019. pptx 12
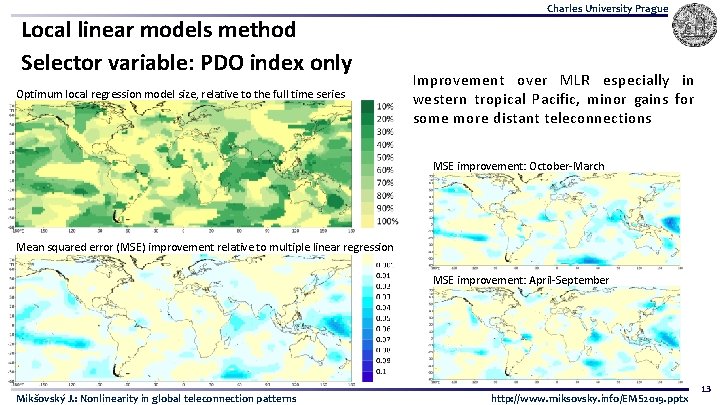
Local linear models method Selector variable: PDO index only Optimum local regression model size, relative to the full time series Charles University Prague Improvement over MLR especially in western tropical Pacific, minor gains for some more distant teleconnections MSE improvement: October-March Mean squared error (MSE) improvement relative to multiple linear regression MSE improvement: April-September Mikšovský J. : Nonlinearity in global teleconnection patterns http: //www. miksovsky. info/EMS 2019. pptx 13
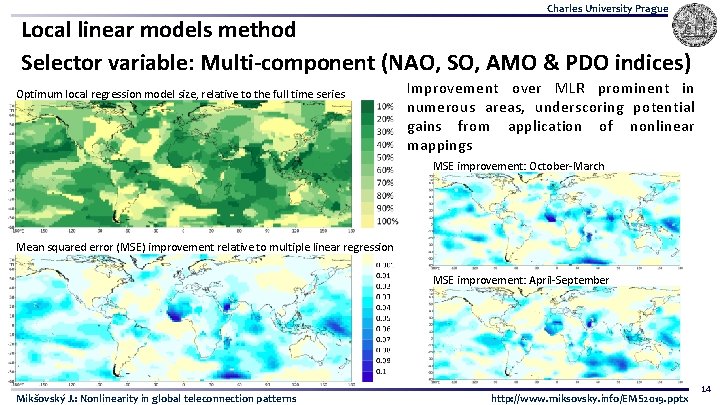
Charles University Prague Local linear models method Selector variable: Multi-component (NAO, SO, AMO & PDO indices) Optimum local regression model size, relative to the full time series Improvement over MLR prominent in numerous areas, underscoring potential gains from application of nonlinear mappings MSE improvement: October-March Mean squared error (MSE) improvement relative to multiple linear regression MSE improvement: April-September Mikšovský J. : Nonlinearity in global teleconnection patterns http: //www. miksovsky. info/EMS 2019. pptx 14
Highlight points Charles University Prague Nonlinearities are not universally detectable in all links and teleconnections, but can be noteworthy for some regions and seasons Even when deviations from linearity are statistically significant, nonlinearity-sensitive techniques may not provide major practical improvement over their linear counterparts (e. g. in terms of substantial increase of variance explained) Different nonlinearity detection/capture techniques reflect different aspects of the links studied - their specific choice should correspond to the nature of the task at hand Additional potentially relevant issues: o Effects of seasonality: individual seasons, even months can be associated with specific links, both linear and nonlinear; suitable seasonal division may differ from region to region o Time-delayed responses o Cross-predictor (cross-teleconnection) interactions Mikšovský J. : Nonlinearity in global teleconnection patterns http: //www. miksovsky. info/EMS 2019. pptx 15

Charles University Prague Thank you for your attention jiri@miksovsky. info http: //www. miksovsky. info/EMS 2019. pptx Mikšovský J. : Nonlinearity in global teleconnection patterns http: //www. miksovsky. info/EMS 2019. pptx 16
- Slides: 16