Moderation Assumptions David A Kenny What Are They

- Slides: 26
Moderation: Assumptions David A. Kenny
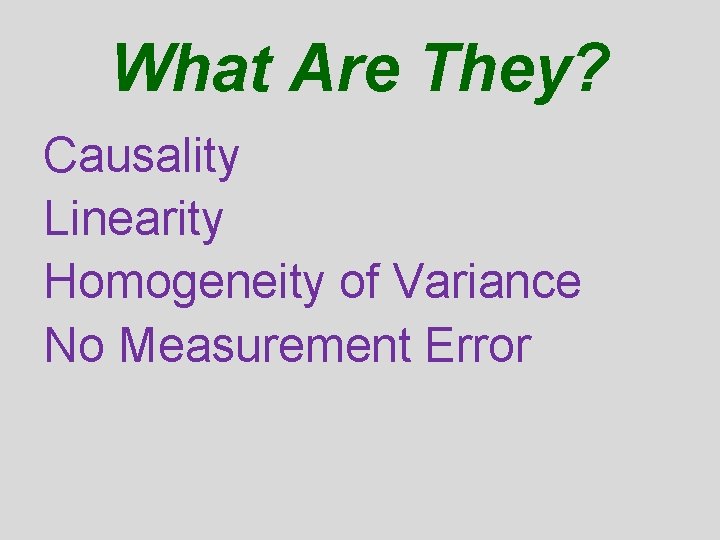
What Are They? Causality Linearity Homogeneity of Variance No Measurement Error
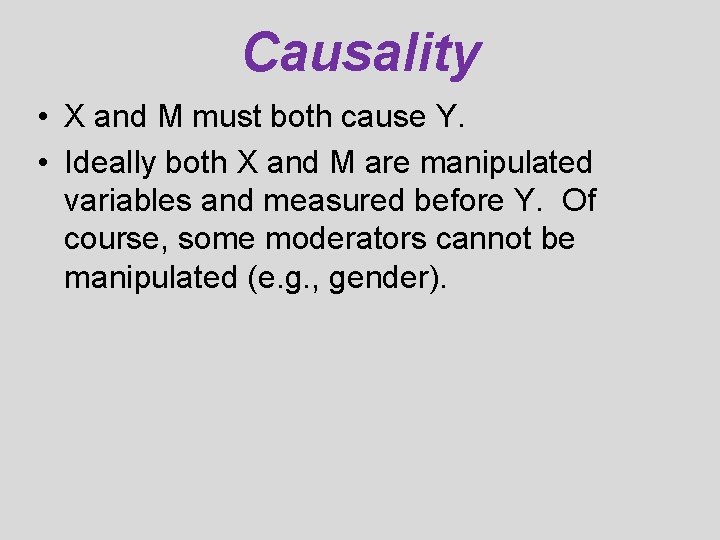
Causality • X and M must both cause Y. • Ideally both X and M are manipulated variables and measured before Y. Of course, some moderators cannot be manipulated (e. g. , gender).
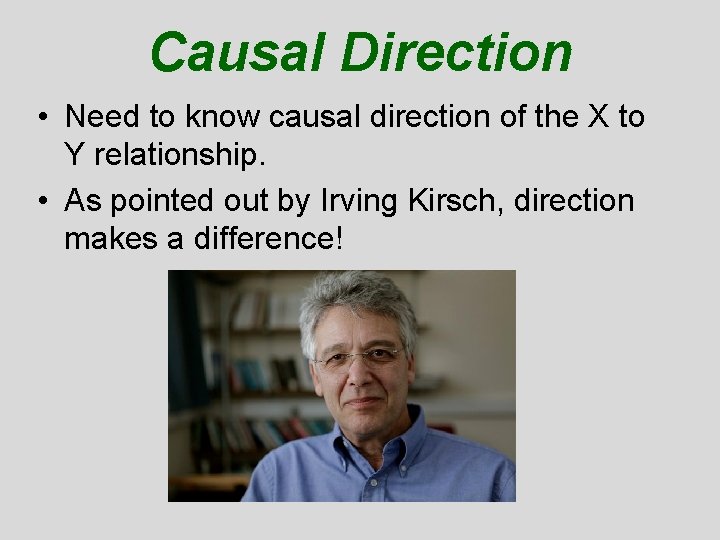
Causal Direction • Need to know causal direction of the X to Y relationship. • As pointed out by Irving Kirsch, direction makes a difference!
Surprising Illustration • Judd & Kenny (2010, Handbook of Social Psychology), pp. 121 -2 (see Table 4. 1). • A dichotomous moderator with categories A and B • The X Y effect can be stronger for the A’s than the B’s. • The Y X effect can be stronger for the B’s than the A’s.
Direction of Causality Unclear • In some cases, causality is unclear or the two variables may not even be a direct causal relationship. • Should not conduct a moderated regression analysis. • Tests for differences in variances in X and Y, and if no difference, test for differences in correlation.
Crazy Idea? • Assume that either X Y or Y X. • Given parsimony, moderator effects should be relatively weak. • Pick the causal direction by the one with fewer moderator effects.
Proxy Moderator • Say we find that Gender moderates the X Y relationship. • Is it gender or something correlated with gender: height, social roles, power, or some other variable. • Moderators can suggest possible mediators.
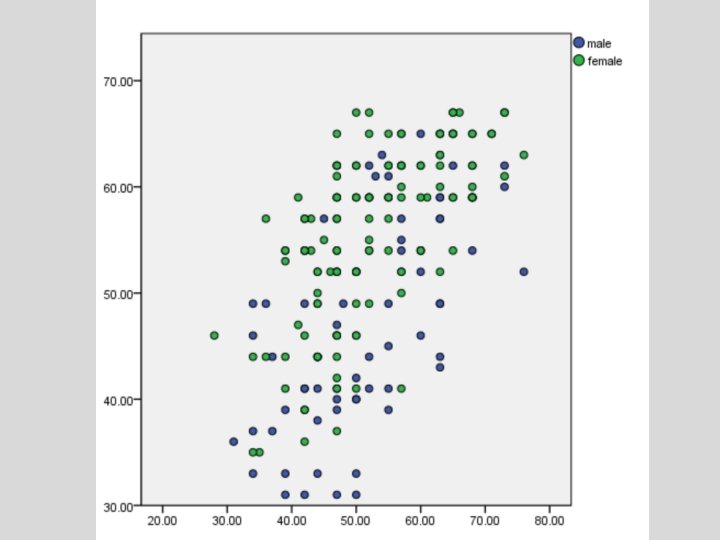
Graphing • Helpful to look for violations of linearity and homogeneity of variance assumptions. • M is categorical. • Display the points for M in a scatterplot by different symbols. • See if the gap between M categories change in a nonlinear way.
Linearity • Using a product term implies a linear relationship between M and X to Y relationship: linear moderation. –The effect of X on Y changes by a constant amount as M increases or decreases. • It is also assumed that the X Y effect is linear: linear effect of X.
Alternative to Linear Moderation • Threshold model: For X to cause Y, M must be greater (lesser) than a particular value. • The value of M at which the effect of X on Y changes might be empirically determined by adapting an approach described by Hamaker, Grasman, and Kamphuis (2010).
Second Alternative to Linear Moderation • Curvilinear model: As M increases (decreases), the effect of X on Y increases but when M gets to a particular value the effect reverses.
Testing Linear Moderation • Add M 2 and XM 2 to the regression equation. • Test the XM 2 coefficient. – If positive, the X Y effect accelerates as M increases. – If negative, then the X Y effect de -accelerates as M increases. • If significant, consider a transformation of M.
The Linear Effect of X • Graph the data and look for nonlinearities. • Add X 2 and X 2 M to the regression equation. • Test the X 2 and X 2 M coefficients. • If significant, consider a transformation of X.
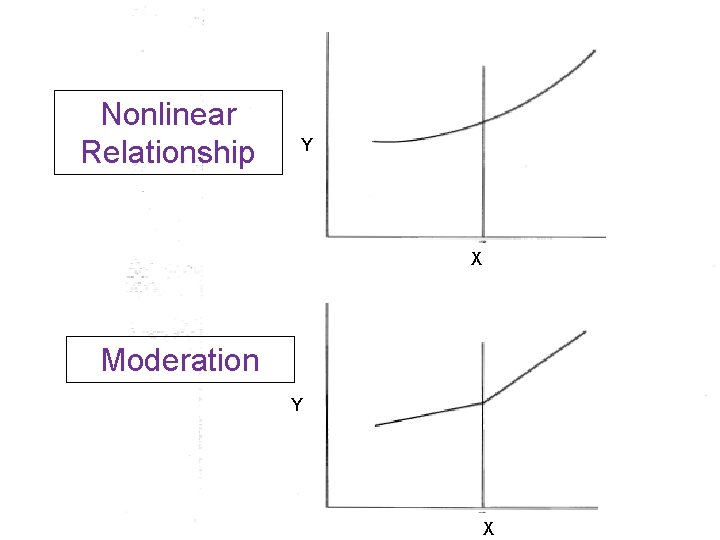
Nonlinearity or Moderation? • Consider a dichotomous moderator in which not much overlap with X (X and M highly correlated). • Can be difficult to disentangle moderation and nonlinearity effects of X.
Nonlinear Relationship Y X Moderation Y X
Homogeneity of Variance • Variance in Moderation Analysis –X –Y (actually the errors in Y)
Different Variance in X for Levels of M • Not a problem if regression coefficients are computed. • Would be a problem if the correlation between X and Y were computed. –Correlations tend to be stronger when more variance.
Equal Error Variance • A key assumption of moderated regression. • Visual examination – Plot residuals against the predicted values and against X and Y • Rarely tested – Categorical moderator • Bartlett’s test – Continuous moderator • not so clear how to test
Violation of Equal Error Variance Assumption: Categorical Moderator • The category with the smaller variance will have too weak a slope and the category with the larger variance will too strong a slope. • Separately compute slopes for each of the groups, possibly using a multiple groups structural equation model.
Violation of Equal Error Variance Assumption: Continuous Moderator • No statistical solution that I am aware of. • Try to transform X or M to create homogeneous variances.
Variance Differences as a Form of Moderation • Sometimes what a moderator does is not so much affect the X to Y relationship but rather alters the variances of X and Y. • A moderator may reduce or increase the variance in X. – Stress Mood varies by work versus home; perhaps effects the same, but much more variance in stress at work than home.
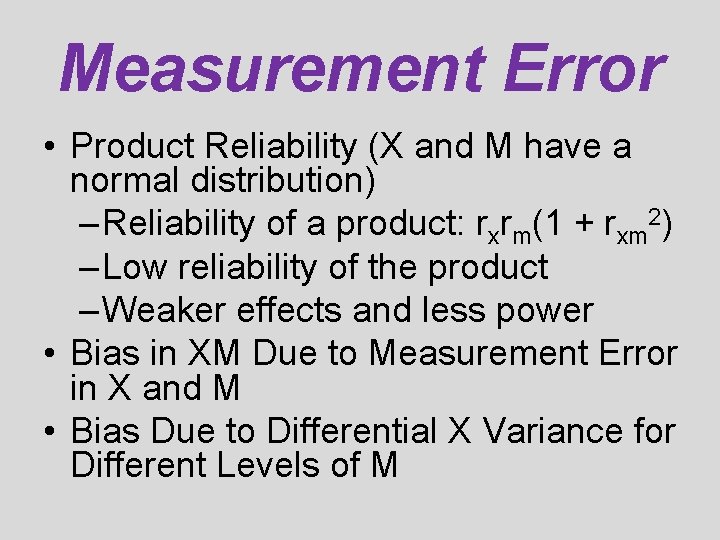
Measurement Error • Product Reliability (X and M have a normal distribution) – Reliability of a product: rxrm(1 + rxm 2) – Low reliability of the product – Weaker effects and less power • Bias in XM Due to Measurement Error in X and M • Bias Due to Differential X Variance for Different Levels of M
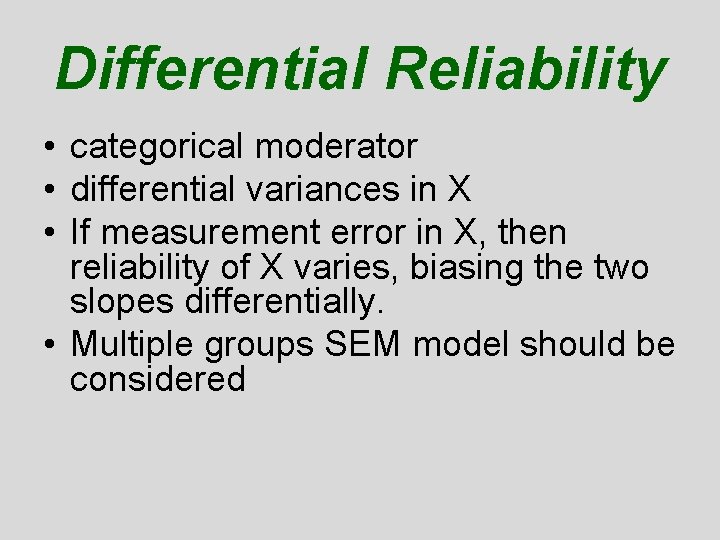
Differential Reliability • categorical moderator • differential variances in X • If measurement error in X, then reliability of X varies, biasing the two slopes differentially. • Multiple groups SEM model should be considered
Additional Webinars • Effect Size and Power • Mod. Text 26