Method 1 Molar Enthalpies of Reaction r Hm


 beside the")


- Slides: 15
Method 1: Molar Enthalpies of Reaction, Δr. Hm When reactants and products are in their standard state, they are at a pressure of 100 k. Pa, an aqueous concentration of 1. 0 mol/L & liquids and solids are in their pure state. To communicate a molar enthalpy, both the substance & the reaction must be specified.
Formation Reaction Combustion Reaction Note that the above reactions are balanced for one mole of the compound.
Formation Reaction Δf Hm° = – 239. 2 k. J/mol CH 3 OH When 1 mol of methanol is formed from its elements when they are in their standard states at SATP, 239. 2 k. J of energy is released. Combustion Reaction Δc Hm° = – 725. 9 k. J/mol CH 3 OH The complete combustion of 1 mol of methanol releases 725. 9 k. J of energy. Note that the above reactions are balanced for one mole of the compound.
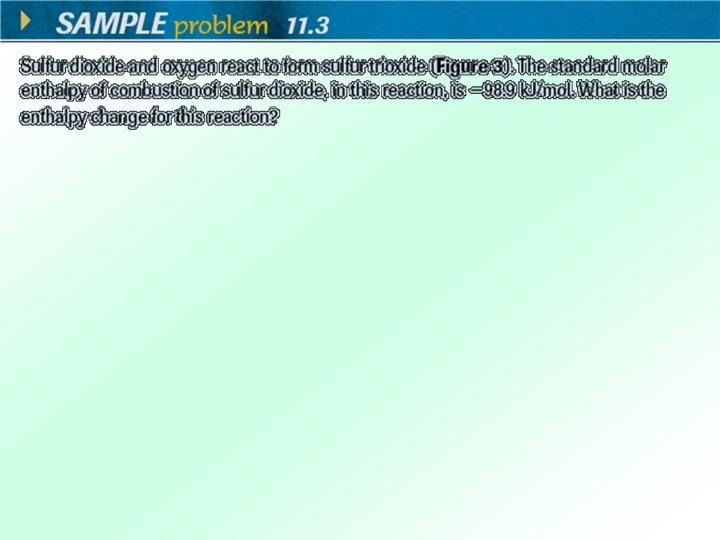
Method 2: Enthalpy Changes, Δr. H Write an enthalpy change (Δr H) beside the chemical equation. CO(g) + 2 H 2(g) → CH 3 OH(l) Δr H = – 725. 9 k. J The enthalpy change is not a molar value, so does not require the “m” subscript and is not in k. J/mol. Δc H° = – 98. 9 k. J Δc H° = – 197. 8 k. J When 2 moles of sulfur dioxide are burned, twice as much heat energy is released as when 1 mole of sulfur dioxide is burned.
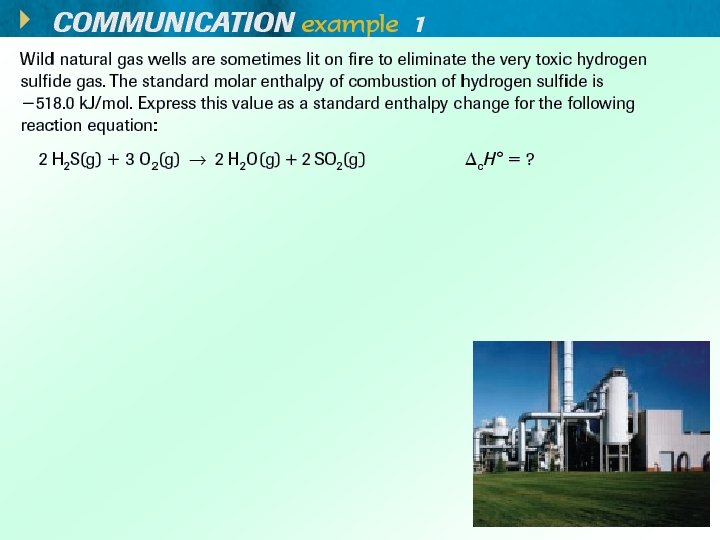
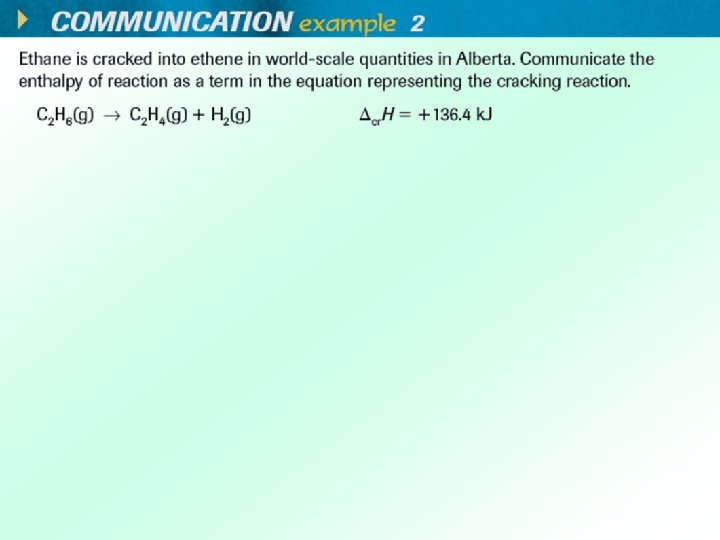
Method 3: Energy Terms in Balanced Equations For endothermic reactions, the energy is listed along with the reactants + energy → products For exothermic reactions, the energy is listed along with the products. reactants → products + energy
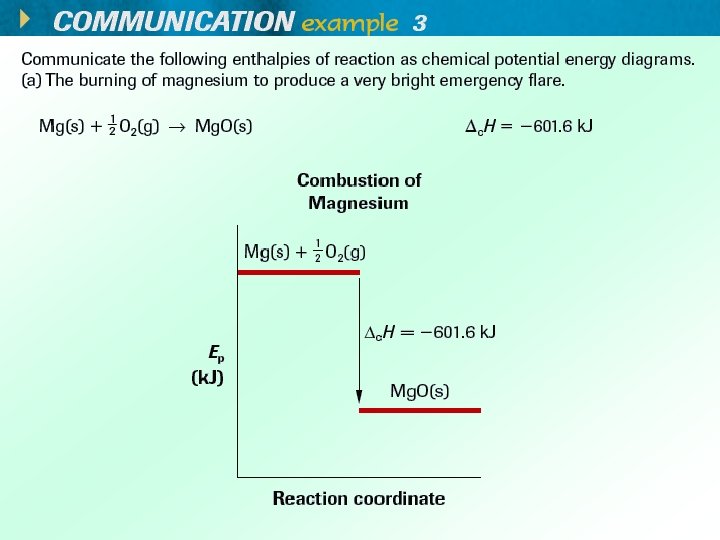
Method 4: Chemical Potential Energy Diagrams During an exothermic reaction, the enthalpy of the system decreases. Heat flows out of the system and into the surroundings & we observe a temperature increase.
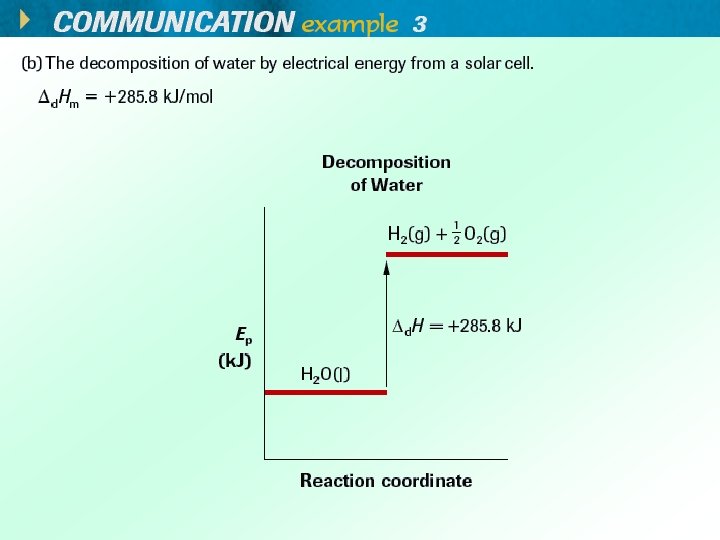
Method 4: Chemical Potential Energy Diagrams During an endothermic reaction, the enthalpy of the system increases. Heat flows into the system from the surroundings & we observe a temperature decrease.
Summary
ü Read pgs. 495 – 500 ü Section 11. 3 Questions #’s 1, 3, 4, 5 (p. 501)