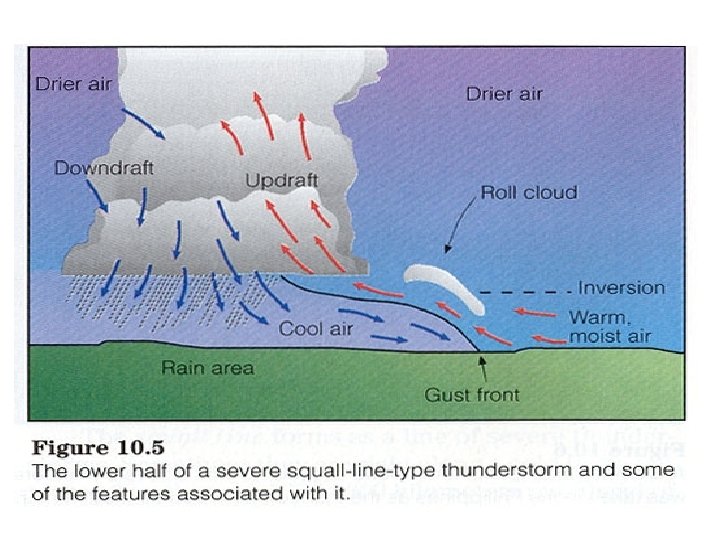
Mesoscale Meteorology Mesoscale1 Mesoscale Meteorology and Forecasting P
 授課老師: 游政谷 Mesoscale(1)")


: Macro > 2000 km (大尺度) Meso 200 -2000 km (中尺度) Meso 20")


 revealed by an enhanced infrared satellite Colorado Oklahoma Texas ~1000")


 Vertical section")


- Slides: 26
中尺度氣象學 (Mesoscale Meteorology) 授課老師: 游政谷 Mesoscale(1)
參考書名: • Mesoscale Meteorology and Forecasting. P. S. Ray, 1986. • Radar in Meteorology. D. Atlas and L. J. Battan, 1990. • A Short Course in Cloud Physics, Third Edition. R. R. Rogers and M. K. Yau, 1989. • Storm and Cloud Dynamics. W. R. Cotton and R. A. Anthes, 1989. • Cloud Dynamics. R. A. Houze, Jr, 1993.
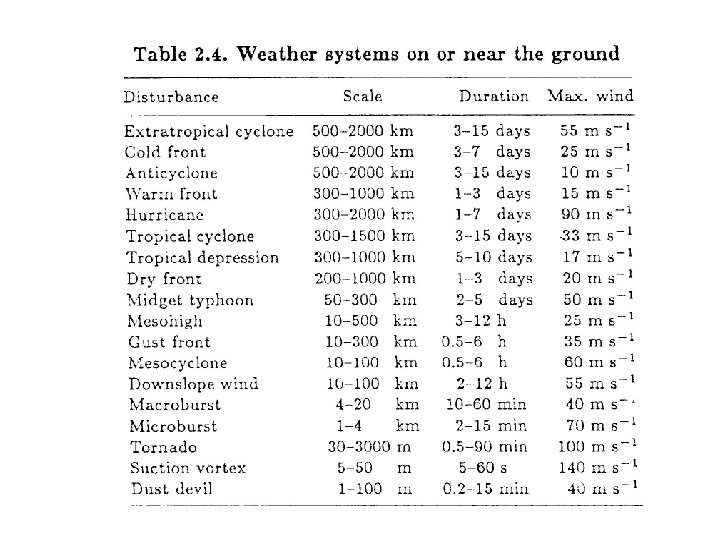
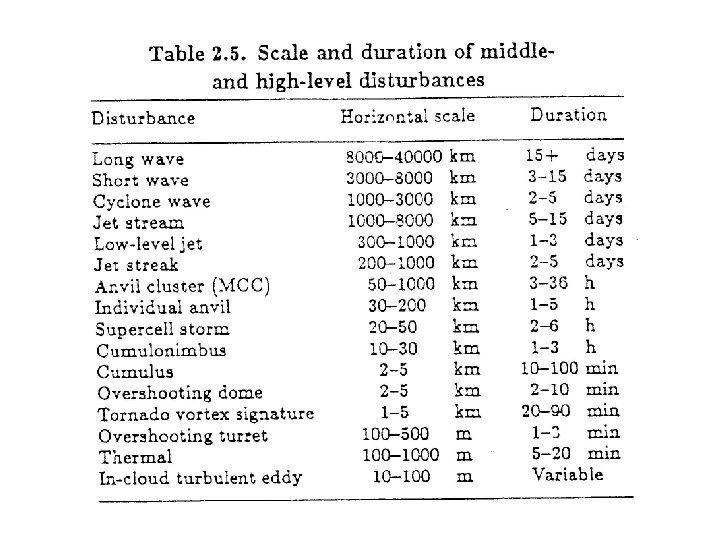
“Mesoscale” defined in Glossary of Meteorology ─Pertaining to atmospheric phenomena having horizontal scales ranging from a few to several hundred kilometers, including thunderstorms, squall lines, fronts, precipitation bands in tropical and extratropical cyclones, and topographically generated weather systems such as mountain waves and sea and land breezes.
Orlanski (1975): Macro > 2000 km (大尺度) Meso 200 -2000 km (中尺度) Meso 20 -200 km (中尺度) Meso 2 -20 km (中尺度) Micro < 2 km (小尺度)
Q: Extratropical cyclones and anticyclones R: Troughs and ridges in the baroclinic westerlies Cannot be resolved by routine synoptic observations ~12 h Only Q and R fit well in the quasi-geostrophic regime
The distribution of 500 -mb geopotential height at 00 UTC 20 Nov. 1964 Long and short waves
Weather analysis map showing the horizontal scales of synoptic cold and warm fronts, anticyclone and tropical depression. ~1000 km
Satellite image showing different sizes for Hurricane Floyd and Andrew Atlantic Ocean ~600 km ~200 km
Mesoscale Convective Complex (MCC) revealed by an enhanced infrared satellite Colorado Oklahoma Texas ~1000 km Gulf of Mexico
A multicell storm Anvil cloud Pre-mature thunderstorm Mature thunderstorm Cumulus rain
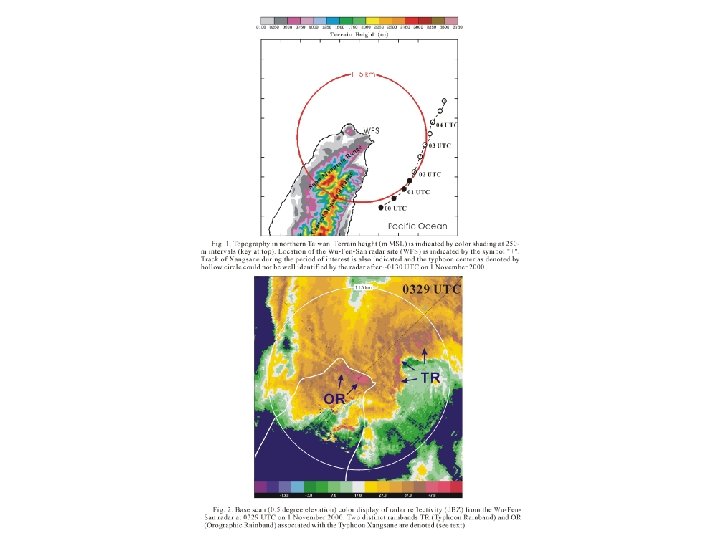
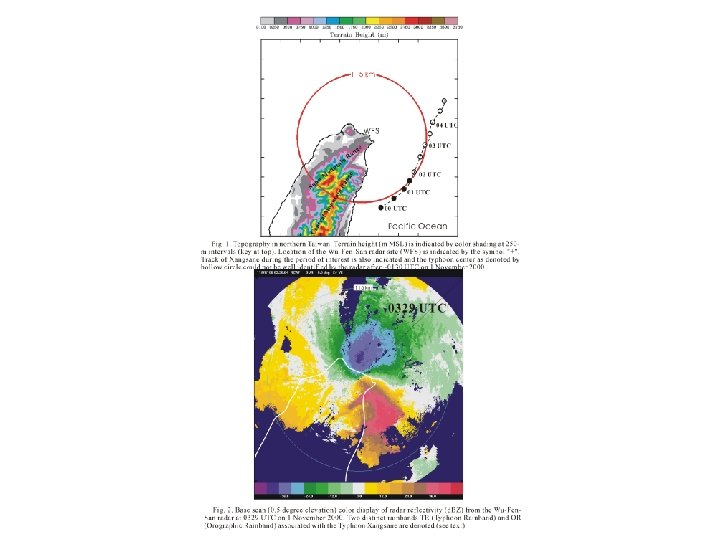
50 km Convective lines along the southeastern coast of Taiwan
A vertical section and a plan view of a mesofront (Fujita, 1955) Vertical section Plan view L H 氣流由高壓往低壓吹 非地轉風分量顯著
Cloud base Microburst associated with a small-scale vortex touching the ground
Tornado photographed near Tracy, Minnesota
Tornado path The powerful tornado touched down in southern Maryland ripped through the town of La Plata, destroying most of the historic downtown. The twister--the strongest ever recorded to hit the state and perhaps the strongest ever recorded in the eastern U. S. -flattened everything in its path along a 24 -mile (39 km) swath running west to east through the state. The tornado's path can be seen clearly in this panchromatic image acquired on May 1 by the Advanced Land Imager (ALI), flying aboard NASA's EO-1 satellite.