Measuring Health System Performance OECDs Health Care Quality


 Project. (shaded area represents the current")
")


 71")
 200")
 research can help • Improving the underlying national datainfrastructure (registries, administrative databases,")
- Slides: 13
Measuring Health System Performance OECD’s Health Care Quality Indicator project Niek Klazinga, Trnava, Thursday 20 2011
. • Why measuring health system outcomes is important; from life expectancy to wellbeing • Combining public health research with Health Services research • Some observations on the Slovak Republic in OECD data on quality of care • How research can help
From PH to HSR • Infectious diseases • Cardio-vascular Diseases • Cancer • Functioning acute care • Functioning primary care • Functioning cancer governance
Conceptual Framework OECD Health Care Quality Indicator (HCQI) Project. (shaded area represents the current focus of the HCQI Project) Source: Arah OA, et al. A conceptual framework for the OECD Health Care Quality Indicators Project. International Journal Quality Health Care. 2006; Sep 18; Suppl. 1: 5 -13. 5
Observations on Slovakia • • • Life expectancy at birth 74. 3 (79. 1) Life expectancy at 65 17. 1 (20. 2) Adults in good health 34. 4%(69. 1) Adult smoking 25 (23. 6) Alcohol use 8. 9(9. 7) Obesitas 16. 7 (15. 4)
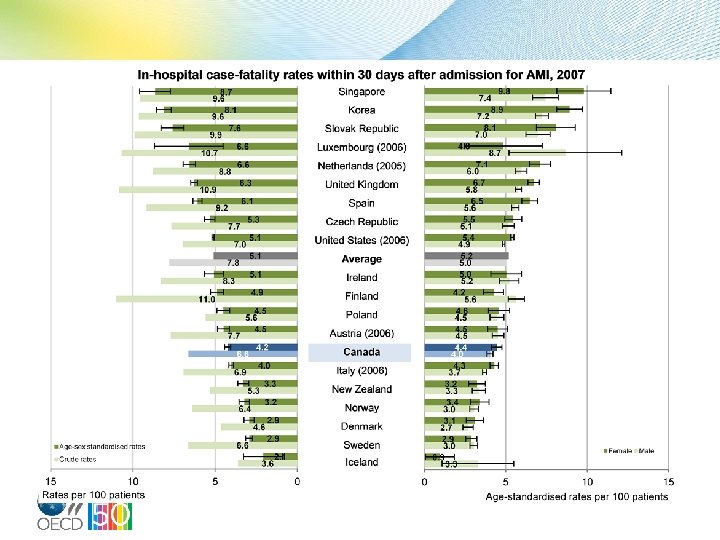
30 day case fatality rates for AMI are improving
Breast Cancer survival is improving
Mammography screening, percentage of women aged 50 - 69 screened, 2000 to 2009 (or nearest year) 2009 84. 4 82. 1 81. 1 76. 7 74. 1 79. 2 74. 0 75. 3 73. 7 73. 1 76. 3 72. 5 72. 7 71. 8 69. 5 66. 9 63. 0 62. 2 59. 9 61. 0 53. 8 61. 0 60. 0 59. 0 50. 0 54. 9 55. 9 53. 8 53. 6 52. 0 51. 4 49. 1 26. 7 48. 5 47. 2 31. 8 22. 523. 8 16. 6 16. 0 6. 9 12. 4 Finland ¹ Netherlands ¹ United States ² France ² Norway ¹ United Kingdom ¹ Denmark ¹ Ireland ¹ Canada ² Spain ² Israel ¹ New Zealand ¹ OECD (15) Luxembourg ¹ Iceland ¹ Italy ¹ Belgium ¹ Australia ¹ Greece ² Germany ² Estonia ¹ Korea ¹ Hungary ¹ Czech Republic ¹ Slovenia ² Chile ¹ Japan ² Mexico ¹ Slovak Republic ¹ Turkey ¹ 87. 4 80. 5 86. 9 0 1. Programme. 2. Survey. Source: OECD Health Data 2011. 2000 25 50 75 Women screened (%) 100
COPD hospital admission rates, population aged 15 and over, 2009 (or nearest year) 71 79 91 111 114 126 135 137 139 146 149 154 163 183 198 201 206 213 217 222 228 229 230 234 243 248 277 310 312 319 364 400 300 200 100 Rates per 100 000 population 0 Portugal France Switzerland Mexico Slovenia Italy Malta Sweden Spain Finland Czech Republic Netherlands Latvia Singapore Canada OECD Germany Slovak Republic United Kingdom Poland Korea Belgium Iceland United States Israel Norway Hungary Denmark Austria Australia New Zealand Ireland 0 48 Female Male 123 71 123 106 123 65 185 84 187 47 261 143 137 43 276 84 241 105 209 136 189 99 248 74 339 167 215 164 251 159 259 135 303 203233 136 330 159 318 173 308 241 226 229 236 333 157 207 266 202 310 284 275 238 397 280 370 305 354 324 437 400 600 200 Rates per 100 000 population 45 107 Note: Rates are age-sex standardised to 2005 OECD population. 95% confidence intervals are represented by H. Source: OECD Health Data 2011.
Asthma hospital admission rates, population aged 15 and over, 2009 (or nearest year) 200 166. 8 150 15. 1 15. 7 19. 0 19. 2 19. 3 20. 8 27. 5 30. 9 33. 3 35. 0 36. 5 37. 0 38. 1 43. 4 43. 5 43. 9 47. 6 48. 4 51. 8 52. 8 66. 6 68. 4 68. 9 73. 7 75. 9 78. 9 80. 7 86. 4 101. 5 120. 6 120. 7 100 50 Rates per 100 000 population 0 Portugal Canada Mexico Italy Sweden Germany Netherlands Switzerland Iceland Hungary Denmark Czech Republic Slovenia France Ireland Spain Norway Belgium OECD Austria Australia Israel Poland United Kingdom Finland Malta New Zealand Singapore Korea United States Latvia Slovak Republic 10 20 21 9 11 24 26 15 38 17 38 23 42 23 43 26 48 24 47 26 43 33 54 32 58 28 61 23 64 27 60 35 66 36 59 46 38 45 51 46 54 52 48 69 73 60 14 13 0 27 25 Female 93 89 85 100 95 102 112 100 110 93 164 130 113 116 120 180 Male Rates per 100 000 population Note: Rates are age-sex standardised to 2005 OECD population. 95% confidence intervals are represented by H. Source: OECD Health Data 2011. 216 240
How (outcome) research can help • Improving the underlying national datainfrastructure (registries, administrative databases, surveys) • Interpretation of the scores of Slovakia in international comparisons • Developing indicators • Analysing findings and differences • Evaluating policy interventions