Managing Ammonia in Agriculture USDA Research Efforts USDA


- Slides: 37
Managing Ammonia in Agriculture USDA Research Efforts
USDA Research Emissions from Livestock Production – Buildings – Manure Storage – Manure Application Emissions from Crop Production – Fertilizer Application – Crop release and uptake
USDA Research Partners Agricultural Research Service Cooperative States Research, Education, and Extension Service Land Grant Universities Research Partners
Emissions from Livestock Production Systems
Complexities of Agricultural Systems Shape Size Position on the landscape Meteorological conditions surrounding the site (daily and seasonal)
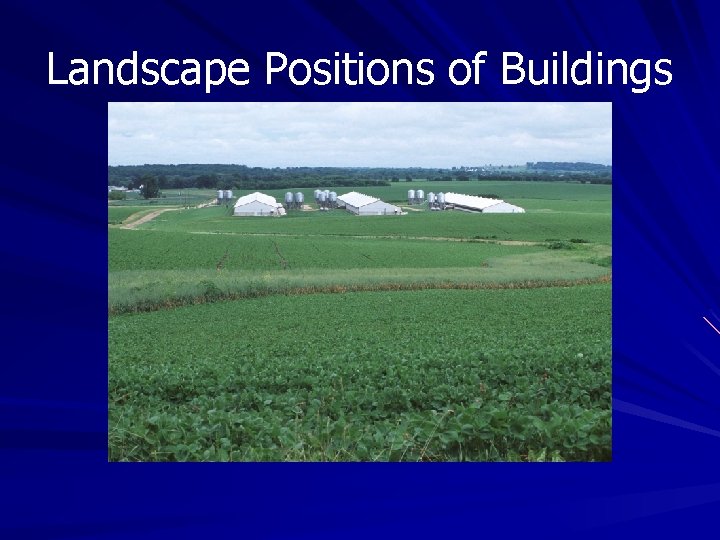
Landscape Positions of Buildings
Measurement Methods Nitrogen mass balance Flux chambers Micrometeorological methods
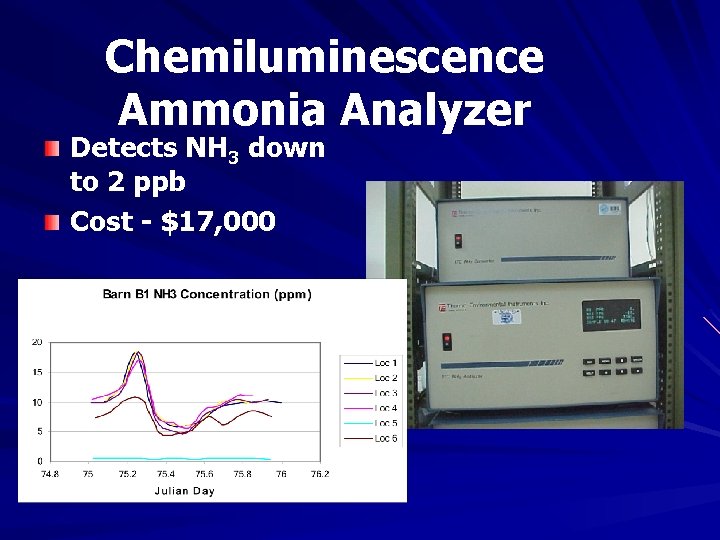
Chemiluminescence Ammonia Analyzer Detects NH 3 down to 2 ppb Cost - $17, 000
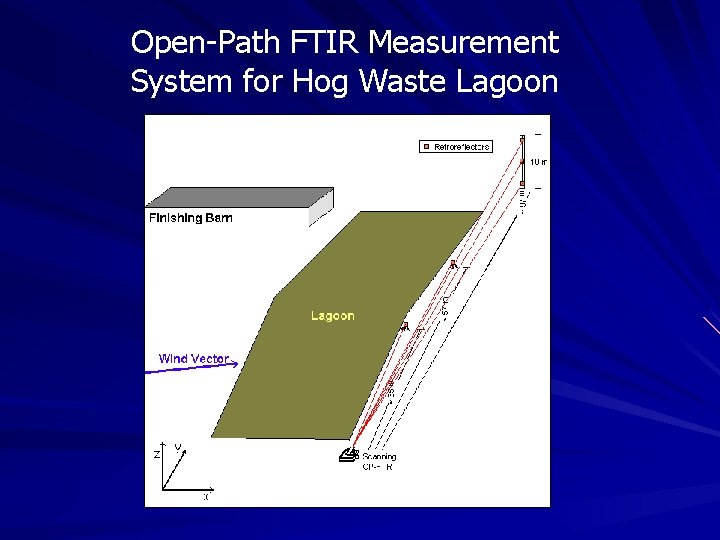
Open-Path FTIR Measurement System for Hog Waste Lagoon
Instrumentation Comparisons Joint project with USDA, EPA, and Battelle Comparison of ammonia instruments around swine confinement and beef feedlot Comparison of 8 different instruments over a 2 -month period
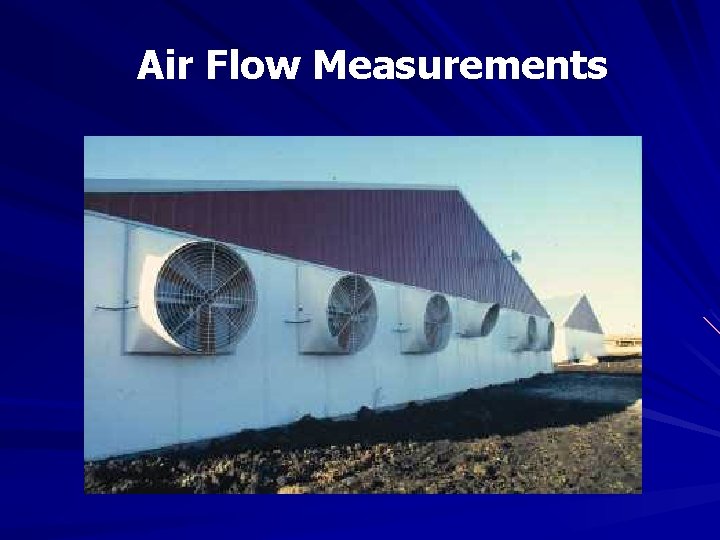
Air Flow Measurements
Emission Rates Need to define emission rates to determine the loading rate from a facility Need to define emission rates in order to evaluate the effectiveness of treatment or management techniques
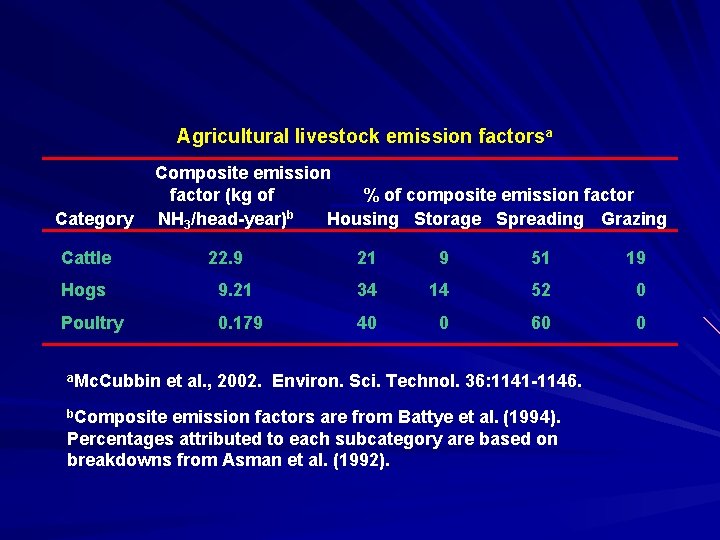
Agricultural livestock emission factorsa Category Composite emission factor (kg of % of composite emission factor NH 3/head-year)b Housing Storage Spreading Grazing Cattle 22. 9 21 9 51 19 Hogs 9. 21 34 14 52 0 Poultry 0. 179 40 0 60 0 a. Mc. Cubbin et al. , 2002. Environ. Sci. Technol. 36: 1141 -1146. b. Composite emission factors are from Battye et al. (1994). Percentages attributed to each subcategory are based on breakdowns from Asman et al. (1992).
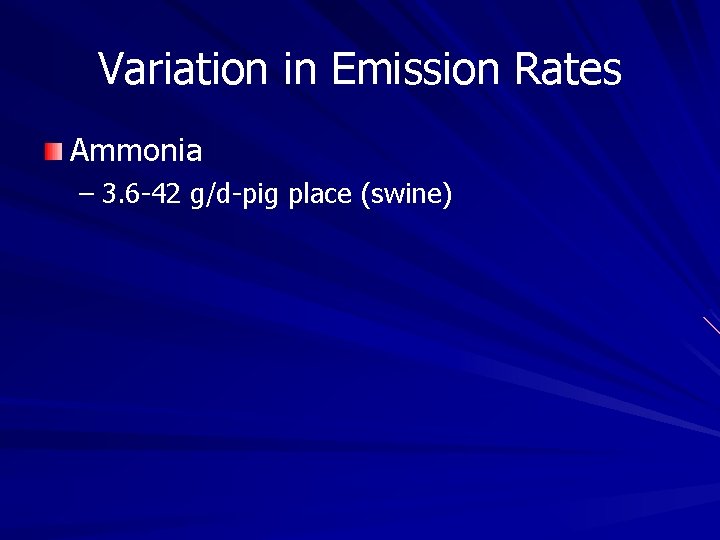
Variation in Emission Rates Ammonia – 3. 6 -42 g/d-pig place (swine)
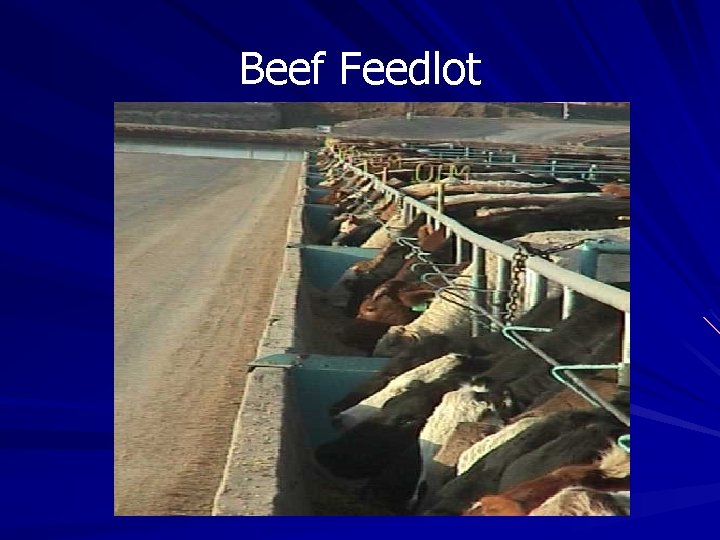
Beef Feedlot
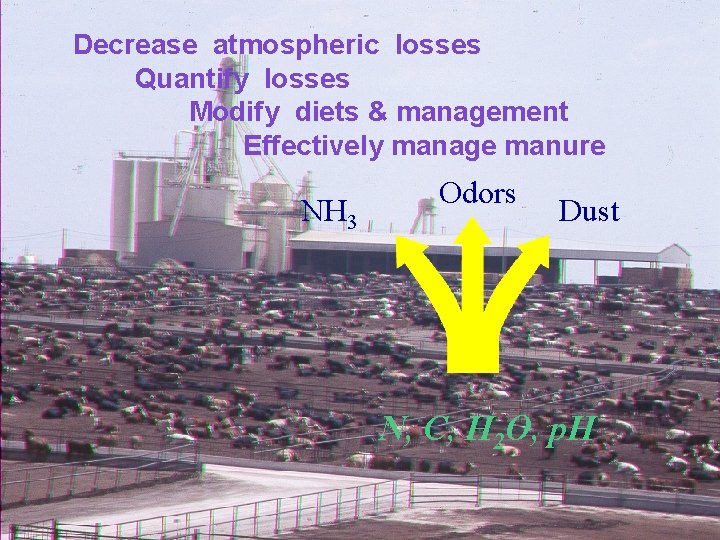
Decrease atmospheric losses Quantify losses Modify diets & management Effectively manage manure NH 3 Odors Dust N, C, H 2 O, p. H
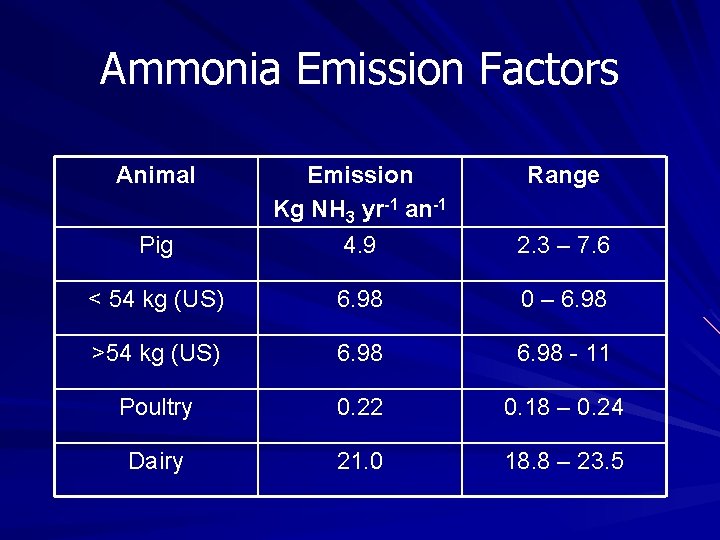
Ammonia Emission Factors Animal Pig Emission Kg NH 3 yr-1 an-1 4. 9 Range 2. 3 – 7. 6 < 54 kg (US) 6. 98 0 – 6. 98 >54 kg (US) 6. 98 - 11 Poultry 0. 22 0. 18 – 0. 24 Dairy 21. 0 18. 8 – 23. 5
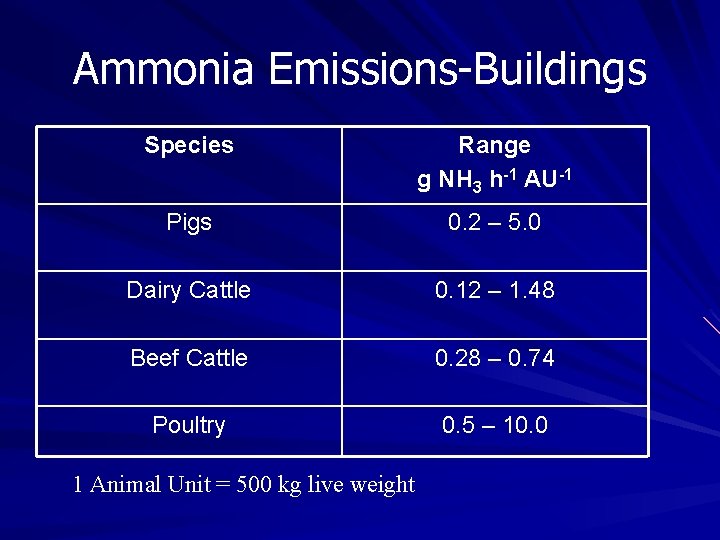
Ammonia Emissions-Buildings Species Range g NH 3 h-1 AU-1 Pigs 0. 2 – 5. 0 Dairy Cattle 0. 12 – 1. 48 Beef Cattle 0. 28 – 0. 74 Poultry 0. 5 – 10. 0 1 Animal Unit = 500 kg live weight
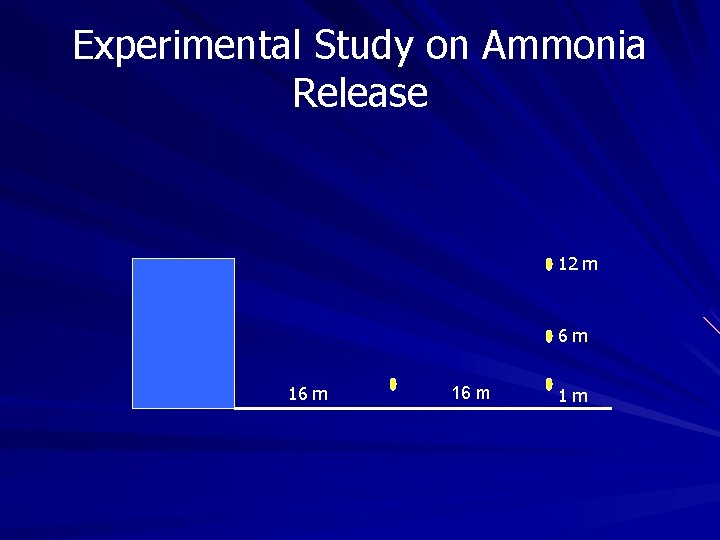
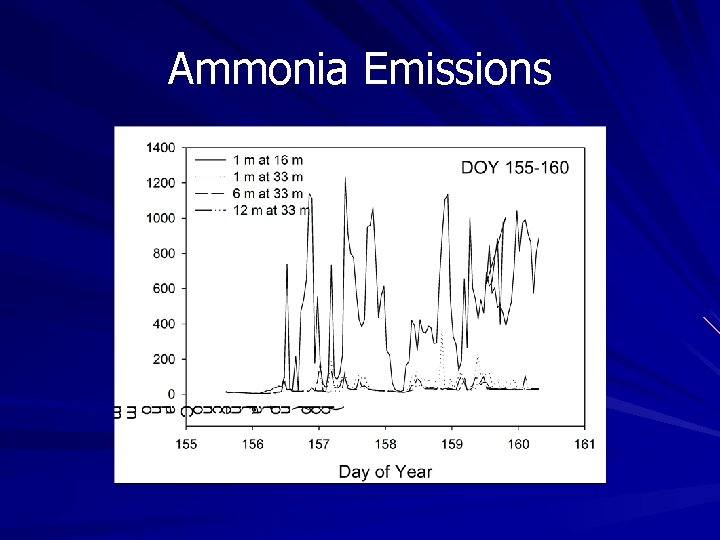
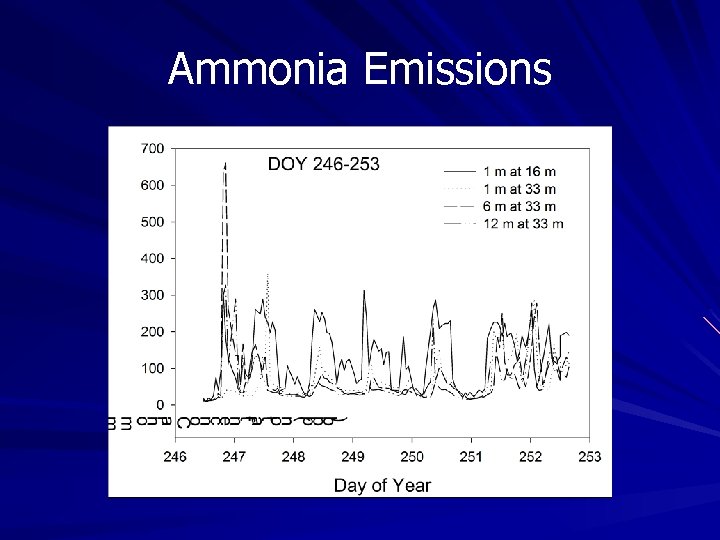
Experimental Study on Ammonia Release 12 m 6 m 16 m 1 m
Ammonia Emissions
Ammonia Emissions
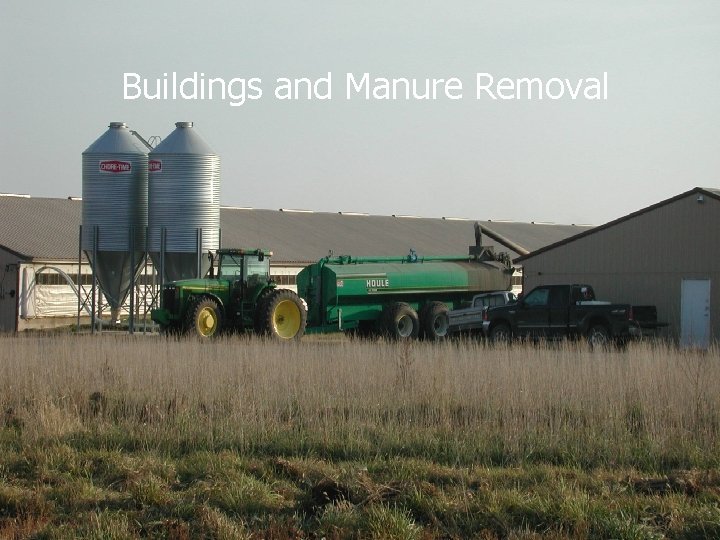
Buildings and Manure Removal
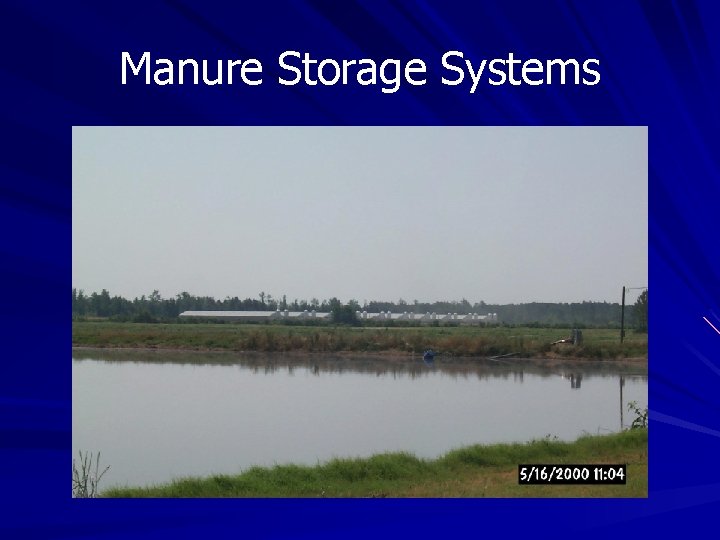
Manure Storage Systems
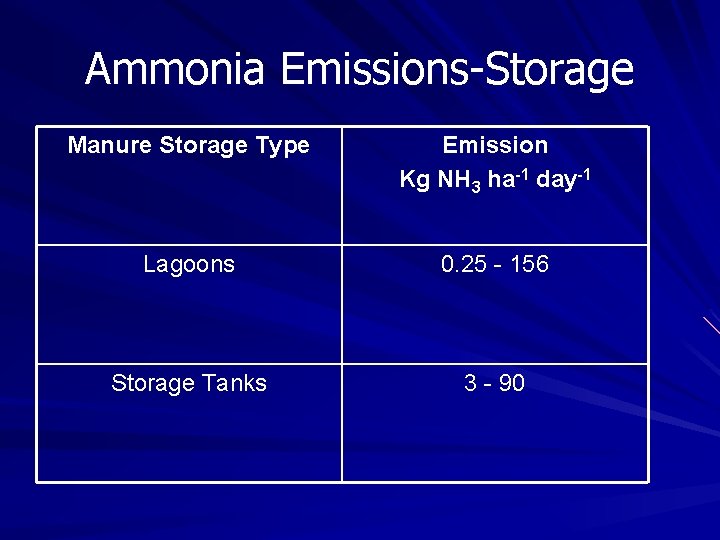
Ammonia Emissions-Storage Manure Storage Type Emission Kg NH 3 ha-1 day-1 Lagoons 0. 25 - 156 Storage Tanks 3 - 90
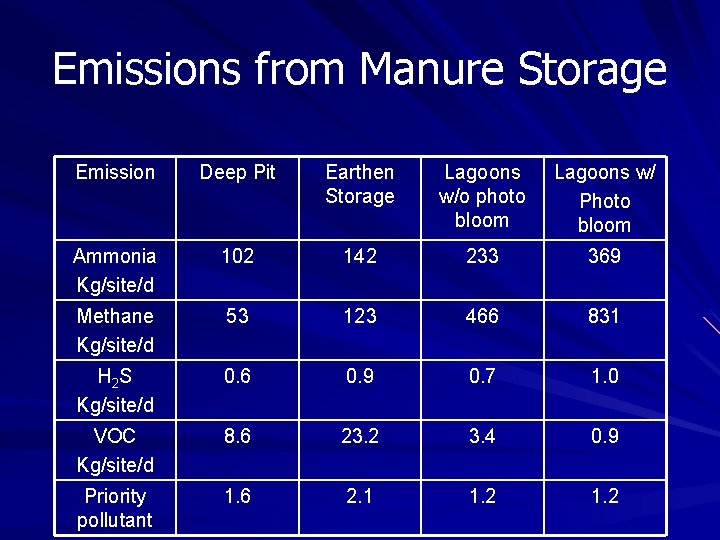
Emissions from Manure Storage Emission Deep Pit Earthen Storage Lagoons w/o photo bloom Lagoons w/ Photo bloom Ammonia Kg/site/d 102 142 233 369 Methane Kg/site/d 53 123 466 831 H 2 S Kg/site/d 0. 6 0. 9 0. 7 1. 0 VOC Kg/site/d 8. 6 23. 2 3. 4 0. 9 Priority pollutant 1. 6 2. 1 1. 2
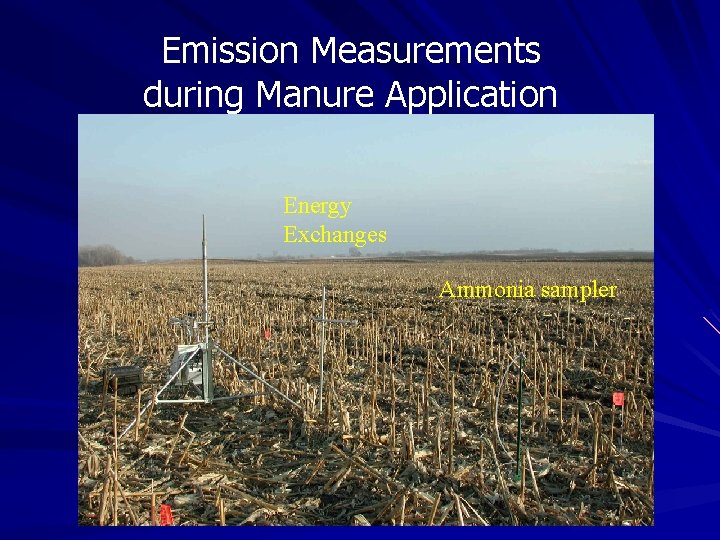
Emission Measurements during Manure Application Energy Exchanges Ammonia sampler
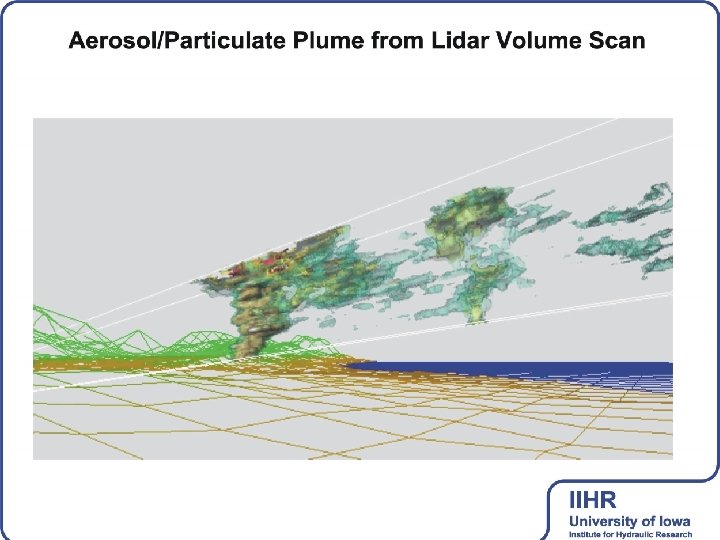
Evaluation of Dispersion Methods and Models
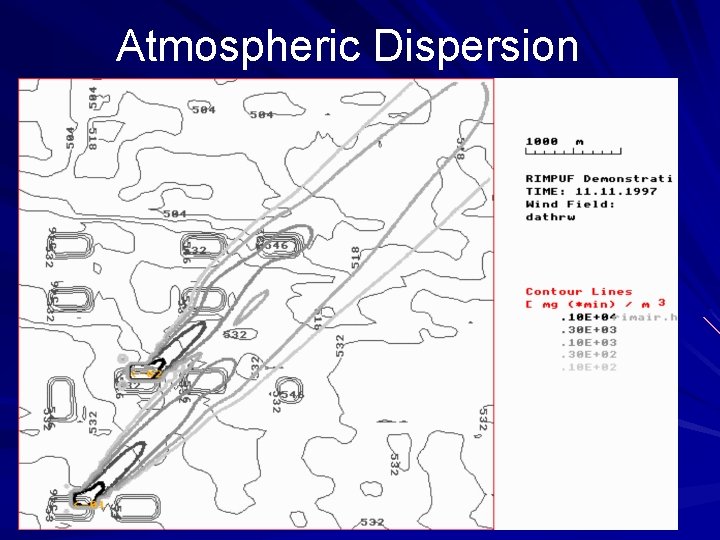
Atmospheric Dispersion
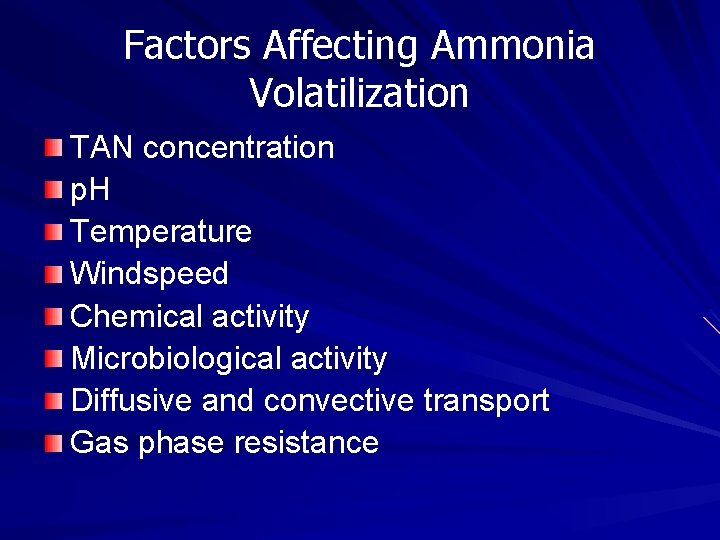
Factors Affecting Ammonia Volatilization TAN concentration p. H Temperature Windspeed Chemical activity Microbiological activity Diffusive and convective transport Gas phase resistance
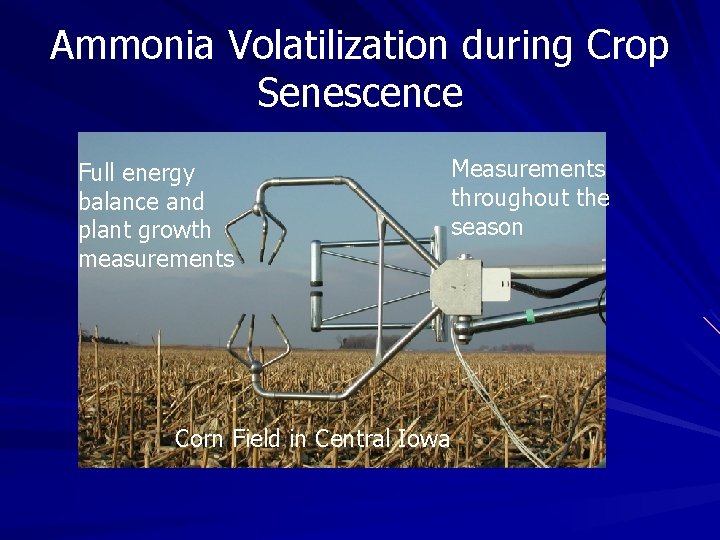
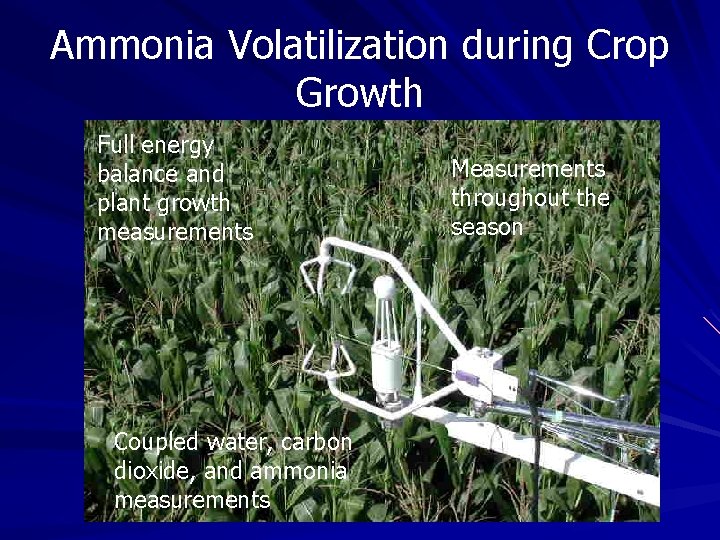
Ammonia Volatilization during Crop Senescence Full energy balance and plant growth measurements Corn Field in Central Iowa Measurements throughout the season
Ammonia Volatilization during Crop Growth Full energy balance and plant growth measurements Corn Field carbon in Central Iowa Coupled water, dioxide, and ammonia measurements Measurements throughout the season
Crop Emission and Uptake Research studies on ammonia volatilization and uptake from corn and wheat crops Ammonia deposition onto crops and rangeland in areas surrounding beef feedlots
Research Studies Encompass a number of species – Beef – Dairy – Poultry – Swine Encompass a range of production systems across a wide geographical area Encompass complete growing season
Challenges Quantify the emission rates through combined concentration and flux methods Compare emission rates across a range of facilities and agricultural practices Develop an understanding of why and how the emission rates vary within and among systems
Addressing these Challenges Requires good methods to measure the concentration of ammonia in the atmosphere Requires a good methodology to estimate the total emission from a facility that links flux through a given area and concentration
USDA Research Multi-faceted to cover a range of species and production systems Directed toward quantifying the emission rates of ammonia Focused on being able to evaluate treatment technologies that reduce ammonia emission