Luminescence and White Light Generation Analysis of Dy


![Glass Composition • strong photo-emission[5] Gd • Increase density and hardness of glass [3] Glass Composition • strong photo-emission[5] Gd • Increase density and hardness of glass [3]](https://slidetodoc.com/presentation_image_h/0d351415c3a8915200ea5375b917bda4/image-6.jpg)


- Slides: 24

Luminescence and White Light Generation Analysis of Dy 3+doped Silico-borate Glasses By t Lubna Shamshad (Ph. D Student) Supervisor Dr. Gul. Rooh Department of Physics Abdul Wali Khan University Mardan, Pakistan. 1

Contents Introduction Experiment Results Conclusion 2

Introduction 3

Glass An amorphous hard, brittle and transparent super cooled liquid of infinite viscosity. • Exploit the properties of liquid in solid phase. • Good electrical insulator. • Resistant to air, water, acid or chemical reagents except HF. • Ease of fabrication in different shape and size. • No definite crystal structure means glass have high compressive strength. • Allow higher concentration of doping. • Can absorb, transmit and reflect light. • Low cost 4

Why silico-borate glass ? ? ? • Inexpensive. • Reasonably hard. • Chemically stable. • Extremely workable. • Wide spread area of application. [1] Zhu, X. and Peyghambarian, N. (2010). High-Power ZBLAN Glass Fiber Lasers: Review and Prospect. Advances in Optoelectronics, 2010 (2010). [2] Sharma, Y. K. , Surana, S. S. L and Singh, R. K. (2008). Optical absorption and fluorescence spectra of Pr(III) doped borosilicate glasses and their Judd-Offlet analysis to study lasing characteristics. Indian Journal of pure and applied Physics, 2008 (46), 239 -244. 5
![Glass Composition strong photoemission5 Gd Increase density and hardness of glass 3 Glass Composition • strong photo-emission[5] Gd • Increase density and hardness of glass [3]](https://slidetodoc.com/presentation_image_h/0d351415c3a8915200ea5375b917bda4/image-6.jpg)
Glass Composition • strong photo-emission[5] Gd • Increase density and hardness of glass [3] • Enhance chemical durability [4] • Increase refractive index [4] Si B Li Dy Dy 3+ , Sm 3+ and Eu 3+ • Accelerates the fusion of glasss Conserve %W ratio 40 Li 2 O-15 Gd 2 O 3 -5 Si. O 2 - (40 -x)B 2 O 3: x Dy 2 O 3 Glass x=0. 0, 0. 05, 0. 1, 0. 5, 1. 0, 2. 0 mol% [3] M. Zinkevicha, S. Geupela, F. Aldingera, A. Duryginb, S. K. Saxenab, Mei Yangc, Zi-Kui Liu, Journal of Physics and Chemistry of Solids 67 (2006) 1901– 1907. [4] L. Aleksandrov, T. Komatsu, R. Iordanova, Y. Dimitriev, Journal of Physics and Chemistry of Solids 72 (2011) 263– 268. [5] Y. Ch. Li, Y. H. Chang, Y. F. Lin, Y. S. Chang, Y. J. Lin, Journal of Alloys and Compounds 439 (2007) 367– 375. 6

Experimental 7

LGSi. B : Dy 3+ glasses Glass preparation Melt Quenching Technique Characterization Decay Time IH Model Optical Absorption spectra Lasing potential J-O theory Excitation spectra Emission spectra CIE 1931 CCT 8

Synthesis Prepared by the meltquenching technique. Melted at 1200°C for 3 hrs Weight ~ 30 g Annealed at 500°C for 3 hrs Melted 9

1931 CIE Chromaticity (x, y) 16 10

Concept of Judd-Oflet analysis Ø Ligand arrangement → dramatically effect to the emission of Ln 3+ (Asymmetric ligands can enhance 4 f-4 f transition) Spectral study • Absorption spectra • Emission spectra Laser = “Light Amplification by Stimulated Emission of Radiation” Relation between Ln 3+ & ligand • J-O parameter (Ω 2) (Asymmetric & Covalency) Radiation • Stimulated emission cross section (σ) • Branching ratio (βR) High σ and βR value → High potential for using as laser medium 17

Process and equation of J-O analysis Absorption spectrum fexp L ea stsq u are βR fit tin g Ω 2, Ω 4, Ω 6 & fcal A Em iss ion sp ect rum σ 18

Results And Discussion 13

Optical absorption analysis Table 1: Measured and calculated oscillator strengths (f × 10 -6) of 1. 00 mol% Dy 3+ ions doped glass. Level 4 I (λ, nm) ( λ, cm-1) fcal fexp 451 22173 - - 15/2 6 F 3/2 751 13316 0. 3770 0. 2197 6 F 5/2 801 12500 1. 1671 6 F 7/2 898 11123 2. 3400 2. 3814 6 F 9/2 1086 9200 2. 7200 0. 0985 11/2 1264 7886 3. 5800 3. 5686 1676 5967 1. 1500 1. 2356 6 F 6 H 11/2 Fig. 1 Optical absorption spectra of LGSi. BDy glasses at different concentration of Dy 2 O 3 14

Judd–Ofelt Table 2 The Judd-Ofelt parameters ( λ× 10 -20 cm 2) of 1. 00 mol% Dy 3+ systems Glass 2 4& 6 Ω 2 Ω 4 Ω 6 Trend Ω 4/Ω 6 LGSi. BDy 10 5. 06 3. 51 3. 0723 Ω 2˃Ω 6˃Ω 4 1. 14 Lead borate 4. 90 0. 94 2. 07 Ω 2˃Ω 6˃Ω 4 Barium fluoroborate 2. 90 1. 09 0. 98 Ω 2˃Ω 4˃Ω 6 Tellurite glass 1. 46 2. 32 3. 6 Ω 2˃Ω 4˃Ω 6 Fluorosilicate glass 8. 14 2. 04 2. 26 Ω 2˃Ω 4˃Ω 6 ZBLAN 3. 12 0. 95 2. 30 Ω 2˃Ω 6˃Ω 4 asymmetry & covalency viscosity & rigidity 0. 45 1. 11 0. 64 0. 90 1. 00 Fluorosilicate> LGSi. BDy 10 > Lead borate > ZBLAN > Barium fluoroborate> Tellurite > LGSi. BDy 10 > Tellurite> Fluorosilicate > ZBLAN > Barium fluoroborate 15

Photoluminescence (PL) Fig. 2 Excitation spectra of LGSi. BDy glasses at different con centration of Dy 2 O 3 at λemi=575 nm 16

Emission spectra Fig. 3 Emission spectra of LGSi. BDy glasses at different concentration of Dy 2 O 3 Fig. 4 emission energy level diagram of LGSi. B: Dy 3+glasses. 17

Judd–Ofelt Table 4 Emission band positions (λp), radiative transition probability (A), stimulated emission cross-sections ( (λp), × 10 -22) and experiment and calculated branching ratios ( R) of 1. 00 mol% Dy 3+ ions doped glass. Level 6 F 9/2 6 H 15/2 6 H 13/2 6 H 6 H 9/2 11/2 +6 F 11/2 λ p [nm] A [s-1] (λp) [cm 2] Exp 482 575 662 752 278. 02 697 72. 78 79. 43 5. 394 21. 927 4. 400 5. 116 0. 4124 0. 5834 0. 0254 0. 0159 low threshold and high gain laser [9, 12] R Cal 0. 2726 0. 5723 0. 0489 0. 0190 High lasing power [11] R 0. 5 [7] K. Linganna, Ch. Srinivasa Rao, C. K. Jayasankar, Journal of Quantitative Spectroscopy & Radiative Transfer 118 (2013) 40– 48. [8] K. Linganna, C. K. Jayasankar, Spectrochimica Acta Part A: Molecular and Biomolecular Spectroscopy 97 (2012) 788– 797. [9] N. Vijaya, C. K. Jayasankar, Journal of Molecular Structure 1036 (2012) 42– 50. /. 18

Yellow to Blue (Y/B) ratio Sample 1. 0 mol% Concentration (mol%) Y/B LGSi. BDy 005 0. 05 1. 31 LGSi. BDy 01 0. 1 1. 34 LGSi. BDy 05 0. 5 1. 38 LGSi. BDy 10 1. 41 LGSi. BDy 20 2. 0 1. 38 Concentration quenching effect Fig. 5 variation in the Yellow to Blue ratio of LGSi. BDy glasses at λexc= 388 nm 19

Color analysis Sample Color Coordinates (x, y) CCT LGSi. BDy 005 LGSi. BDy 01 (0. 36, 0. 40) 4584 4509 LGSi. BDy 05 LGSi. BDy 10 LGSi. BDy 20 SLBi. BDy 10 Pb. FPDy 10 White light Fluorescent, warm white (0. 36, 0. 40) (0. 44, 0. 42) (0. 31, 0. 34) (0. 33, 0. 33) 4450 4413 4235 5455 (0. 44, 0. 40) 2940 Fig. 6 CIE 1931 chromaticity coordinates of LGSi. BDy glasses at λexc =388 nm. 20

Concentration dependent decay rate Fig. 7 The decay rate for the 4 F 9/2 level of Dy 3+ ion in LGSi. BDy glasses. The scattered points represents experimental data and the solid line is the IH model fit for S=6. 21

CONCLUSION 22

Conclusion • The optical and luminescence analysis and the application of J-O theory reflects that the present glasses are the good candidates for laser action to produce intense yellow emission at 575 nm and could be suitable for fiber laser materials to produce intense yellow fluorescence at 575 nm, pumped by the commercial blue-violet Ga. N or near-UV In. Ga. N LEDs and also to generate white luminescence under 385 nm excitation wavelength. • The CIE chromaticity coordinates and yellow-to-blue emission intensity ratios confirms the feasibility of white light generation. • The obtained CCT values shows that the studied glasses could be used for the generation of warm white light. 23

Thanks 24
 Outline spectra
 White light generation
 White light generation
 Light light light chapter 23
 Light light light chapter 22
 Light light light chapter 22
 Stahl
Stahl Lord you are good and your mercy
 Free verse poem examples for students
 Ellen g white henry nichols white
 Automated generation and analysis of attack graphs
 Put out the light and then
 Difference between light dependent and light independent
 Bouncing off of light
 White light measurement
 When white light enters a prism
 The splitting of white light
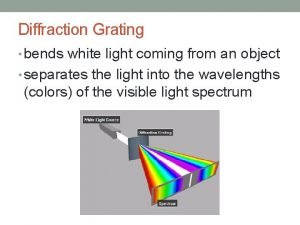
 Diffraction
 Storm in the garden class 2
 Light is composed of
 Unit 1 2 3
 Spectrum white light
 White light mixes
 Red yellow blue green orange purple
 Block light materials


