Life Expectancy and Retirement Age Facts and Policy

- Slides: 30
Life Expectancy and Retirement Age: Facts and Policy Considerations Daniel Gottlieb, Eytan Sheshinski, Ofir Pinto, Rachel Zaken, Refaela Cohen, Gabriela Heilbrun, Miriam Shmelzer
Acknowledgements • Avia Spivak – The Pensions, Insurance and Financial Literacy Research Center • Amit Rozen – Menora Mivtachim • Ari Paltiel, Naama Rotem, Irene Kornilenko - The Central Bureau of Statistics • Mark Rozenberg – National Insurance Institute of Israel 2
Literature review • Previous studies have shown a positive correlation between income and life expectancy. • In the United States Chetty et al. (2016) found that life expectancy of men in the top percentile in 2014 was 14. 6 years higher than in the bottom percentile, and that it increased by three years since 2001. • In Germany the gap for men between the top and bottom quintiles was found to be 6 years (Scholz and Gaudecker, 2007). • The Health situation is considered to be an important determinant of life expectancy. In a health environment characterized by privatization the health situation is correlated with income (Chernichovsky and others, 2003; Davidovitch and others, 2014) 3
Our study examined 1) the relationship between life expectancy, mortality and wage income in Israel, based on administrative data of full cohorts of the whole population (National Insurance Institute of Israel). 2) the realization rate of individual pension accumulation by wage income level 3) the realization rate of individual old age benefits and contributions by wage income level 4
Research Population • Male cohorts, born between 1930 and 1935, which reached retirement age between 1995 and 2000. • The data include men born in Israel or who immigrated to Israel prior to December 31 st 1989, or died after January 1 st 1995. • People who died in military events or due to terrorism are excluded from the data. Also excluded are people permanently employed by the Security forces (due to lack of wage data). • The total population: 89, 533 persons of the 6 male cohorts. They account for 60% of the total potential male population. 5
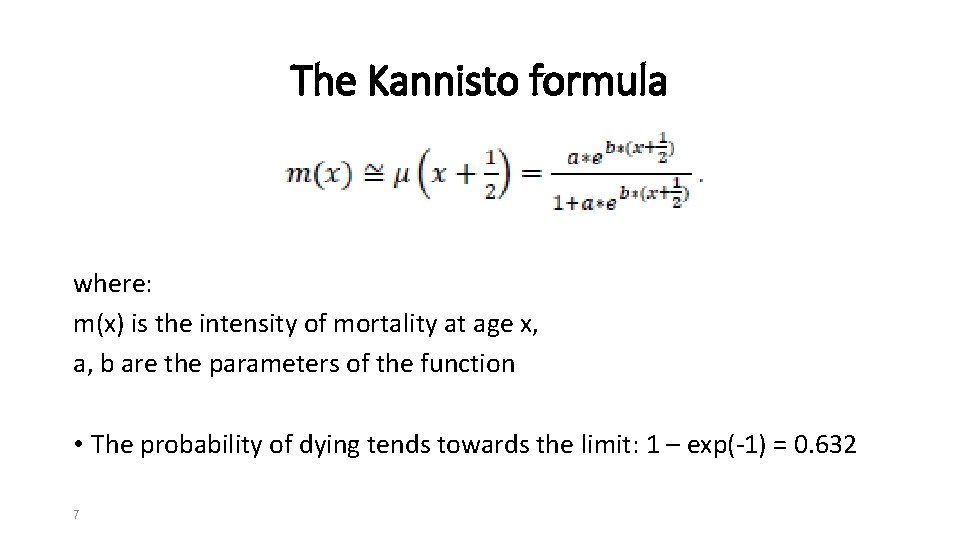
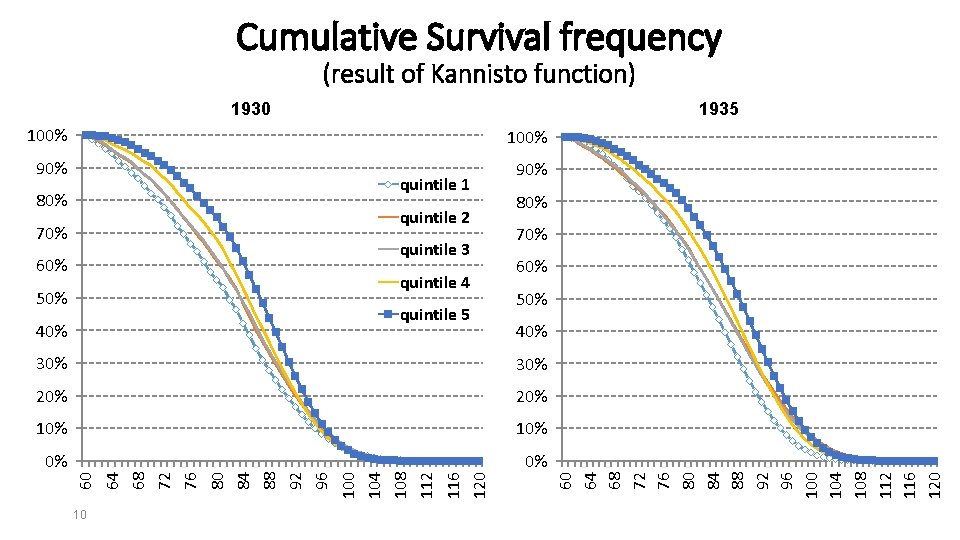
Methodology • Permanent income is estimated by the annual average gross wage over the last 8 years before retirement • The individual’s income is defined as half the labor income of the couple or total labor income of singles, multiplied by the equivalence scale of 1. 25 • Until December 2016 about 50% of the population had died. In order to forecast the survival function of each cohort (maximum age of 120), we used the logistic mortality function calculated by the demographer Vaino Kannisto 6
The Kannisto formula where: m(x) is the intensity of mortality at age x, a, b are the parameters of the function • The probability of dying tends towards the limit: 1 – exp(-1) = 0. 632 7
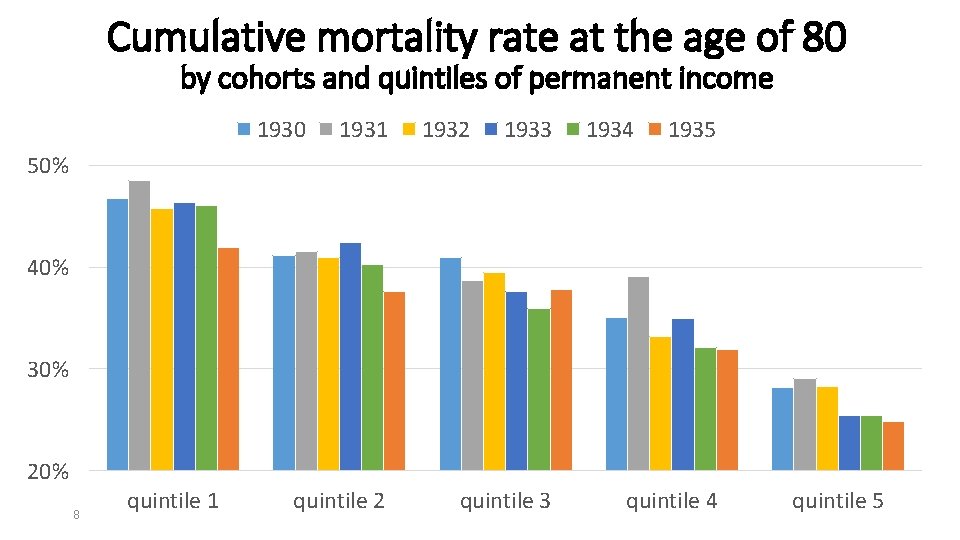
Cumulative mortality rate at the age of 80 by cohorts and quintiles of permanent income 1930 1931 1932 1933 1934 1935 50% 40% 30% 20% 8 quintile 1 quintile 2 quintile 3 quintile 4 quintile 5
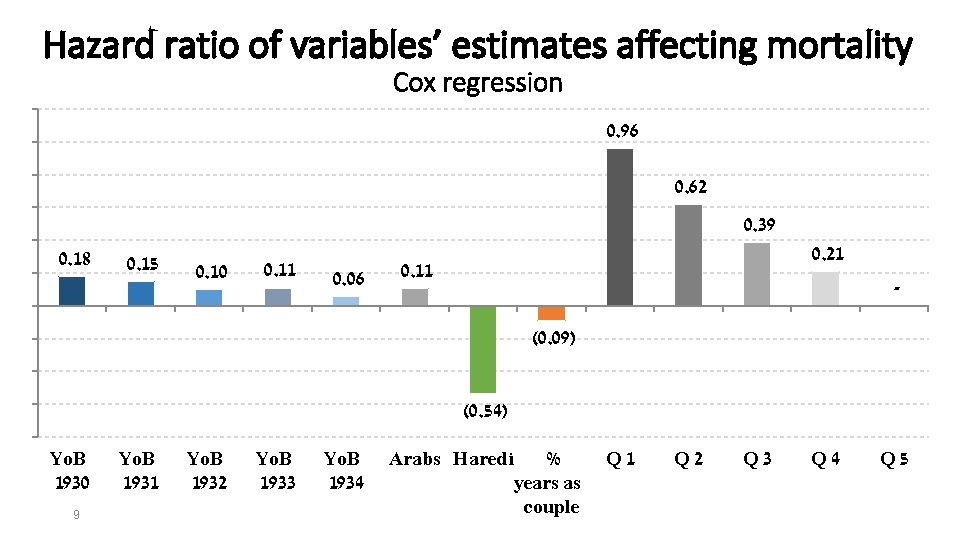
Hazard ratio of variables’ estimates affecting mortality Cox regression 0. 96 0. 62 0. 39 0. 18 0. 15 0. 10 0. 11 0. 06 0. 21 0. 11 (0. 09) (0. 54) Yo. B 1930 9 Yo. B 1931 Yo. B 1932 Yo. B 1933 Yo. B 1934 Arabs Haredi % years as couple Q 1 Q 2 Q 3 Q 4 Q 5
Cumulative Survival frequency (result of Kannisto function) 1930 1935 100% 90% 80% quintile 2 70% quintile 3 60% quintile 4 50% quintile 5 40% 80% 70% 60% 50% 40% 30% 20% 10% 0% 0% 60 64 68 72 76 80 84 88 92 96 100 104 108 112 116 120 30% 10 60 64 68 72 76 80 84 88 92 96 100 104 108 112 116 120 quintile 1
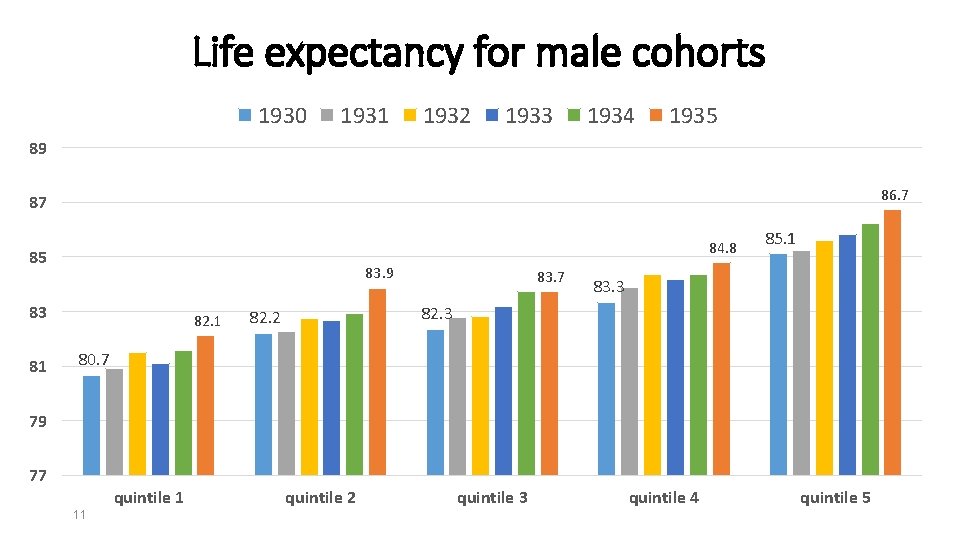
Life expectancy for male cohorts 1930 1931 1932 1933 1934 1935 89 86. 7 87 84. 8 85 83. 9 83 81 82. 1 83. 7 85. 1 83. 3 82. 2 80. 7 79 77 quintile 1 11 quintile 2 quintile 3 quintile 4 quintile 5
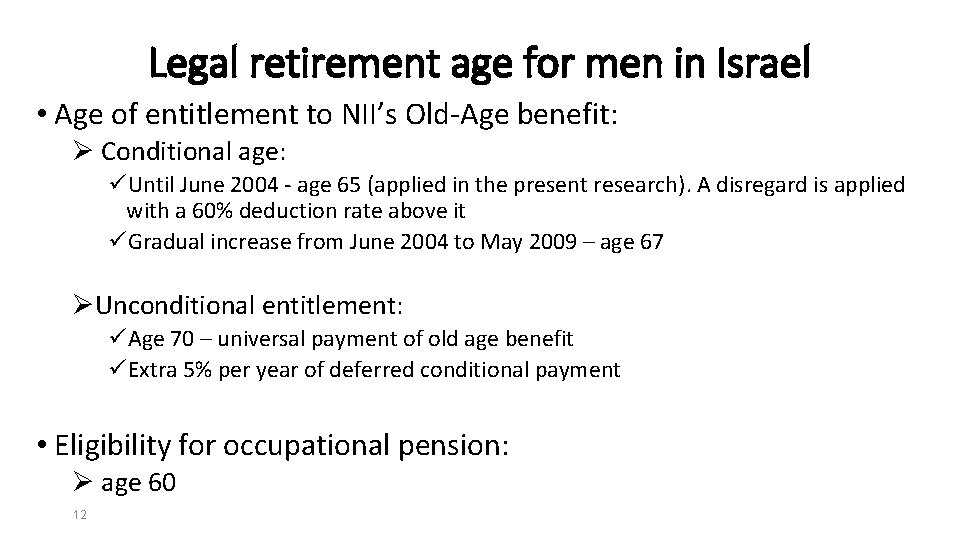
Legal retirement age for men in Israel • Age of entitlement to NII’s Old-Age benefit: Ø Conditional age: üUntil June 2004 - age 65 (applied in the present research). A disregard is applied with a 60% deduction rate above it üGradual increase from June 2004 to May 2009 – age 67 ØUnconditional entitlement: üAge 70 – universal payment of old age benefit üExtra 5% per year of deferred conditional payment • Eligibility for occupational pension: Ø age 60 12
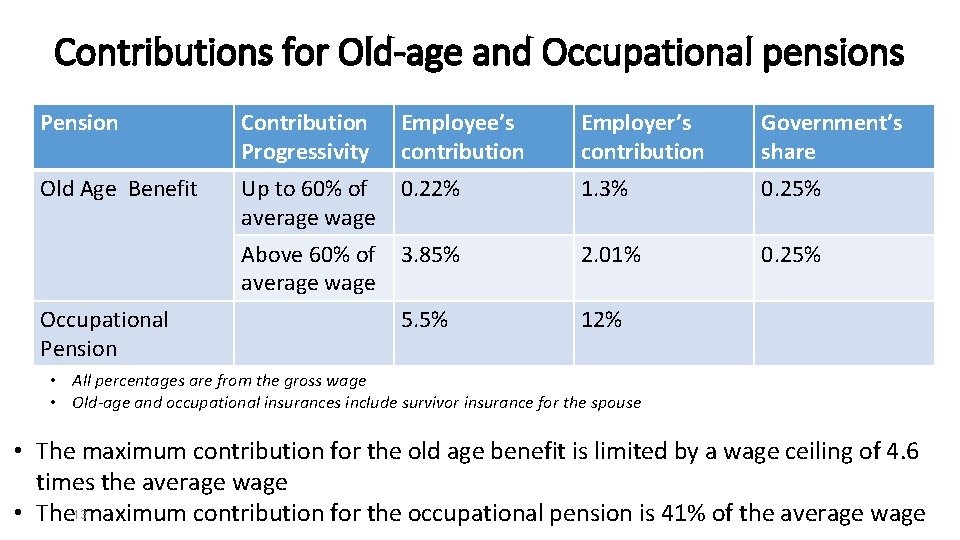
Contributions for Old-age and Occupational pensions Pension Contribution Progressivity Employee’s contribution Employer’s contribution Government’s share Old Age Benefit Up to 60% of average wage 0. 22% 1. 3% 0. 25% Above 60% of average wage 3. 85% 2. 01% 0. 25% 5. 5% 12% Occupational Pension • All percentages are from the gross wage • Old-age and occupational insurances include survivor insurance for the spouse • The maximum contribution for the old age benefit is limited by a wage ceiling of 4. 6 times the average wage • The 13 maximum contribution for the occupational pension is 41% of the average wage
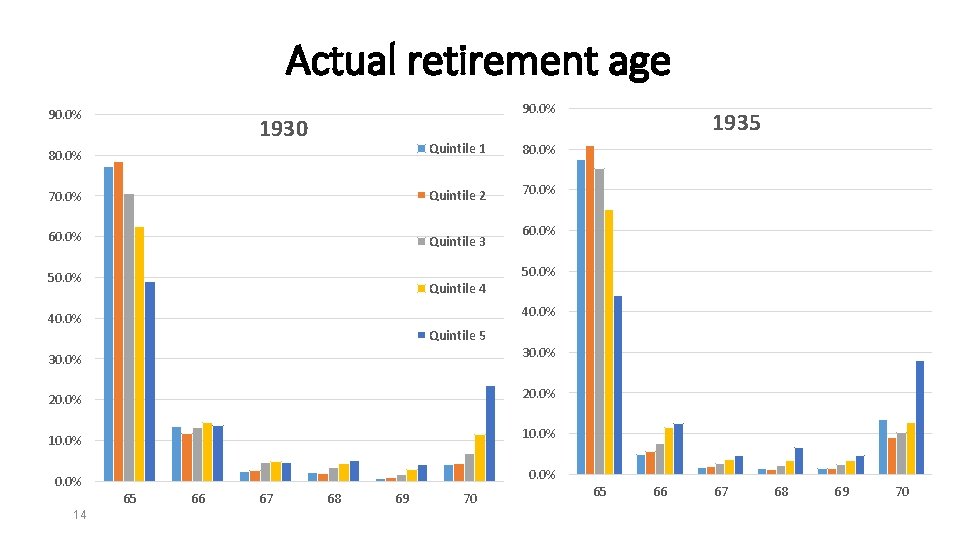
Actual retirement age 90. 0% 1930 80. 0% Quintile 1 80. 0% 70. 0% Quintile 2 70. 0% 60. 0% Quintile 3 60. 0% 50. 0% Quintile 4 40. 0% Quintile 5 30. 0% 20. 0% 10. 0% 65 14 1935 66 67 68 69 70 65 66 67 68 69 70
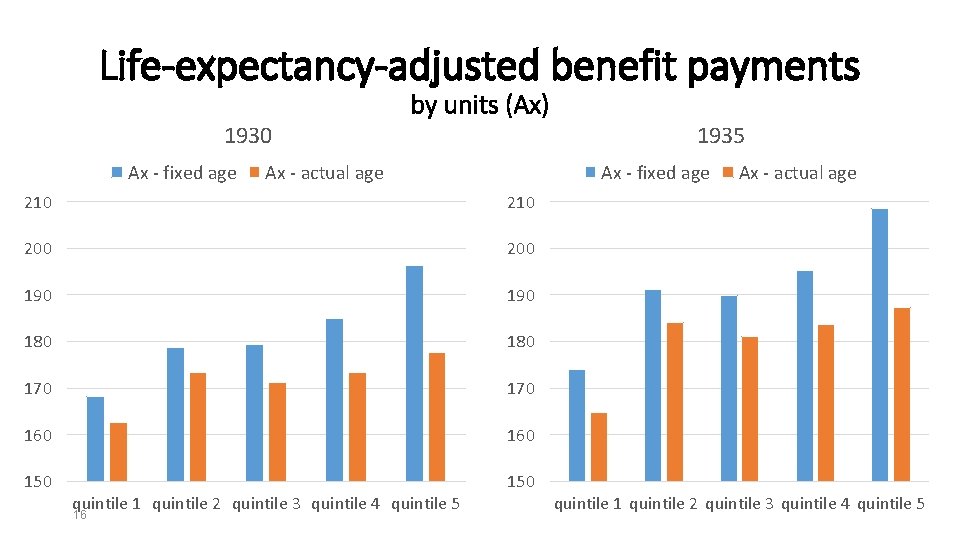
Actuarial annuity • Ax - indicates the present value of the life-expectancy adjusted pension benefit per 1 unit payable at the end of life, i. e. Ax equals PV(expected number of months between the retirement age and the date of death, interest rate, one unit payable) • Typical interest rate: 3. 74% (after management fees) 15
Life-expectancy-adjusted benefit payments 1930 Ax - fixed age by units (Ax) Ax - actual age Ax - fixed age 210 200 190 180 170 160 150 quintile 1 quintile 2 quintile 3 quintile 4 quintile 5 16 1935 Ax - actual age quintile 1 quintile 2 quintile 3 quintile 4 quintile 5
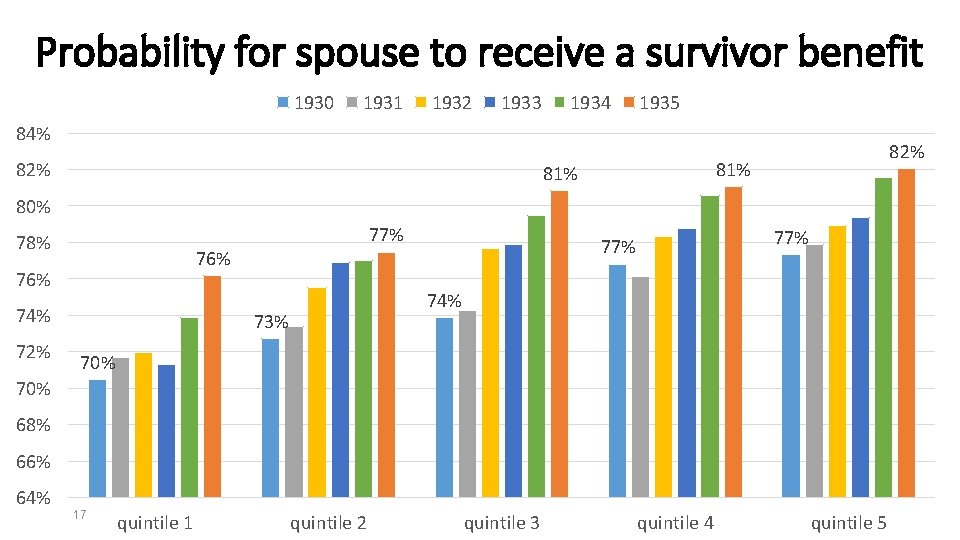
Probability for spouse to receive a survivor benefit 1930 1931 1932 1933 1934 1935 84% 82% 81% 80% 78% 76% 74% 72% 77% 77% 74% 73% 70% 68% 66% 64% 17 quintile 1 quintile 2 quintile 3 quintile 4 quintile 5
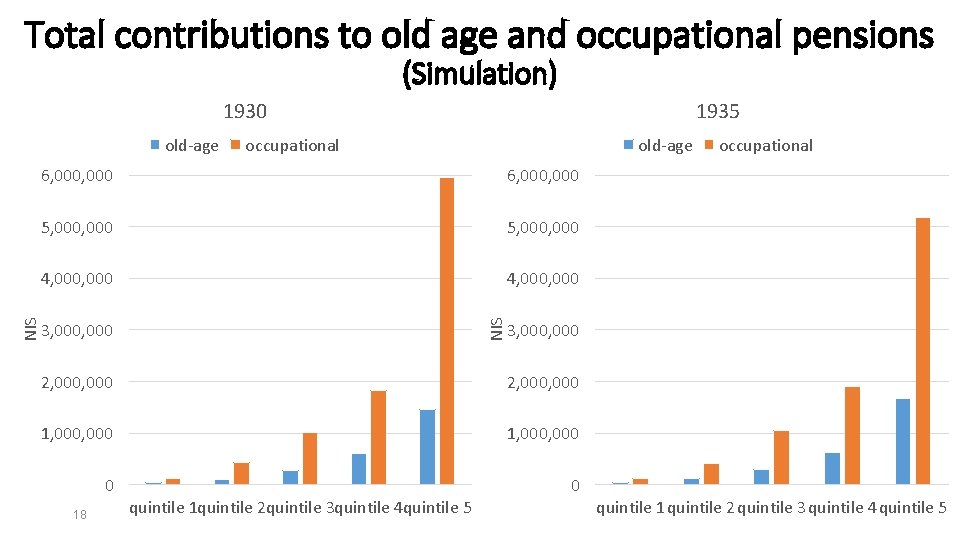
Total contributions to old age and occupational pensions (Simulation) 1930 occupational old-age 6, 000, 000 5, 000, 000 4, 000, 000 NIS old-age 1935 3, 000, 000 2, 000, 000 1, 000, 000 0 0 18 quintile 1 quintile 2 quintile 3 quintile 4 quintile 5 occupational quintile 1 quintile 2 quintile 3 quintile 4 quintile 5
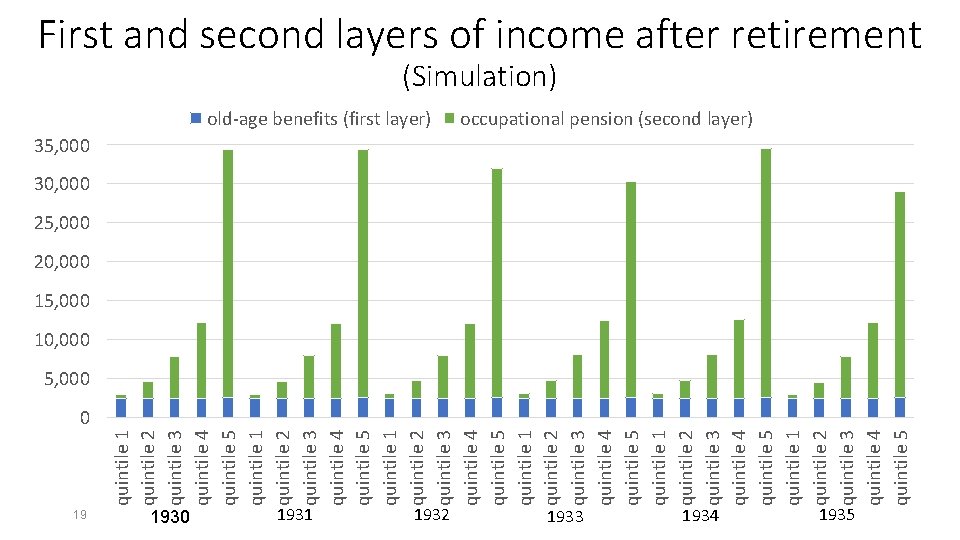
quintile 1 quintile 2 quintile 3 quintile 4 quintile 5 quintile 1 quintile 2 quintile 3 quintile 4 quintile 5 First and second layers of income after retirement (Simulation) old-age benefits (first layer) 19 1930 1931 1932 occupational pension (second layer) 35, 000 30, 000 25, 000 20, 000 15, 000 10, 000 5, 000 0 1933 1934 1935
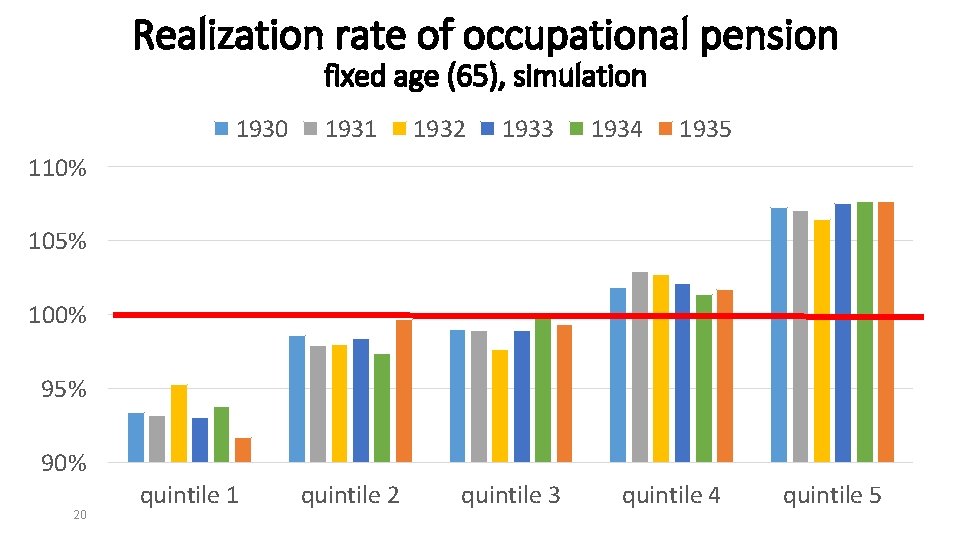
Realization rate of occupational pension fixed age (65), simulation 1930 1931 1932 1933 1934 1935 110% 105% 100% 95% 90% 20 quintile 1 quintile 2 quintile 3 quintile 4 quintile 5
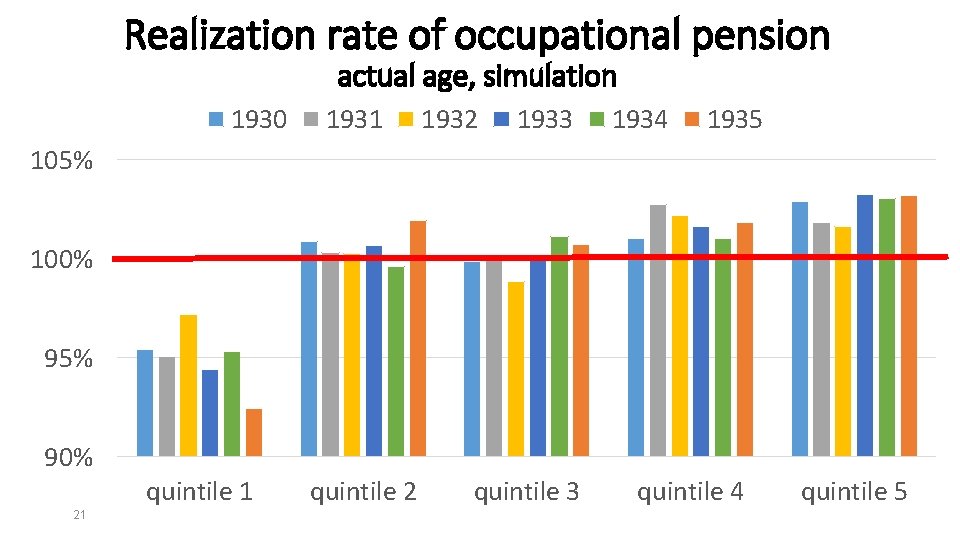
Realization rate of occupational pension actual age, simulation 1930 1931 1932 1933 1934 1935 105% 100% 95% 90% quintile 1 21 quintile 2 quintile 3 quintile 4 quintile 5
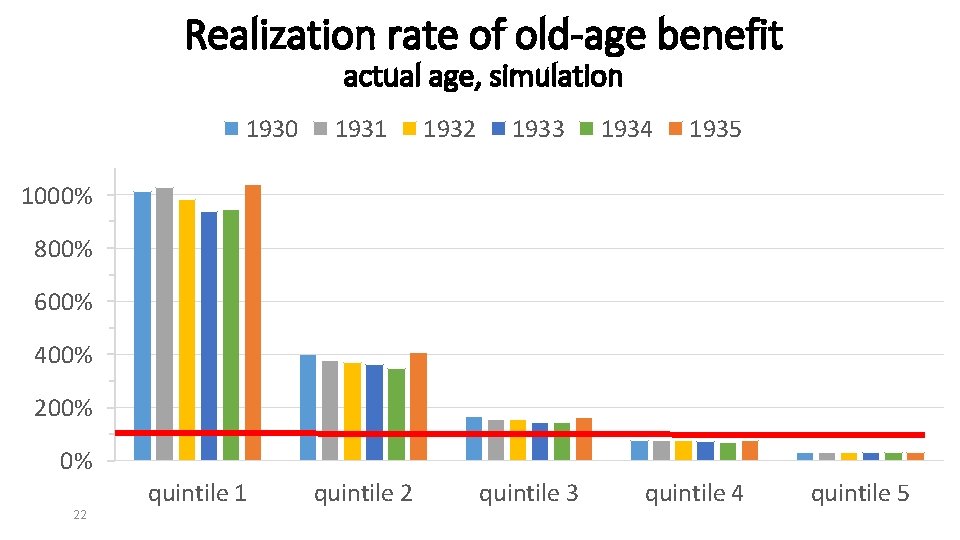
Realization rate of old-age benefit actual age, simulation 1930 1931 1932 1933 1934 1935 1000% 800% 600% 400% 200% 0% 22 quintile 1 quintile 2 quintile 3 quintile 4 quintile 5
Policy Considerations: Flexible Retirement Age 23
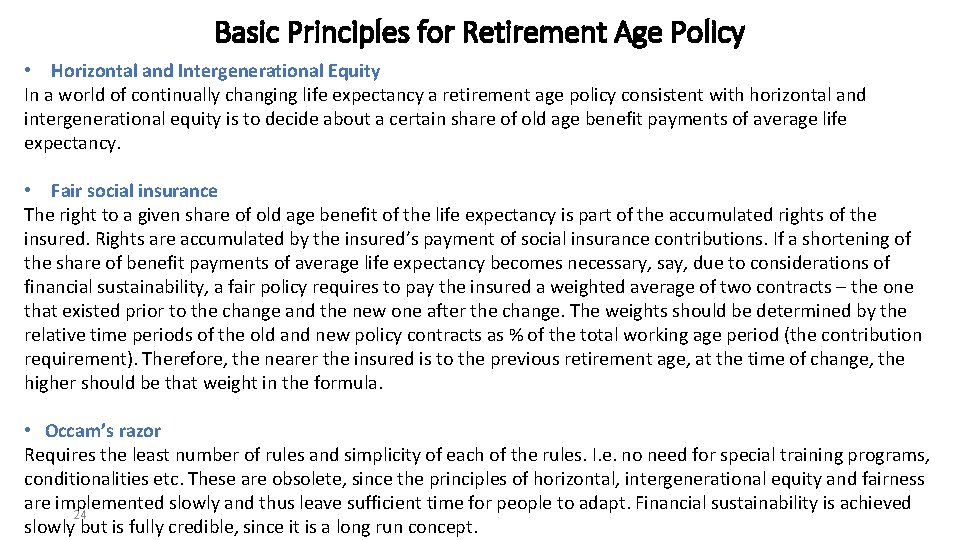
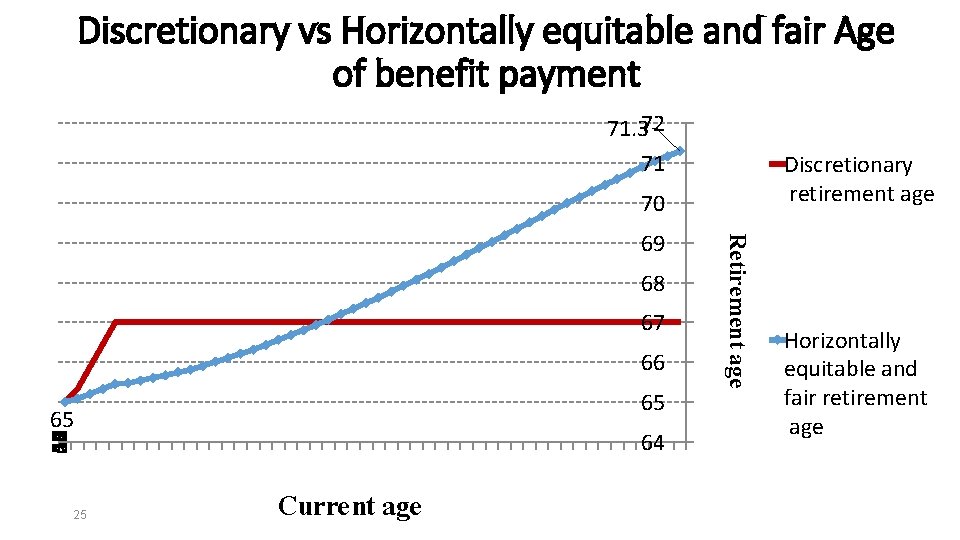
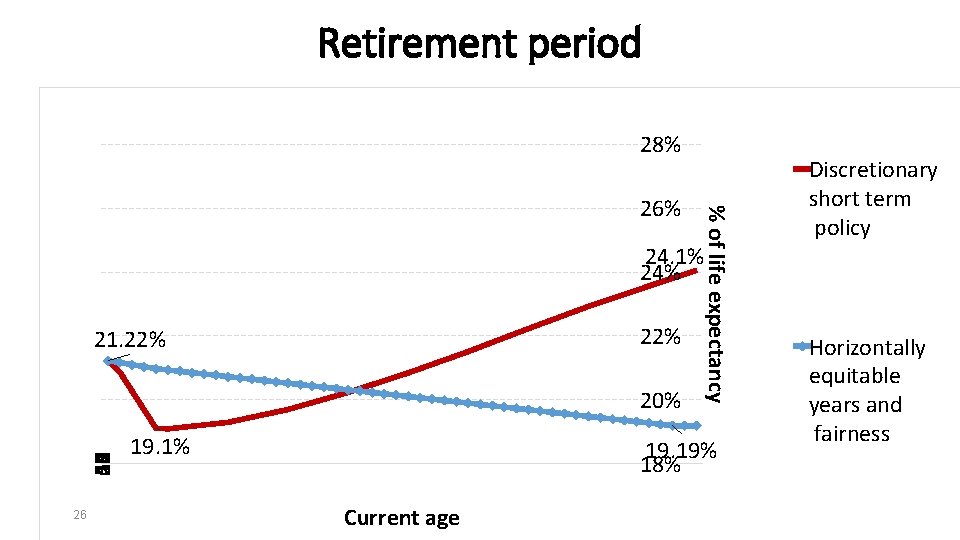
Basic Principles for Retirement Age Policy • Horizontal and Intergenerational Equity In a world of continually changing life expectancy a retirement age policy consistent with horizontal and intergenerational equity is to decide about a certain share of old age benefit payments of average life expectancy. • Fair social insurance The right to a given share of old age benefit of the life expectancy is part of the accumulated rights of the insured. Rights are accumulated by the insured’s payment of social insurance contributions. If a shortening of the share of benefit payments of average life expectancy becomes necessary, say, due to considerations of financial sustainability, a fair policy requires to pay the insured a weighted average of two contracts – the one that existed prior to the change and the new one after the change. The weights should be determined by the relative time periods of the old and new policy contracts as % of the total working age period (the contribution requirement). Therefore, the nearer the insured is to the previous retirement age, at the time of change, the higher should be that weight in the formula. • Occam’s razor Requires the least number of rules and simplicity of each of the rules. I. e. no need for special training programs, conditionalities etc. These are obsolete, since the principles of horizontal, intergenerational equity and fairness are implemented slowly and thus leave sufficient time for people to adapt. Financial sustainability is achieved 24 slowly but is fully credible, since it is a long run concept.
Discretionary vs Horizontally equitable and fair Age of benefit payment 71. 372 71 Discretionary retirement age 70 68 67 66 65 65 64 61 58 55 52 49 46 43 40 37 34 31 28 25 22 19 16 64 25 Current age Retirement age 69 Horizontally equitable and fair retirement age
Retirement period 28% % of life expectancy 26% Discretionary short term policy 24. 1% 24% 22% 21. 22% 64 61 58 55 52 49 46 43 40 37 34 31 28 25 22 19 16 20% 26 19. 1% 19. 19% 18% Current age Horizontally equitable years and fairness
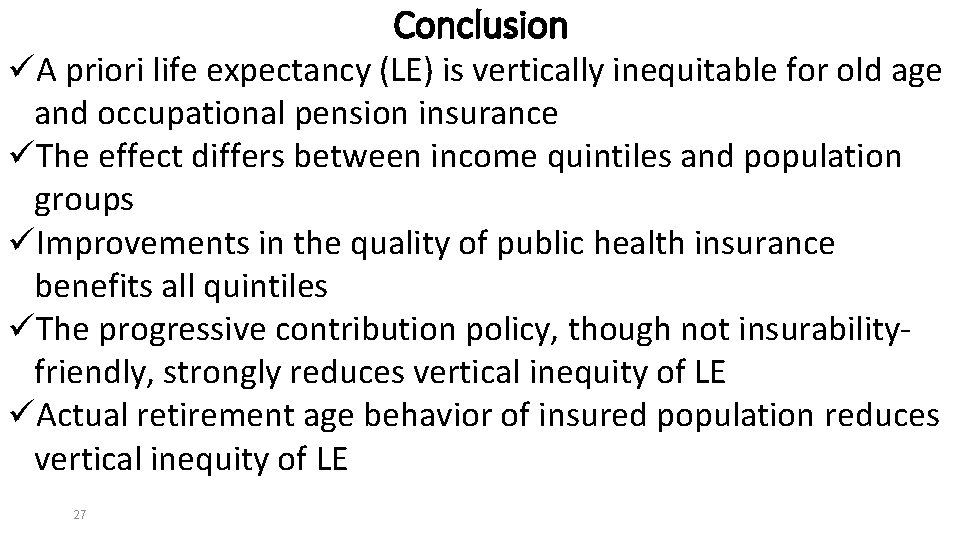
Conclusion üA priori life expectancy (LE) is vertically inequitable for old age and occupational pension insurance üThe effect differs between income quintiles and population groups üImprovements in the quality of public health insurance benefits all quintiles üThe progressive contribution policy, though not insurabilityfriendly, strongly reduces vertical inequity of LE üActual retirement age behavior of insured population reduces vertical inequity of LE 27
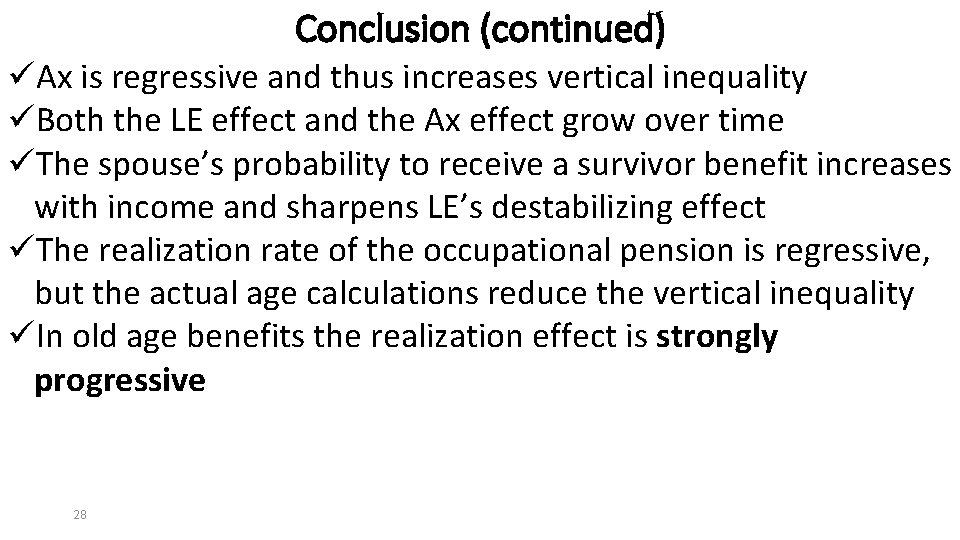
Conclusion (continued) üAx is regressive and thus increases vertical inequality üBoth the LE effect and the Ax effect grow over time üThe spouse’s probability to receive a survivor benefit increases with income and sharpens LE’s destabilizing effect üThe realization rate of the occupational pension is regressive, but the actual age calculations reduce the vertical inequality üIn old age benefits the realization effect is strongly progressive 28
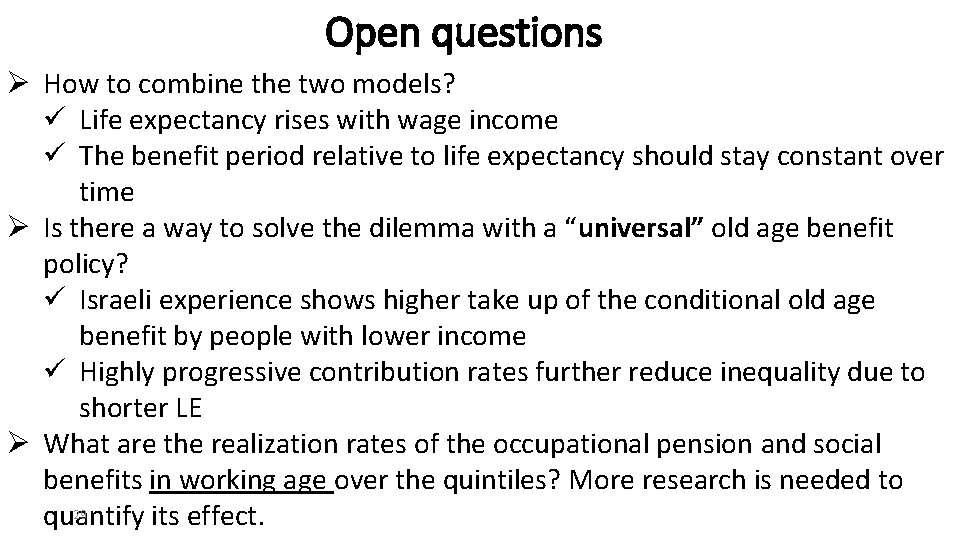
Open questions Ø How to combine the two models? ü Life expectancy rises with wage income ü The benefit period relative to life expectancy should stay constant over time Ø Is there a way to solve the dilemma with a “universal” old age benefit policy? ü Israeli experience shows higher take up of the conditional old age benefit by people with lower income ü Highly progressive contribution rates further reduce inequality due to shorter LE Ø What are the realization rates of the occupational pension and social benefits in working age over the quintiles? More research is needed to quantify its effect. 29
Thank you! 30