Lets pretend that we own an island somewhere


- Slides: 7
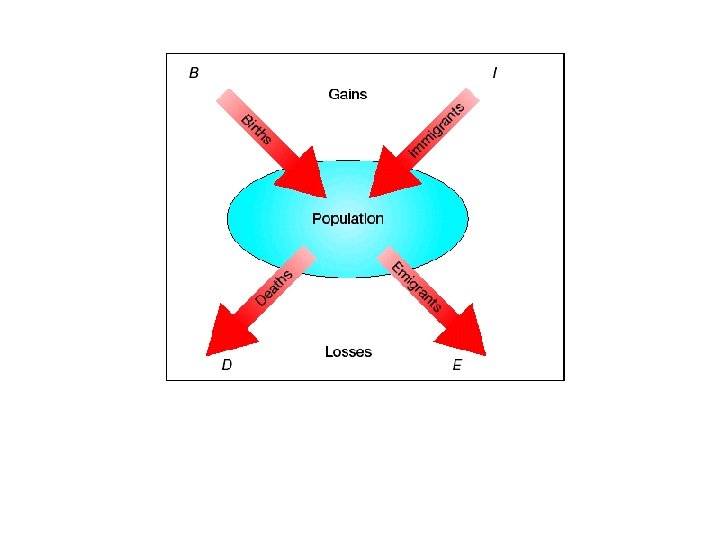
Lets pretend that we own an island somewhere in the North Sea. It is uninhabited. We populate the island with 100 rabbits. We return to the island 4 times each year for the next 50 years and count the bunnies. What would happen if… 1. We then added a predator to the island. 2. We then added a competitor to the island. 3. We burnt off all the vegetation from half the island. 4. We introduced myxomatosis to the island.
Abiotic Factors Temperature Light Water supply Oxygen Soil nutrients Climate Carbon dioxide weeds on a patch of disturbed ground understory plants in a coniferous wood wildebeeste in sub-saharan Africa yeast in fermenting fruit moorland plants on the high fells blue tits in suburban gardens maize plants in a field Biotic Factors Food supply Predation Disease Competition Parasitism rabbits on downland oak caterpillars in a temperate forest moles in a lowland grassland ash seedlings in a temperate wood pin worms in UK children density dependent? density independent?
The data below give the average number of fertilised eggs produced in their lifetime by females of different species (fecundity). Oyster 100 x 106 Cod 9 x 10⁶ Stickleback 5 x 10² Winter moth 200 Mouse Dogfish Woman Elephant 50 20 10 5 How many fertilised eggs must survive if a population remains stable? Suggest why the value for Stickleback is so much lower than Cod. Suggest a relationship between pre-reproductive mortality and fecundity.
Each female salmon lays 3200 eggs in a gravelly shallow in the river in autumn. 640 fry (young fish) enter a lake near the shallow in the following spring. 64 smolts (older fish) leave the lake one year later and migrate to the sea. Two adult fish return to the spawning grounds 2. 5 years later; they spawn and die. Calculate the % mortality for the salmon for each of the periods described in the passage. Calculate the % survival from these figures. Draw a survivorship curve for salmon by plotting % survival against time. What is the pre-reproductive mortality for salmon (%)? Would you expect the survivorship curve for humans to show a different pattern?