LASE Measurements of Water Vapor During IHOP Edward


- Slides: 17

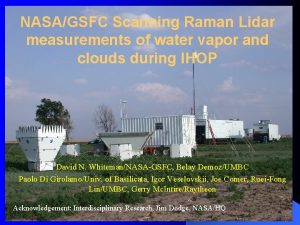
LASE Measurements of Water Vapor During IHOP Edward V. Browell, 1 Syed Ismail, 1 Richard A. Ferrare, 1 Susan A Kooi, 1 and Vince G. Brackett, 1 1 NASA Langley Research Center, Hampton, Virginia 2 Space Science & Engineering Center, University of Wisconsin, Madison, WI Funding provided by Dr. Jim Dodge, NASA Headquarters IHOP Water Vapor Intercomparison Meeting, NCAR, 2 -3 October 2003

Lidar Atmospheric Sensing Experiment (LASE) • Airborne Water Vapor DIAL • Laser - 5 Hz doubled-pulsed Ti: sapphire - 100 mj at lon and loff • Wavelengths - 815 nm (lon- loff = 40 -70 pm) - Two separate line pairs • NASA ER-2, P-3, DC-8 aircraft • Simultaneous nadir, zenith operations • Real-time data analysis and display

LASE Water Vapor, Aerosol, & Cloud Profiling on NASA DC-8 9 June 2002 (Flt. 9) Morning Low Level Jet and Convective Initiation #3 • Water vapor profiles - daytime and nighttime - 0. 2 km to upper trop. - 0. 01 to 25 g/kg - accuracy: 6% or 0. 01 g/kg - resolution (variable) vertical: 330 m horizontal: 14 km (1 min) • Aerosol/cloud profiles - daytime and nighttime - 0. 03 to 25 km -resolution (variable) vertical: 30 m horizontal: 200 m

LASE Water Vapor & Relative Humidity Profiling on NASA DC-8 9 June 2002 (Flt. 9) Morning Low Level Jet and Convective Initiation #3 • Water vapor profiles - daytime and nighttime - surface to upper trop. - 0. 01 to 25 g/kg - accuracy: 6% or 0. 01 g/kg - resolution (variable) vertical: 330 m horizontal: 14 km (1 min)

LASE Water Vapor & Relative Humidity Profiling on NASA DC-8 9 June 2002 (Flt. 9) Morning Low Level Jet and Convective Initiation #3 • Water vapor profiles - daytime and nighttime - surface to upper trop. - 0. 01 to 25 g/kg - accuracy: 6% or 0. 01 g/kg - resolution (variable) vertical: 330 m horizontal: 14 km (1 min) • Relative humidity profiles - derived Scanning-HIS or radiosonde temperature distributions

LASE Measurements during IHOP • Participated in 8 IHOP science flights from May 23 -June 14, 2002

LASE Water Vapor Comparisons Nighttime Daytime

LASE/IHOP 2002 ALL COMPARISONS (delta time < 75 min, delta location < 75 km) Flight Date RS 90 BF CF 5 5/24 6 5/30 7 6/02 4 8 6/03 1 9 6/09 10 6/11 11 6/14 TOTAL 2 RD 93 Lear Falcon RS 80 HS MG 8 DC 5 2 1 8 1 3 BF - Boundary Facility sonde CF - Central Facility sonde Lear - Dropsonde Falcon - Dropsonde 2 1 3 7 15 8 2 3 4 4 1 4 3 9 2 8 11 28 5 22 39 15 1 3 7 9 SRL 2 1 1 AERI CARL DLR HS - Homestead sonde MG - MGLASS mobile sonde DC - Dodge City sonde (VIZ) AERI- at Homestead 2 17 3 9 11 3 3 Total 1 3 30 3 38 23 7 3 9 31 18 158 CARL - Raman Lidar at CF DLR - Lidar on Falcon SRL- Scanning Raman Lidar at Homestead

LASE/IHOP 2002 CLOSEST COMPARISONS (delta time < 20 min, delta location < 20 km) Flight Date RS 90 BF CF RD 93 Lear Falcon 5 5/24 6 5/30 7 6/02 8 6/03 1 9 6/09 4 10 6/11 2 11 6/14 TOTAL BF - Boundary Facility sonde CF - Central Facility sonde *Lear - Dropsonde Falcon - Dropsonde * = “ BEST” HS RS 80 MG DC AERI CARL DLR 1 7 Total 2 3 2 1 1 3 4 1 3 1 2 1 3 2 5 SRL 2 3 3 5 1 3 12 3 17 4 2 4 1 8 8 6 1 22 *HS - Homestead sonde *MG - MGLASS mobile sonde DC - Dodge City sonde (VIZ) AERI- at Homestead 8 8 7 3 9 24 18 77 CARL - Raman Lidar at CF DLR - Lidar on Falcon *SRL- Scanning Raman Lidar at Homestead

LASE-Raman Lidar (RL) Comparisons (<20 km & <20 min) Current Comparison CART CF-RL + Homestead (HS)-SRL Previous Comparison

LASE-Dropsonde Comparisons (<75 km & <75 min) +

LASE-Balloonsonde Comparisons (<75 km & <75 min) + +

LASE-AERI Comparisons (<20 km & <20 min) Previous Comparison Latest Comparison

LASE-DLR DIAL Comparisons (<20 km & <20 min)

LASE-All Instruments Comparisons (<75 km & <75 min) LASE-All Instruments Comparisons (<20 km & <20 min)

LASE-All Instrument Comparisons by Flight (<20 km & <20 min) (“Best”: L-DS; H-RL; H-BS; MG-BS)

Summary • Comparisons were possible on only 7 of 8 flights and Flight #5 (5/24) only had 3 close comparisons. • Most comparisons were within 50 min and 50 km although a few went to 75 min and 75 km. In all there were 158 comparison opportunities with less than half of them (77) within 20 min and 20 km. • Raman lidar (CARL & H-RL) comparisons were excellent (generally <5%). • Lear dropsondes were in good agreement overall (<5%), but Falcon dropsondes were consistently drier by ~8%. • Reasonable overall agreement (<10%) with balloons, but large scatter on individual comparisons. • Excellent comparisons (<5%) with AERI. • Average agreement with DLR (~10%) but few comparisons available. • Comparisons with all instruments shows no systematic difference greater than the 5% level. • Some localized large differences in mid trop due to presence of very dry layers that are difficult to measure with sondes. • LASE water vapor data appear to be within <6% absolute accuracy.
 Superaquecimento
 Zanda lāse
 Apoteket eslöv
 Intra lase
 Water and water and water water
 Clausius clapeyron equation
 Infiltration in water cycle
 Only water vapor evaporates through stomata.
 The capacity of air to hold water vapor
 Absolute humidity
 Water vapor in the atmosphere percentage
 Water vapor mixing ratio
 Raoult's law for non volatile solute
 Cumulus clouds in oral pathology
 Chemical equation of phosphorus
 To cook by the vapor produced from boiling water
 Cold shock
 Diagrama t-v de una sustancia pura
