Introduction to SAS Essentials Mastering SAS for Data
- Slides: 25
Introduction to SAS Essentials Mastering SAS for Data Analytics Alan Elliott and Wayne Woodward 1 SAS ESSENTIALS -- Elliott & Woodward
Chapter 15: NONPARAMETRIC ANALYSIS 2 SAS ESSENTIALS -- Elliott & Woodward
LEARNING OBJECTIVES • To be able to use SAS® procedures to compare two independent samples (Wilcoxon-Mann-Whitney) • To be able to use SAS procedures to compare k independent samples (Kruskal-Wallis) • To be able to use SAS procedures to compare two dependent (paired) samples • To be able to use SAS procedures to compare k dependent samples (Friedman's test) • To be able to use SAS procedures to perform multiple comparisons following a significant Kruskal-Wallis test (macro) 3 SAS ESSENTIALS -- Elliott & Woodward
Nonparametric Tests � An assumption for many statistical tests, such as the t-tests and ANOVA, is that the data are normally distributed. � When this normality assumption is suspect or cannot be met, there alternative techniques for analyzing the data. � Statistical techniques based on an assumption that data are distributed according to some parameterized distribution (such as the normal distribution) are referred to as parametric analyses. � Statistical techniques that do not rely on this assumption are called nonparametric procedures. � This chapter illustrates several nonparametric techniques. 4 SAS ESSENTIALS -- Elliott & Woodward
15. 1 COMPARING TWO INDEPENDENT SAMPLES USING NPAR 1 WAY � A nonparametric test can be used to compare two independent groups when you cannot make the assumptions associated with the t-test. � The primary nonparametric test for comparing two groups discussed in this chapter is the Wilcoxon (sometimes called the Wilcoxon-Mann-Whitney) test. The hypothesis tested is as follows: H 0: The two groups have the same distribution (they come from the same population). Ha: The two groups do not have the same distributions (they come from different populations). 5 SAS ESSENTIALS -- Elliott & Woodward
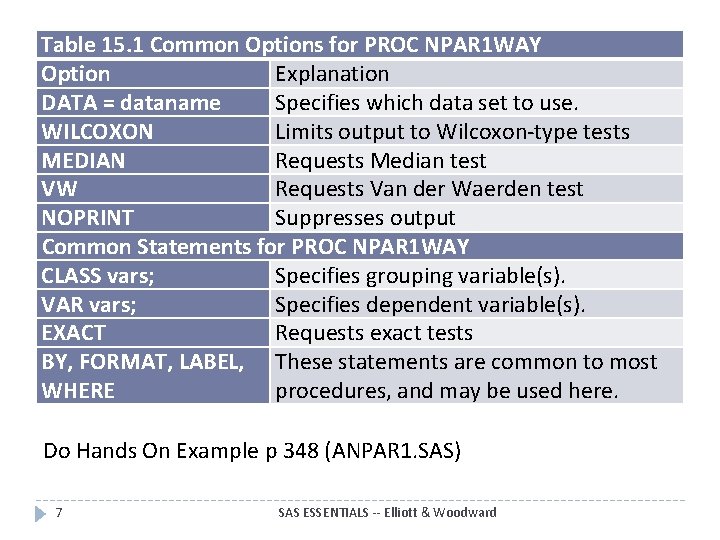
PROC NPAR 1 WAY � The SAS procedure for testing these hypotheses is PROC NPAR 1 WAY. � Simplified syntax for NPAR 1 WAY is as follows: PROC NPAR 1 WAY <Options>; 6 SAS ESSENTIALS -- Elliott & Woodward
Table 15. 1 Common Options for PROC NPAR 1 WAY Option Explanation DATA = dataname Specifies which data set to use. WILCOXON Limits output to Wilcoxon-type tests MEDIAN Requests Median test VW Requests Van der Waerden test NOPRINT Suppresses output Common Statements for PROC NPAR 1 WAY CLASS vars; Specifies grouping variable(s). VAR vars; Specifies dependent variable(s). EXACT Requests exact tests BY, FORMAT, LABEL, These statements are common to most WHERE procedures, and may be used here. Do Hands On Example p 348 (ANPAR 1. SAS) 7 SAS ESSENTIALS -- Elliott & Woodward
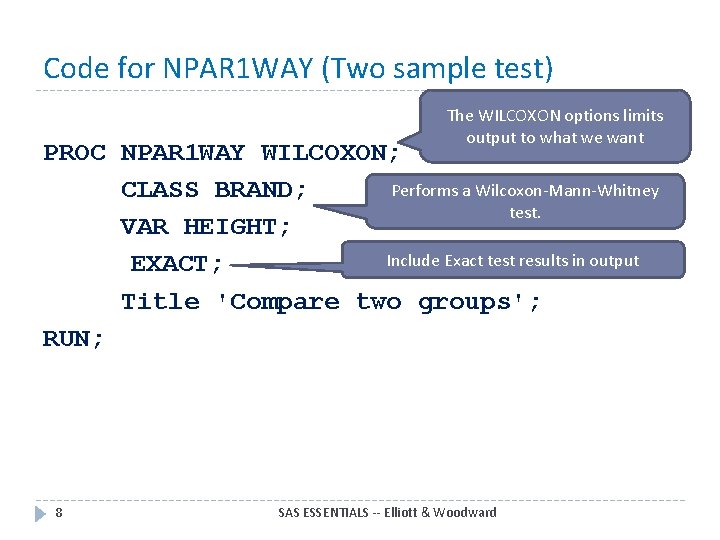
Code for NPAR 1 WAY (Two sample test) The WILCOXON options limits output to what we want PROC NPAR 1 WAY WILCOXON; Performs a Wilcoxon-Mann-Whitney CLASS BRAND; test. VAR HEIGHT; Include Exact test results in output EXACT; Title 'Compare two groups'; RUN; 8 SAS ESSENTIALS -- Elliott & Woodward
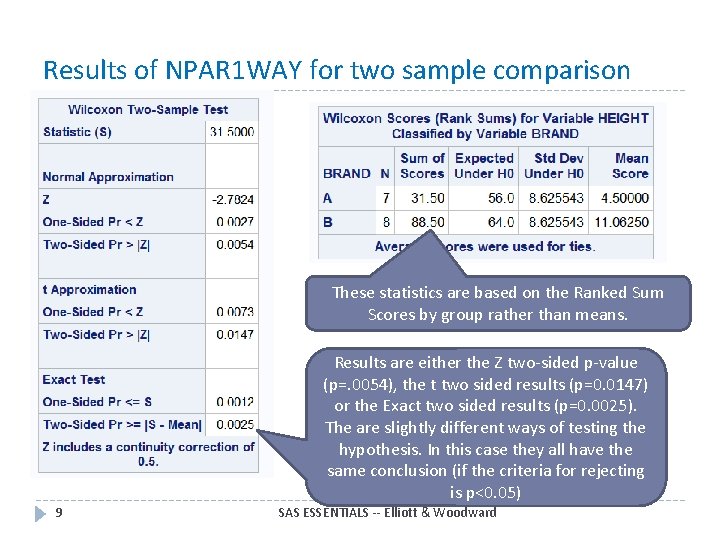
Results of NPAR 1 WAY for two sample comparison These statistics are based on the Ranked Sum Scores by group rather than means. Results are either the Z two-sided p-value (p=. 0054), the t two sided results (p=0. 0147) or the Exact two sided results (p=0. 0025). The are slightly different ways of testing the hypothesis. In this case they all have the same conclusion (if the criteria for rejecting is p<0. 05) 9 SAS ESSENTIALS -- Elliott & Woodward
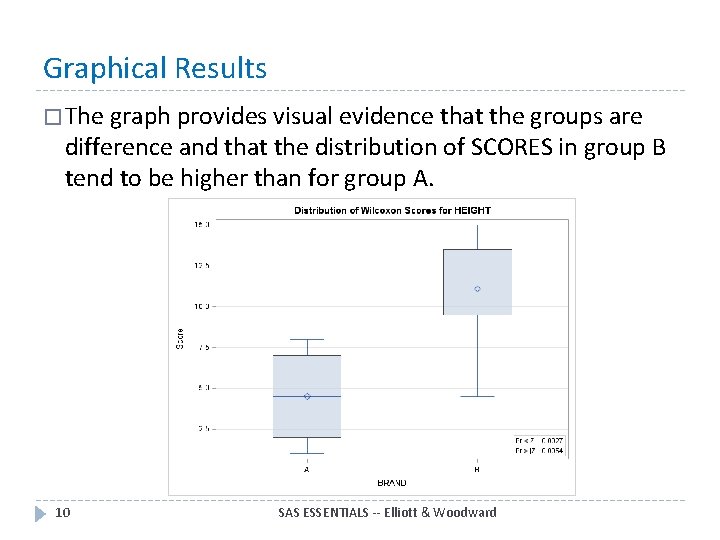
Graphical Results � The graph provides visual evidence that the groups are difference and that the distribution of SCORES in group B tend to be higher than for group A. 10 SAS ESSENTIALS -- Elliott & Woodward
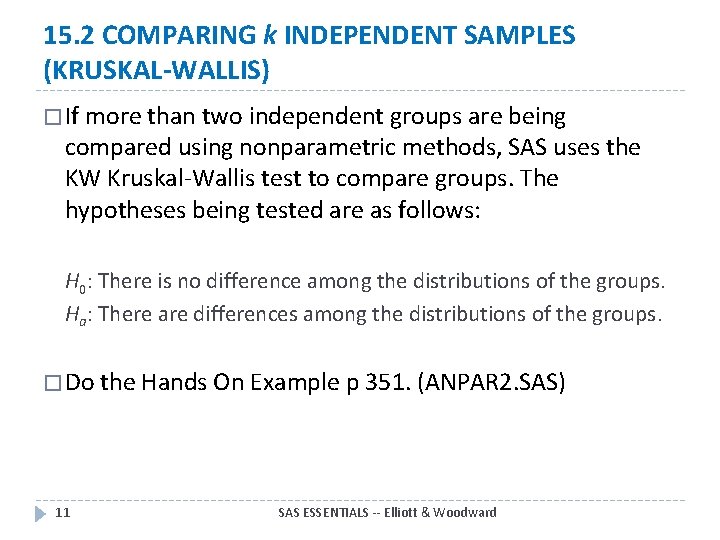
15. 2 COMPARING k INDEPENDENT SAMPLES (KRUSKAL-WALLIS) � If more than two independent groups are being compared using nonparametric methods, SAS uses the KW Kruskal-Wallis test to compare groups. The hypotheses being tested are as follows: H 0: There is no difference among the distributions of the groups. Ha: There are differences among the distributions of the groups. � Do the Hands On Example p 351. (ANPAR 2. SAS) 11 SAS ESSENTIALS -- Elliott & Woodward
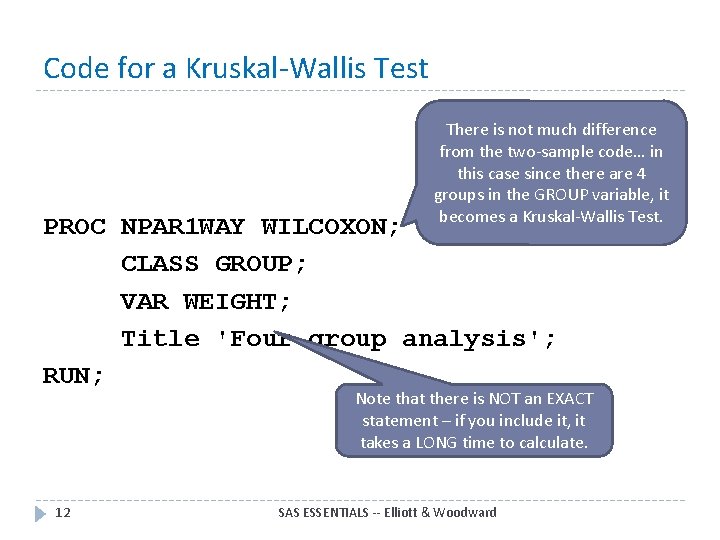
Code for a Kruskal-Wallis Test There is not much difference from the two-sample code… in this case since there are 4 groups in the GROUP variable, it becomes a Kruskal-Wallis Test. PROC NPAR 1 WAY WILCOXON; CLASS GROUP; VAR WEIGHT; Title 'Four group analysis'; RUN; Note that there is NOT an EXACT statement – if you include it, it takes a LONG time to calculate. 12 SAS ESSENTIALS -- Elliott & Woodward
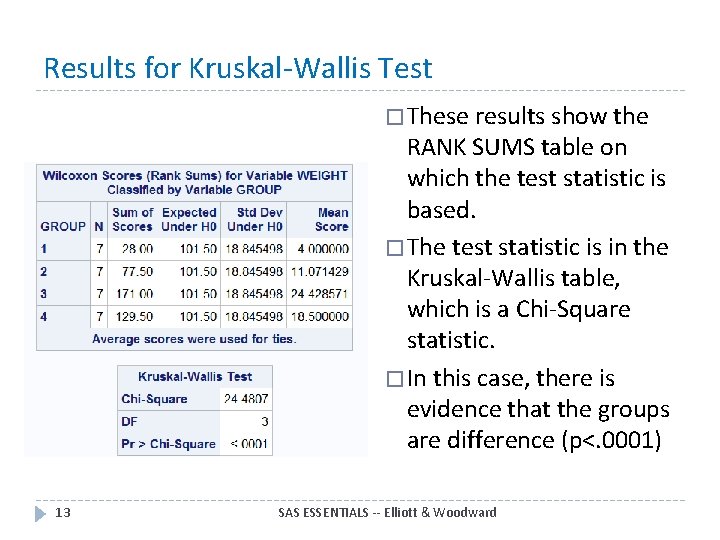
Results for Kruskal-Wallis Test � These results show the RANK SUMS table on which the test statistic is based. � The test statistic is in the Kruskal-Wallis table, which is a Chi-Square statistic. � In this case, there is evidence that the groups are difference (p<. 0001) 13 SAS ESSENTIALS -- Elliott & Woodward
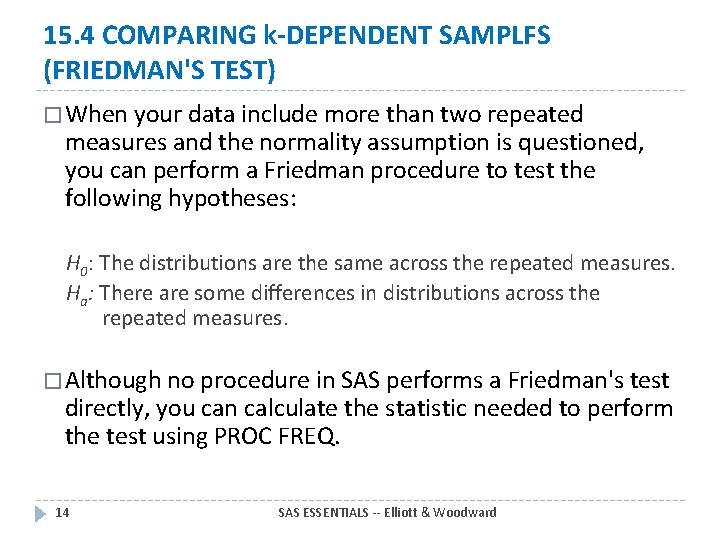
15. 4 COMPARING k-DEPENDENT SAMPLFS (FRIEDMAN'S TEST) � When your data include more than two repeated measures and the normality assumption is questioned, you can perform a Friedman procedure to test the following hypotheses: H 0: The distributions are the same across the repeated measures. Ha: There are some differences in distributions across the repeated measures. � Although no procedure in SAS performs a Friedman's test directly, you can calculate the statistic needed to perform the test using PROC FREQ. 14 SAS ESSENTIALS -- Elliott & Woodward
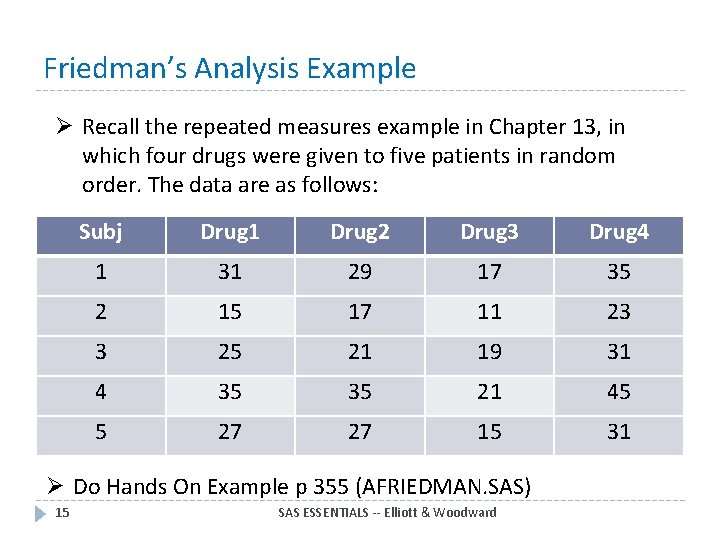
Friedman’s Analysis Example Ø Recall the repeated measures example in Chapter 13, in which four drugs were given to five patients in random order. The data are as follows: Subj Drug 1 Drug 2 Drug 3 Drug 4 1 31 29 17 35 2 15 17 11 23 3 25 21 19 31 4 35 35 21 45 5 27 27 15 31 Ø Do Hands On Example p 355 (AFRIEDMAN. SAS) 15 SAS ESSENTIALS -- Elliott & Woodward
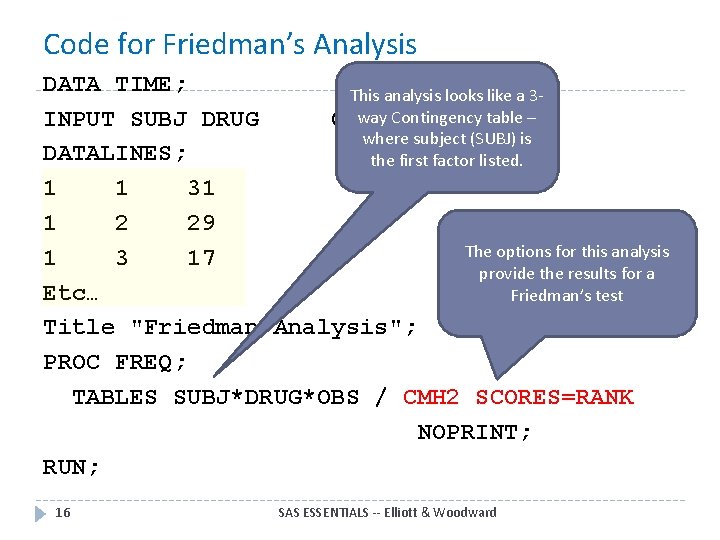
Code for Friedman’s Analysis DATA TIME; This analysis looks like a 3 way Contingency table – INPUT SUBJ DRUG OBS; where subject (SUBJ) is DATALINES; the first factor listed. 1 1 31 1 2 29 The options for this analysis 1 3 17 provide the results for a Etc… Friedman’s test Title "Friedman Analysis"; PROC FREQ; TABLES SUBJ*DRUG*OBS / CMH 2 SCORES=RANK NOPRINT; RUN; 16 SAS ESSENTIALS -- Elliott & Woodward
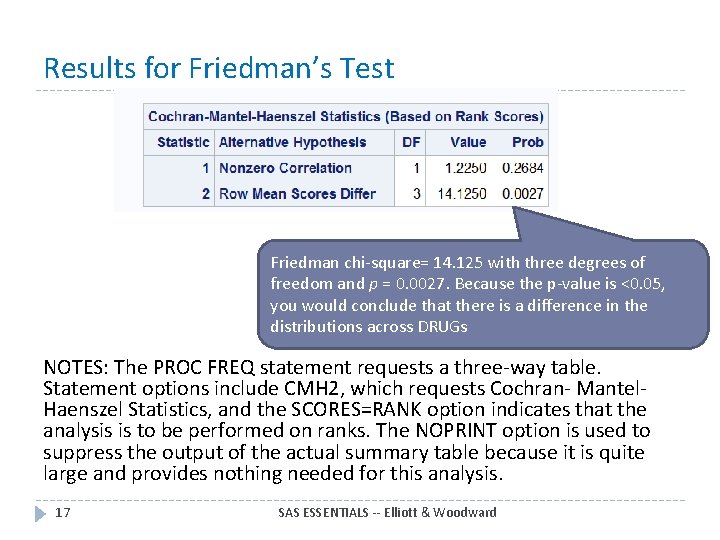
Results for Friedman’s Test Friedman chi-square= 14. 125 with three degrees of freedom and p = 0. 0027. Because the p-value is <0. 05, you would conclude that there is a difference in the distributions across DRUGs NOTES: The PROC FREQ statement requests a three-way table. Statement options include CMH 2, which requests Cochran- Mantel. Haenszel Statistics, and the SCORES=RANK option indicates that the analysis is to be performed on ranks. The NOPRINT option is used to suppress the output of the actual summary table because it is quite large and provides nothing needed for this analysis. 17 SAS ESSENTIALS -- Elliott & Woodward
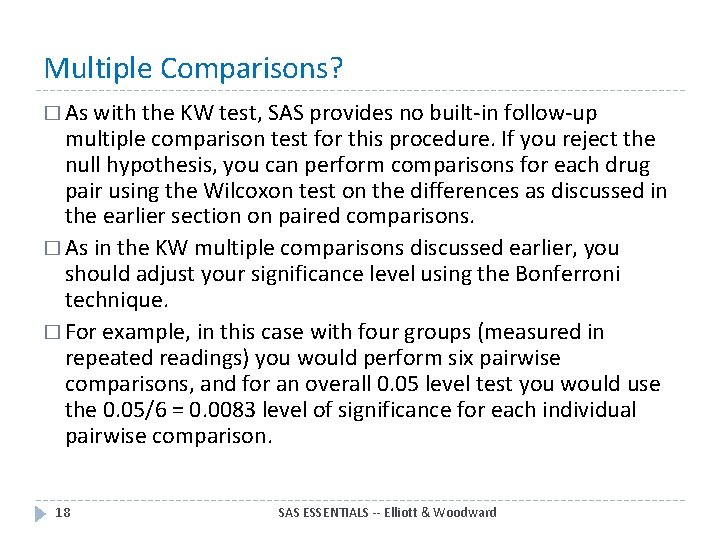
Multiple Comparisons? � As with the KW test, SAS provides no built-in follow-up multiple comparison test for this procedure. If you reject the null hypothesis, you can perform comparisons for each drug pair using the Wilcoxon test on the differences as discussed in the earlier section on paired comparisons. � As in the KW multiple comparisons discussed earlier, you should adjust your significance level using the Bonferroni technique. � For example, in this case with four groups (measured in repeated readings) you would perform six pairwise comparisons, and for an overall 0. 05 level test you would use the 0. 05/6 = 0. 0083 level of significance for each individual pairwise comparison. 18 SAS ESSENTIALS -- Elliott & Woodward
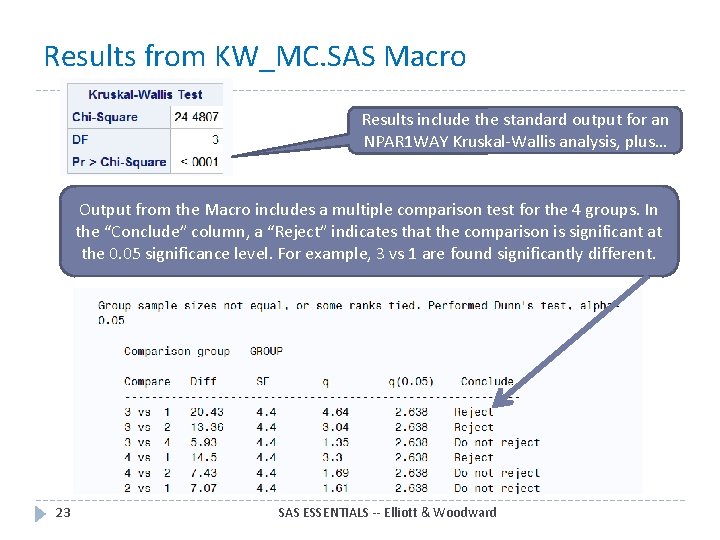
15. 5 GOING DEEPER: NONPARAMETRIC MULTIPLE COMPARISONS � Better Multiple Comparisons: The following Hands-on Example illustrates how a procedure written in SAS code (called a macro) can be used to perform an analysis not included in the SAS program. � This example utilizes a SAS macro implementation of a multiple comparison test (Nemenyi[Tukey-type] or Dunn's test) to be used along with SAS NPAR 1 WAY (see Elliott and Hynan, 2007). � Do Hands On Example p 357 (ANPAR 3. SAS) 19 SAS ESSENTIALS -- Elliott & Woodward
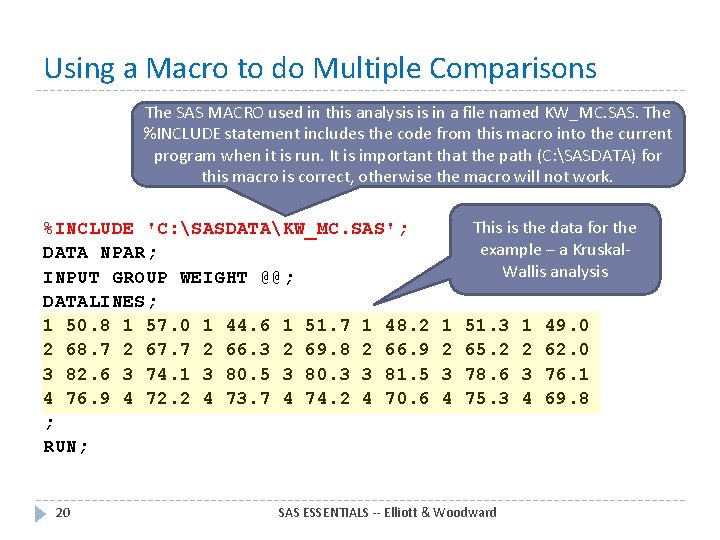
Using a Macro to do Multiple Comparisons The SAS MACRO used in this analysis is in a file named KW_MC. SAS. The %INCLUDE statement includes the code from this macro into the current program when it is run. It is important that the path (C: SASDATA) for this macro is correct, otherwise the macro will not work. %INCLUDE 'C: SASDATAKW_MC. SAS'; DATA NPAR; INPUT GROUP WEIGHT @@; DATALINES; 1 50. 8 1 57. 0 1 44. 6 1 51. 7 1 48. 2 2 68. 7 2 67. 7 2 66. 3 2 69. 8 2 66. 9 3 82. 6 3 74. 1 3 80. 5 3 80. 3 3 81. 5 4 76. 9 4 72. 2 4 73. 7 4 74. 2 4 70. 6 ; RUN; 20 This is the data for the example – a Kruskal. Wallis analysis 1 2 3 4 51. 3 65. 2 78. 6 75. 3 SAS ESSENTIALS -- Elliott & Woodward 1 2 3 4 49. 0 62. 0 76. 1 69. 8
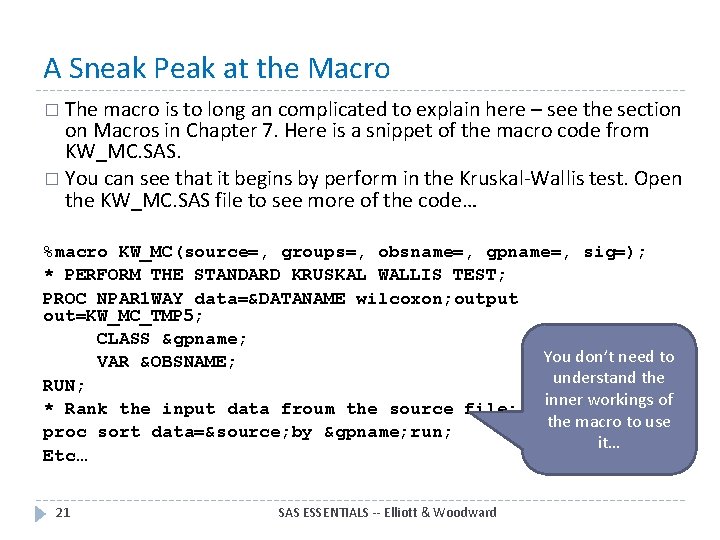
A Sneak Peak at the Macro � The macro is to long an complicated to explain here – see the section on Macros in Chapter 7. Here is a snippet of the macro code from KW_MC. SAS. � You can see that it begins by perform in the Kruskal-Wallis test. Open the KW_MC. SAS file to see more of the code… %macro KW_MC(source=, groups=, obsname=, gpname=, sig=); * PERFORM THE STANDARD KRUSKAL WALLIS TEST; PROC NPAR 1 WAY data=&DATANAME wilcoxon; output out=KW_MC_TMP 5; CLASS &gpname; You don’t need to VAR &OBSNAME; understand the RUN; * Rank the input data froum the source file; inner workings of the macro to use proc sort data=&source; by &gpname; run; it… Etc… 21 SAS ESSENTIALS -- Elliott & Woodward
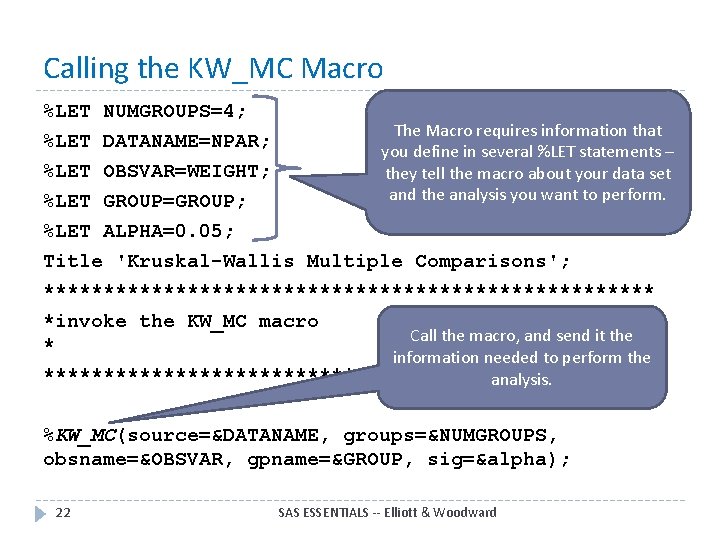
Calling the KW_MC Macro %LET NUMGROUPS=4; DATANAME=NPAR; OBSVAR=WEIGHT; GROUP=GROUP; The Macro requires information that you define in several %LET statements – they tell the macro about your data set and the analysis you want to perform. %LET ALPHA=0. 05; Title 'Kruskal-Wallis Multiple Comparisons'; ************************** *invoke the KW_MC macro Call the macro, and send it the * information needed to perform the **************************; analysis. %KW_MC(source=&DATANAME, groups=&NUMGROUPS, obsname=&OBSVAR, gpname=&GROUP, sig=&alpha); 22 SAS ESSENTIALS -- Elliott & Woodward
Results from KW_MC. SAS Macro Results include the standard output for an NPAR 1 WAY Kruskal-Wallis analysis, plus… Output from the Macro includes a multiple comparison test for the 4 groups. In the “Conclude” column, a “Reject” indicates that the comparison is significant at the 0. 05 significance level. For example, 3 vs 1 are found significantly different. 23 SAS ESSENTIALS -- Elliott & Woodward
15. 6 SUMMARY � This chapter introduces several nonparametric alternatives to standard parametric analyses. These procedures are useful when the normality assumption is questionable and particularly important when sample sizes are small. � Continue to Chapter 16: Logistic Regression 24 SAS ESSENTIALS -- Elliott & Woodward
These slides are based on the book: Introduction to SAS Essentials Mastering SAS for Data Analytics, 2 nd Edition By Alan C, Elliott and Wayne A. Woodward Paperback: 512 pages Publisher: Wiley; 2 edition (August 3, 2015) Language: English ISBN-10: 111904216 X ISBN-13: 978 -1119042167 These slides are provided for you to use to teach SAS using this book. Feel free to modify them for your own needs. Please send comments about errors in the slides (or suggestions for improvements) to acelliott@smu. edu. Thanks. 25 SAS ESSENTIALS -- Elliott & Woodward