International Symposium on Molecular Spectroscopy 74 TH MEETING
- Slides: 28
International Symposium on Molecular Spectroscopy 74 TH MEETING - JUNE 17 -21, 2019 - CHAMPAIGN-URBANA, ILLINOIS A VELOCITY MAP IMAGING ANALYSIS OF Fe(CO)5, W(CO)6 AND ELECTRON STIMULATED DESORPTION IN Au. Me 2(acac) 1, 2 MARIA 1 2 PINTEA, 1, 2 NIGEL MASON, 3 LIONEL AMIAUD, ANNE LAFOSSE 4 SCHOOL OF PHYSICAL SCIENCES, UNIVERSITY OF KENT, CANTERBURY, CT 2 7 NH, UK SCHOOL OF PHYSICAL SCIENCES, THE OPEN UNIVERSITY, MILTON KEYNES, MK 7 6 AA, UK 3 ISMO, DEPARTMENT OF SURFACES, COATING AND DEPOSITION, ORSAY, FRANCE 4 ISMO, DEPARTMENT OF SURFACES, COATING AND DEPOSITION, ORSAY, FRANCE
“Study of the electron induced dissociation of model compounds for FEBID and EUVL using velocity map imaging” Objective: To provide a full understanding of the role of low energy (0 -100 e. V) secondary electrons in preparing specific reaction products to induce controlled chemistry in FEBID and EUVL substrates. ELENA addresses the scientific and training needs of developing new methods in nanotechnology fabrication by: Study of the chemistry underpinning two emerging nanotechnology writing techniques: Focused Electron, Beam Induced Processing and Extreme Ultra Violet Lithography. Exploitation of knowledge gained in: Development of these techniques to be made commercially competitive. Training scientists with a fundamental understanding of the physics and chemistry behind these processes and the mind set for innovation and entrepreneurship to provide upskilling in European nanotechnology industry.
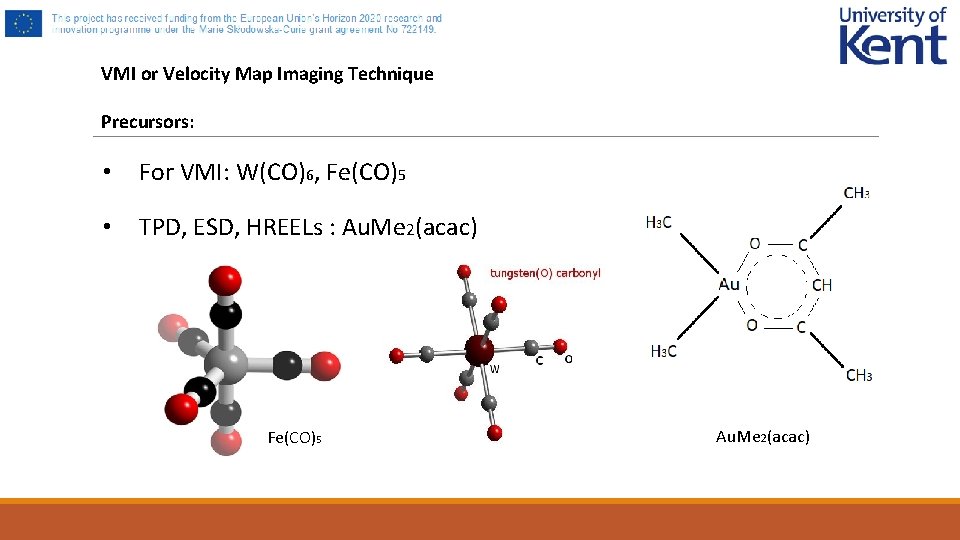
VMI or Velocity Map Imaging Technique Precursors: • For VMI: W(CO)6, Fe(CO)5 • TPD, ESD, HREELs : Au. Me 2(acac) Fe(CO)5 Au. Me 2(acac)
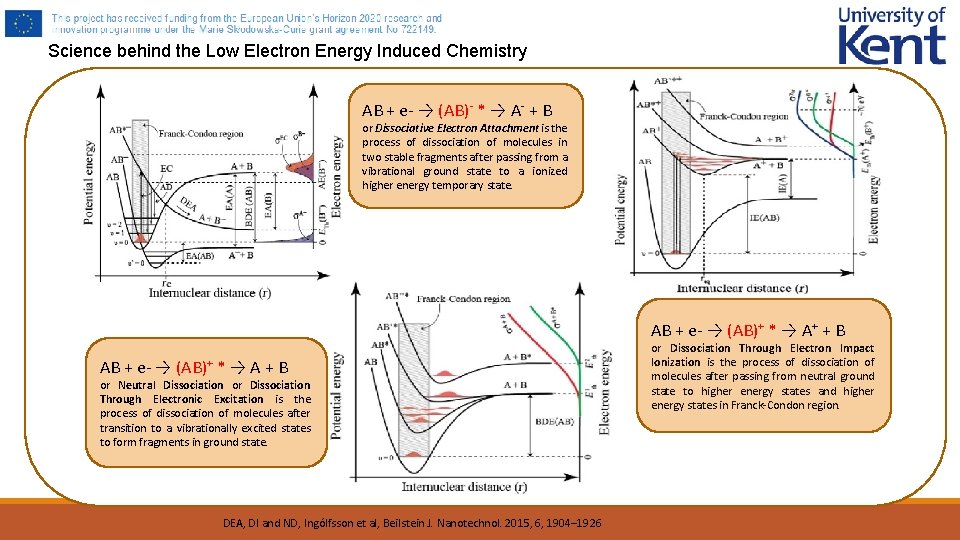
Science behind the Low Electron Energy Induced Chemistry AB + e- → (AB)- * → A- + B or Dissociative Electron Attachment is the process of dissociation of molecules in two stable fragments after passing from a vibrational ground state to a ionized higher energy temporary state. AB + e- → (AB)+ * → A+ + B AB + e- → (AB)+ * → A + B or Neutral Dissociation or Dissociation Through Electronic Excitation is the process of dissociation of molecules after transition to a vibrationally excited states to form fragments in ground state. DEA, DI and ND, Ingólfsson et al, Beilstein J. Nanotechnol. 2015, 6, 1904– 1926 or Dissociation Through Electron Impact Ionization is the process of dissociation of molecules after passing from neutral ground state to higher energy states and higher energy states in Franck-Condon region.
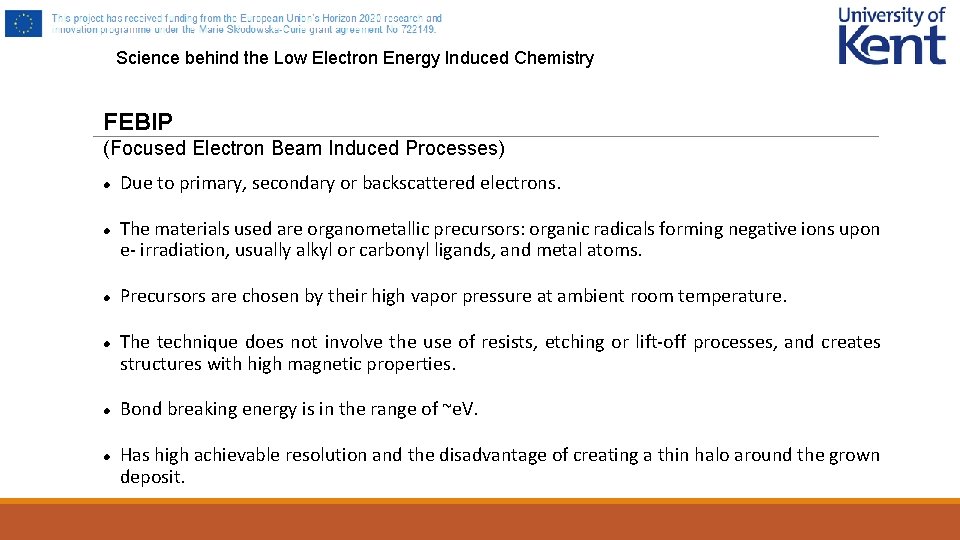
Science behind the Low Electron Energy Induced Chemistry FEBIP (Focused Electron Beam Induced Processes) Due to primary, secondary or backscattered electrons. The materials used are organometallic precursors: organic radicals forming negative ions upon e- irradiation, usually alkyl or carbonyl ligands, and metal atoms. Precursors are chosen by their high vapor pressure at ambient room temperature. The technique does not involve the use of resists, etching or lift-off processes, and creates structures with high magnetic properties. Bond breaking energy is in the range of ~e. V. Has high achievable resolution and the disadvantage of creating a thin halo around the grown deposit.
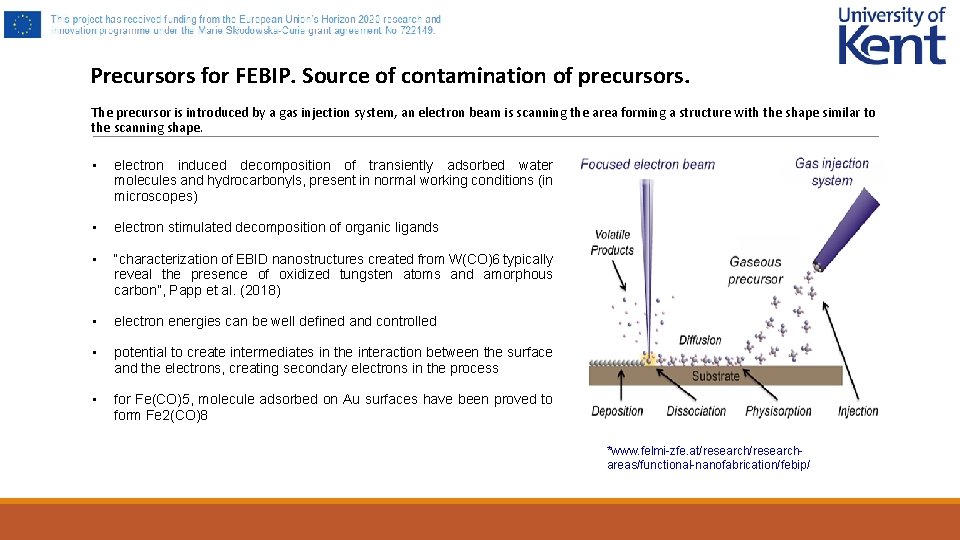
Precursors for FEBIP. Source of contamination of precursors. The precursor is introduced by a gas injection system, an electron beam is scanning the area forming a structure with the shape similar to the scanning shape. • electron induced decomposition of transiently adsorbed water molecules and hydrocarbonyls, present in normal working conditions (in microscopes) • electron stimulated decomposition of organic ligands • “characterization of EBID nanostructures created from W(CO)6 typically reveal the presence of oxidized tungsten atoms and amorphous carbon”, Papp et al. (2018) • electron energies can be well defined and controlled • potential to create intermediates in the interaction between the surface and the electrons, creating secondary electrons in the process • for Fe(CO)5, molecule adsorbed on Au surfaces have been proved to form Fe 2(CO)8 *www. felmi-zfe. at/researchareas/functional-nanofabrication/febip/
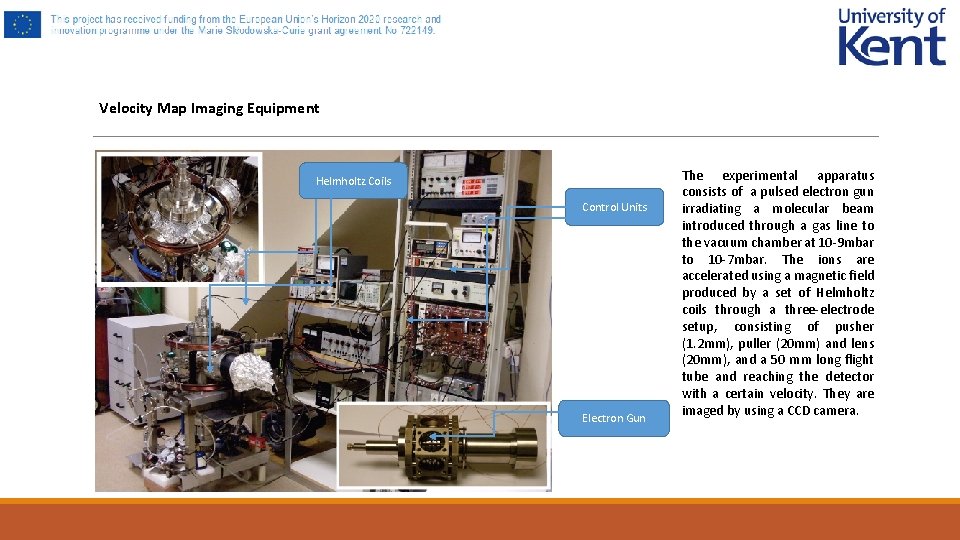
Velocity Map Imaging Equipment Helmholtz Coils Control Units Electron Gun The experimental apparatus consists of a pulsed electron gun irradiating a molecular beam introduced through a gas line to the vacuum chamber at 10 -9 mbar to 10 -7 mbar. The ions are accelerated using a magnetic field produced by a set of Helmholtz coils through a three-electrode setup, consisting of pusher (1. 2 mm), puller (20 mm) and lens (20 mm), and a 50 mm long flight tube and reaching the detector with a certain velocity. They are imaged by using a CCD camera.
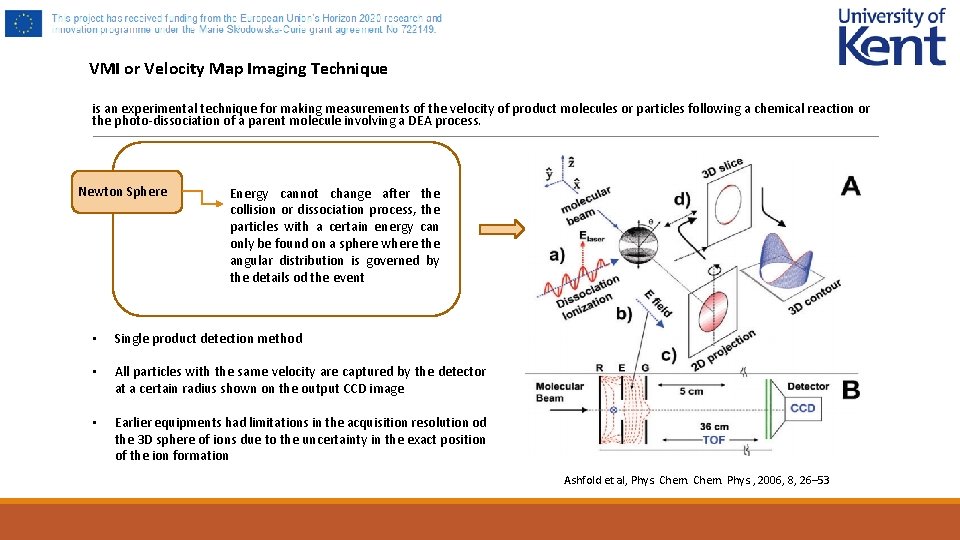
VMI or Velocity Map Imaging Technique is an experimental technique for making measurements of the velocity of product molecules or particles following a chemical reaction or the photo-dissociation of a parent molecule involving a DEA process. Newton Sphere Energy cannot change after the collision or dissociation process, the particles with a certain energy can Newton Sphere only be found on a sphere where the angular distribution is governed by the details od the event • Single product detection method • All particles with the same velocity are captured by the detector at a certain radius shown on the output CCD image • Earlier equipments had limitations in the acquisition resolution od the 3 D sphere of ions due to the uncertainty in the exact position of the ion formation Ashfold et al, Phys. Chem. Phys. , 2006, 8, 26– 53
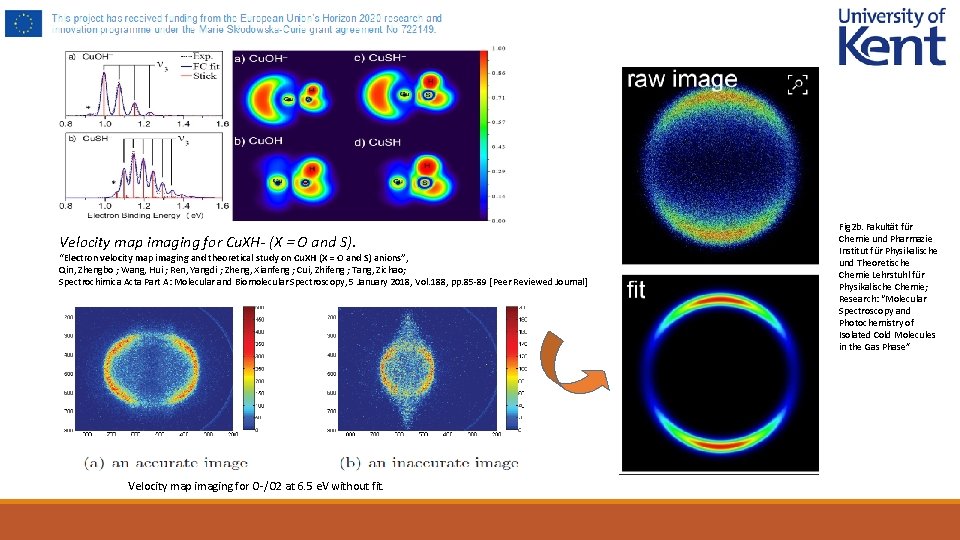
Velocity map imaging for Cu. XH- (X = O and S). “Electron velocity map imaging and theoretical study on Cu. XH (X = O and S) anions”, Qin, Zhengbo ; Wang, Hui ; Ren, Yangdi ; Zheng, Xianfeng ; Cui, Zhifeng ; Tang, Zichao; Spectrochimica Acta Part A: Molecular and Biomolecular Spectroscopy, 5 January 2018, Vol. 188, pp. 85 -89 [Peer Reviewed Journal] Velocity map imaging for O-/O 2 at 6. 5 e. V without fit. Fig 2 b. Fakultät für Chemie und Pharmazie Institut für Physikalische und Theoretische Chemie Lehrstuhl für Physikalische Chemie; Research: “Molecular Spectroscopy and Photochemistry of Isolated Cold Molecules in the Gas Phase”
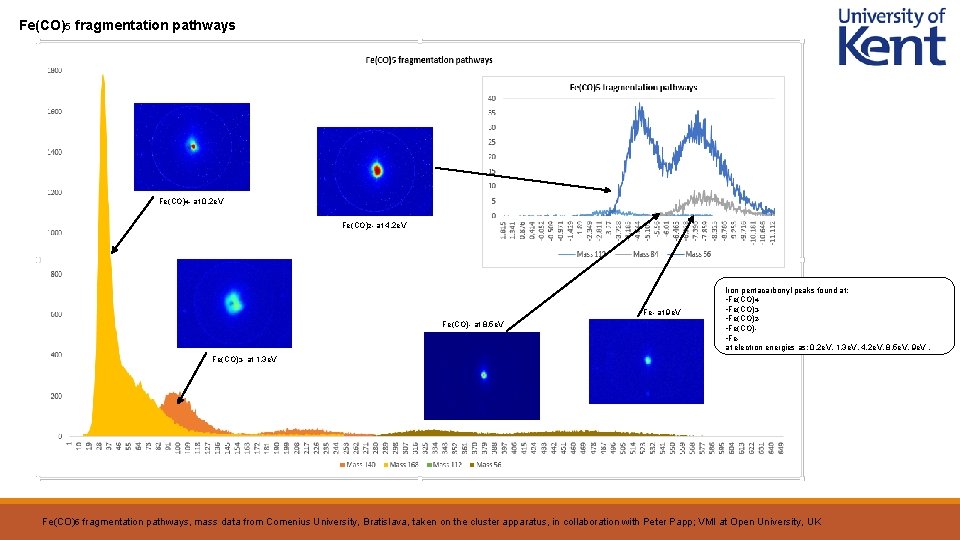
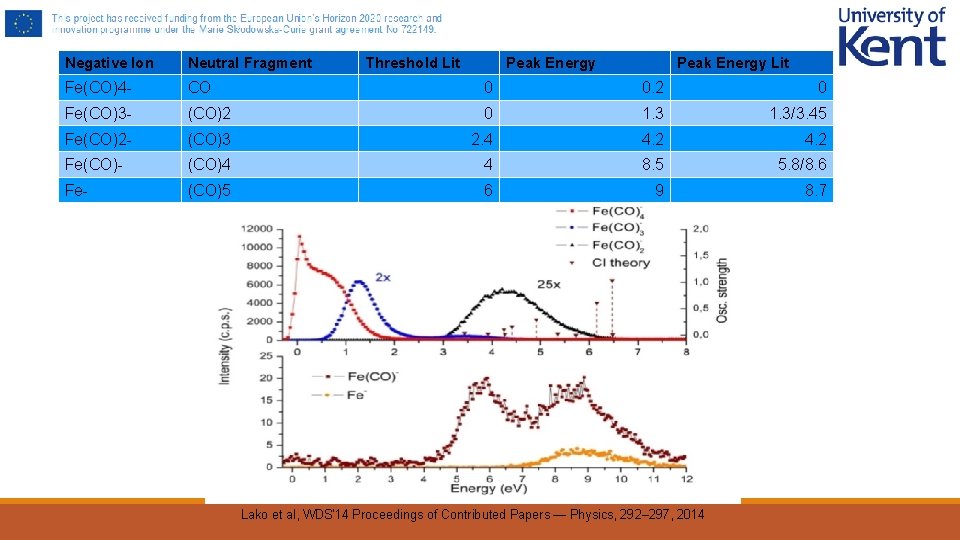
Fe(CO)5 fragmentation pathways Fe(CO)4 - at 0. 2 e. V Fe(CO)2 - at 4. 2 e. V Fe- at 9 e. V Fe(CO)- at 8. 5 e. V Iron pentacarbonyl peaks found at: • Fe(CO)4 • Fe(CO)3 • Fe(CO)2 • Fe(CO) • Feat electron energies as: 0. 2 e. V, 1. 3 e. V, 4. 2 e. V, 8. 5 e. V, 9 e. V. Fe(CO)3 - at 1. 3 e. V Fe(CO)5 fragmentation pathways, mass data from Comenius University, Bratislava, taken on the cluster apparatus, in collaboration with Peter Papp; VMI at Open University, UK
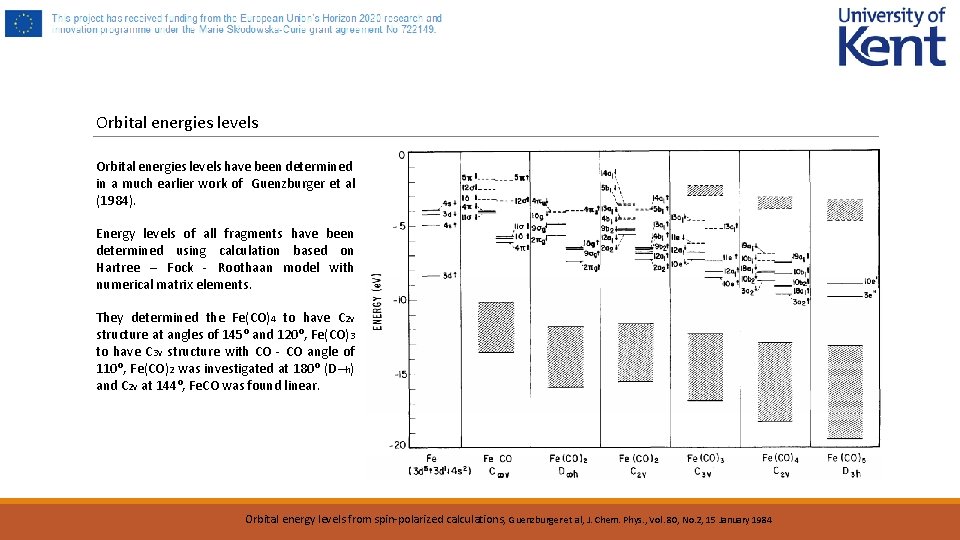
Orbital energies levels have been determined in a much earlier work of Guenzburger et al (1984). Energy levels of all fragments have been determined using calculation based on Hartree – Fock - Roothaan model with numerical matrix elements. They determined the Fe(CO)4 to have C 2 v structure at angles of 145⁰ and 120⁰, Fe(CO)3 to have C 3 v structure with CO - CO angle of 110⁰, Fe(CO)2 was investigated at 180⁰ (D∞h) and C 2 v at 144⁰, Fe. CO was found linear. Orbital energy levels from spin-polarized calculations, Guenzburger et al, J. Chem. Phys. , Vol. 80, No. 2, 15 January 1984
Negative Ion Neutral Fragment Threshold Lit Peak Energy Lit Fe(CO)4 - CO 0 0. 2 0 Fe(CO)3 - (CO)2 0 1. 3/3. 45 Fe(CO)2 - (CO)3 2. 4 4. 2 Fe(CO)- (CO)4 4 8. 5 5. 8/8. 6 Fe- (CO)5 6 9 8. 7 Lako et al, WDS'14 Proceedings of Contributed Papers — Physics, 292– 297, 2014
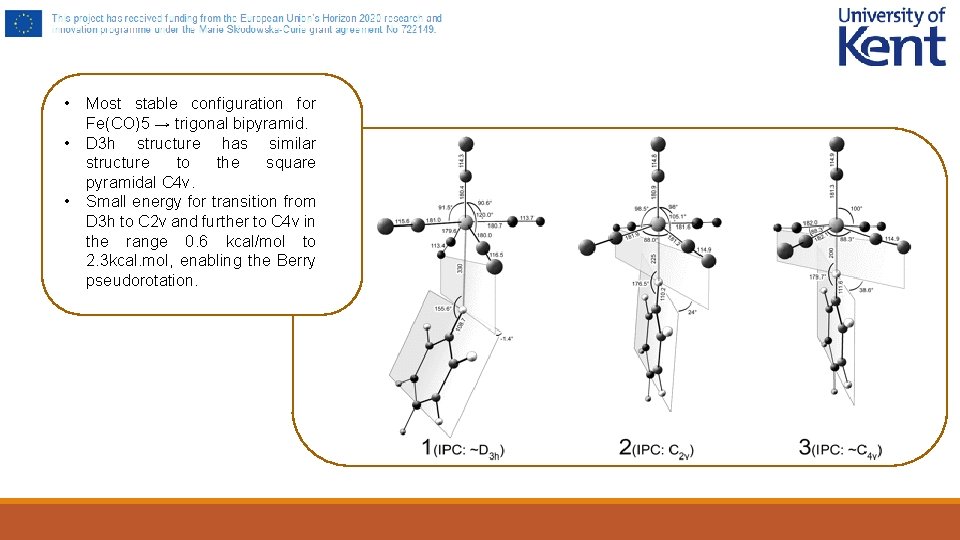
• Most stable configuration for Fe(CO)5 → trigonal bipyramid. • D 3 h structure has similar structure to the square pyramidal C 4 v. • Small energy for transition from D 3 h to C 2 v and further to C 4 v in the range 0. 6 kcal/mol to 2. 3 kcal. mol, enabling the Berry pseudorotation.
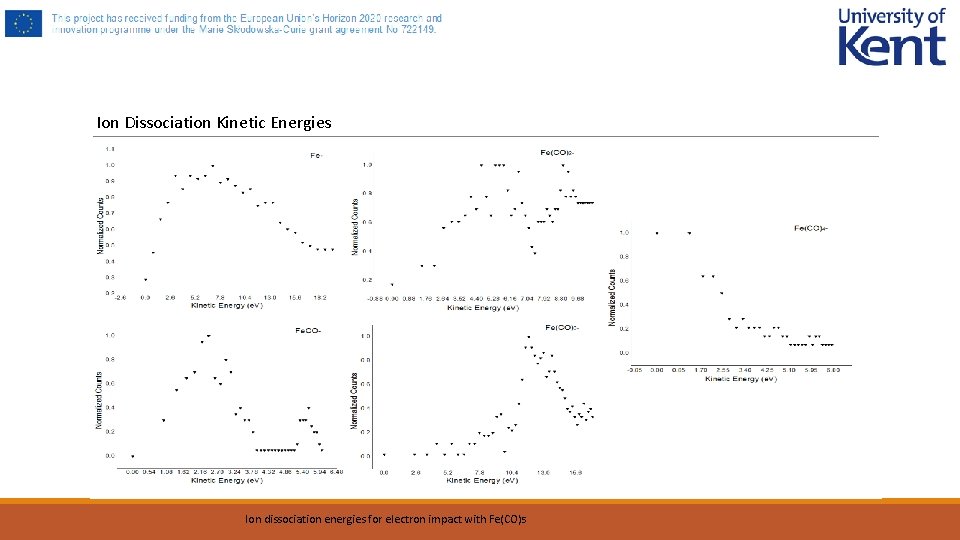
Ion Dissociation Kinetic Energies Ion dissociation energies for electron impact with Fe(CO) 5
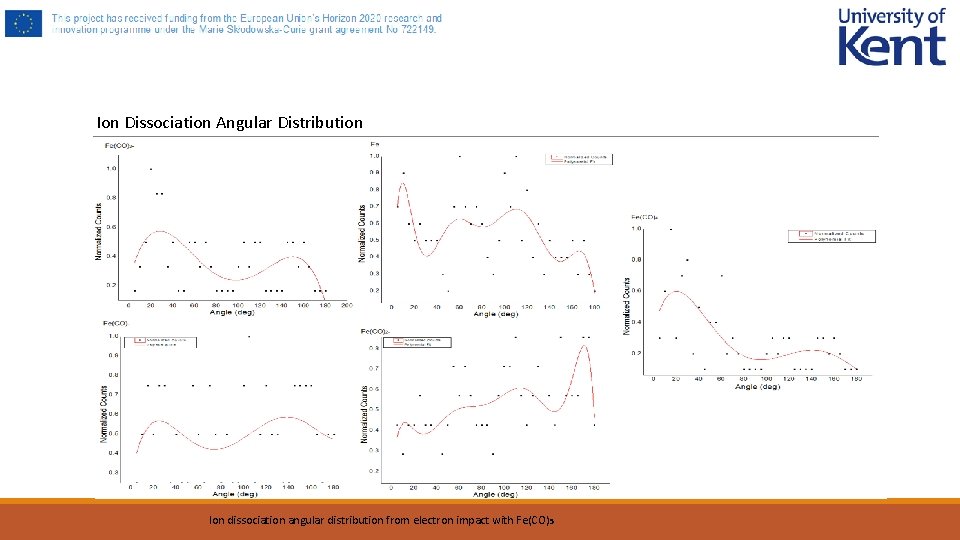
Ion Dissociation Angular Distribution Ion dissociation angular distribution from electron impact with Fe(CO)5
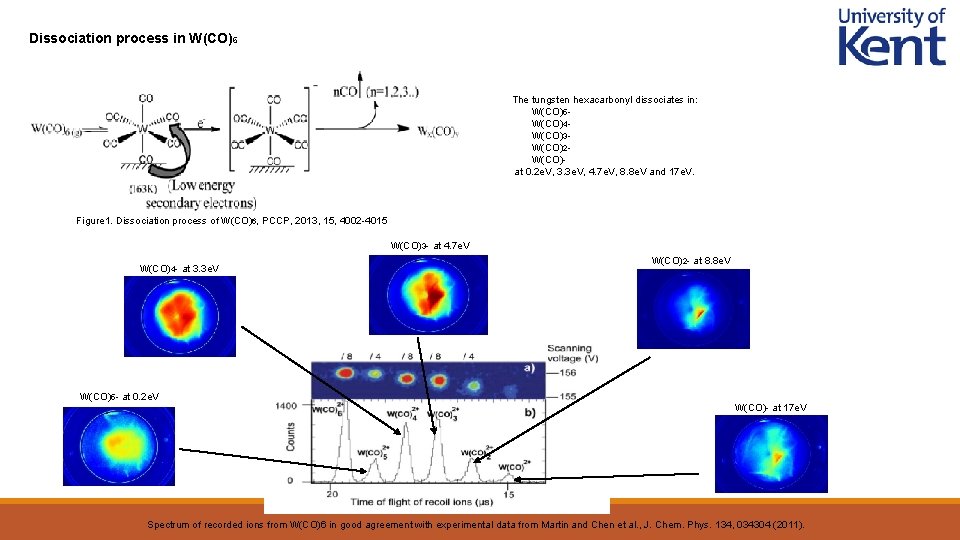
Dissociation process in W(CO)6 The tungsten hexacarbonyl dissociates in: • W(CO)5 • W(CO)4 • W(CO)3 • W(CO)2 • W(CO)at 0. 2 e. V, 3. 3 e. V, 4. 7 e. V, 8. 8 e. V and 17 e. V. Figure 1. Dissociation process of W(CO)6, PCCP, 2013, 15, 4002 -4015 W(CO)3 - at 4. 7 e. V W(CO)4 - at 3. 3 e. V W(CO)5 - at 0. 2 e. V W(CO)2 - at 8. 8 e. V W(CO)- at 17 e. V Spectrum of recorded ions from W(CO)6 in good agreement with experimental data from Martin and Chen et al. , J. Chem. Phys. 134, 034304 (2011).
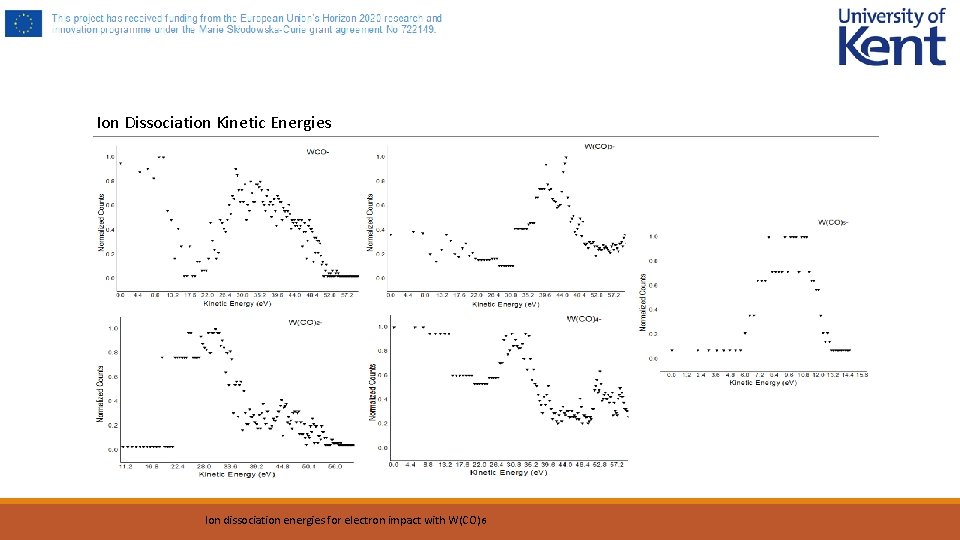
Ion Dissociation Kinetic Energies Ion dissociation energies for electron impact with W(CO) 6
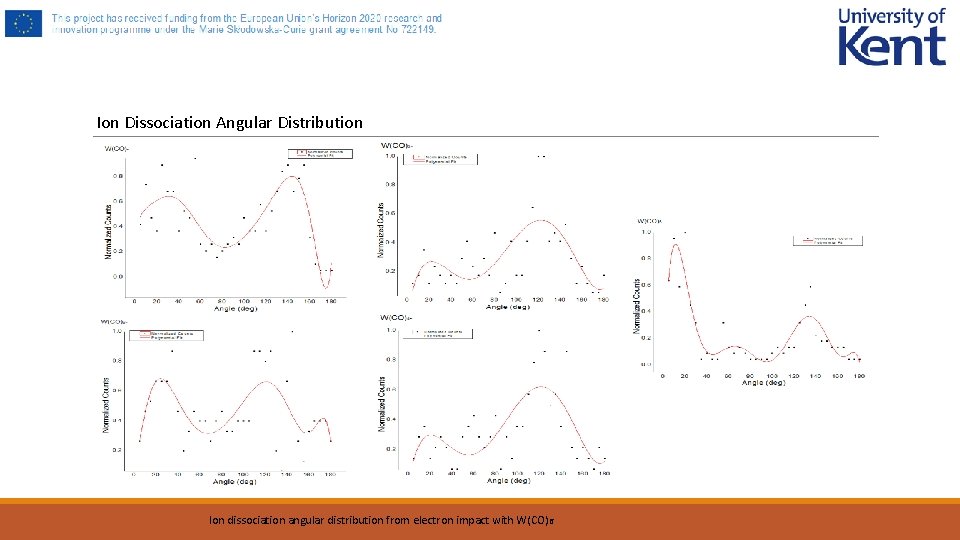
Ion Dissociation Angular Distribution Ion dissociation angular distribution from electron impact with W(CO)6
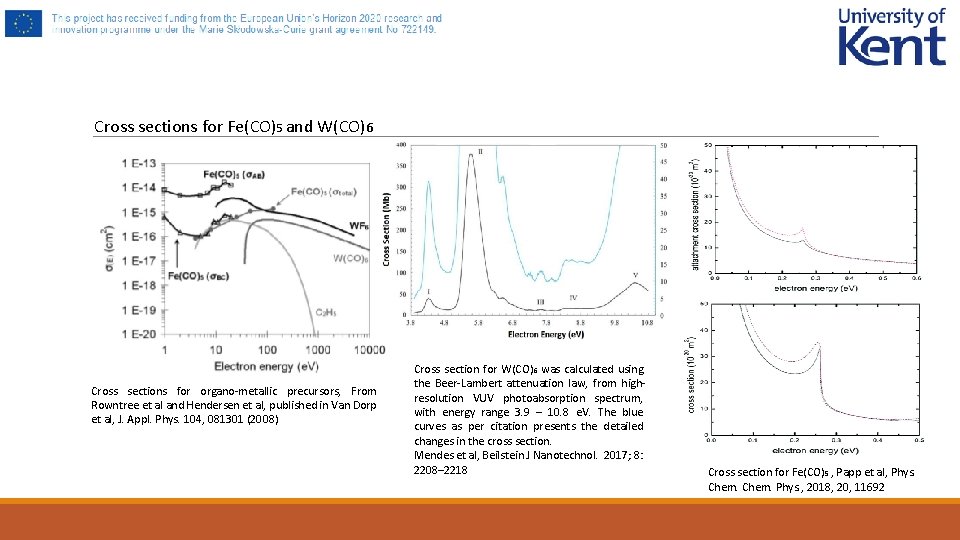
Cross sections for Fe(CO)5 and W(CO)6 Cross sections for organo-metallic precursors, From Rowntree et al and Hendersen et al, published in Van Dorp et al, J. Appl. Phys. 104, 081301 (2008) Cross section for W(CO)6 was calculated using the Beer-Lambert attenuation law, from highresolution VUV photoabsorption spectrum, with energy range 3. 9 – 10. 8 e. V. The blue curves as per citation presents the detailed changes in the cross section. Mendes et al, Beilstein J Nanotechnol. 2017; 8: 2208– 2218 Cross section for Fe(CO) 5 , Papp et al, Phys. Chem. Phys. , 2018, 20, 11692
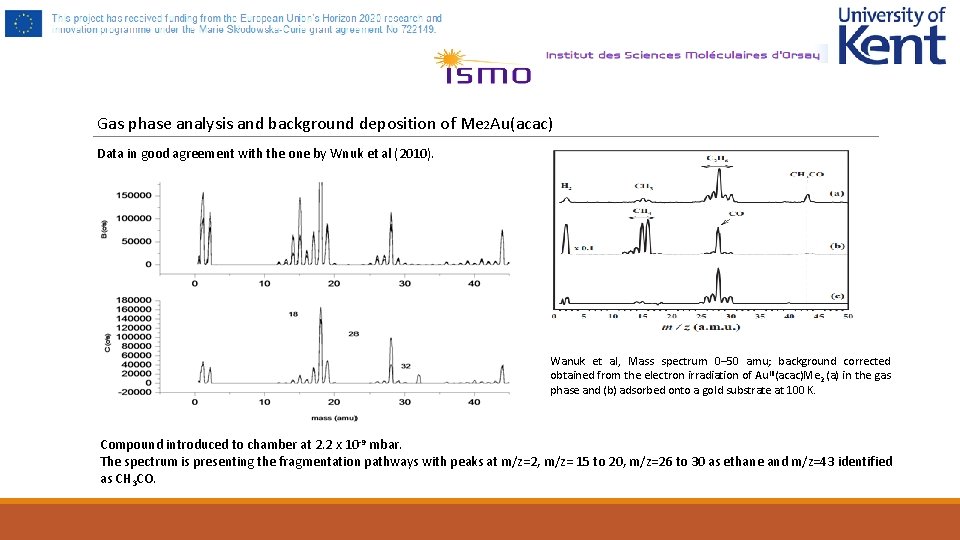
Gas phase analysis and background deposition of Me 2 Au(acac) Data in good agreement with the one by Wnuk et al (2010). Wanuk et al, Mass spectrum 0– 50 amu; background corrected obtained from the electron irradiation of Au. III(acac)Me 2 (a) in the gas phase and (b) adsorbed onto a gold substrate at 100 K. Compound introduced to chamber at 2. 2 x 10 -9 mbar. The spectrum is presenting the fragmentation pathways with peaks at m/z=2, m/z= 15 to 20, m/z=26 to 30 as ethane and m/z=43 identified as CH 3 CO.
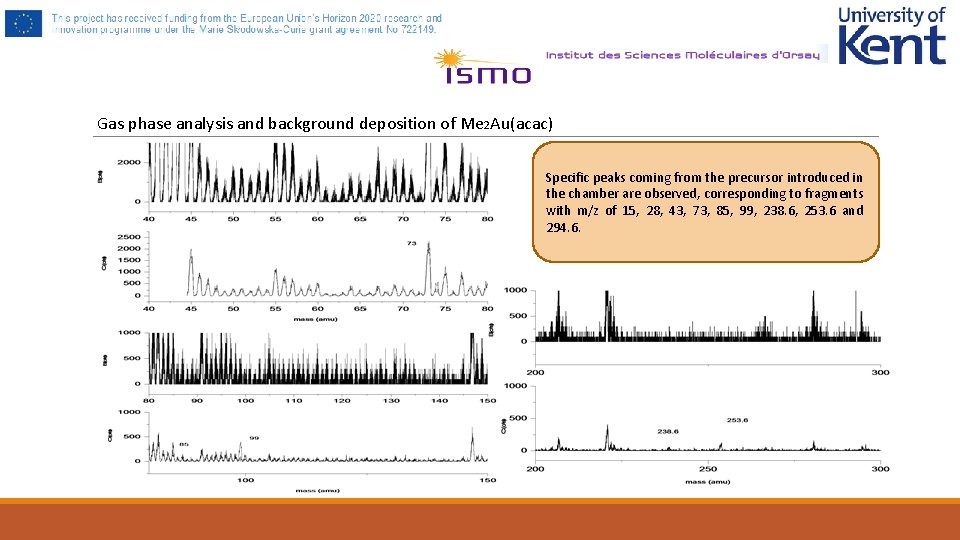
Gas phase analysis and background deposition of Me 2 Au(acac) Specific peaks coming from the precursor introduced in the chamber are observed, corresponding to fragments with m/z of 15, 28, 43, 73, 85, 99, 238. 6, 253. 6 and 294. 6.
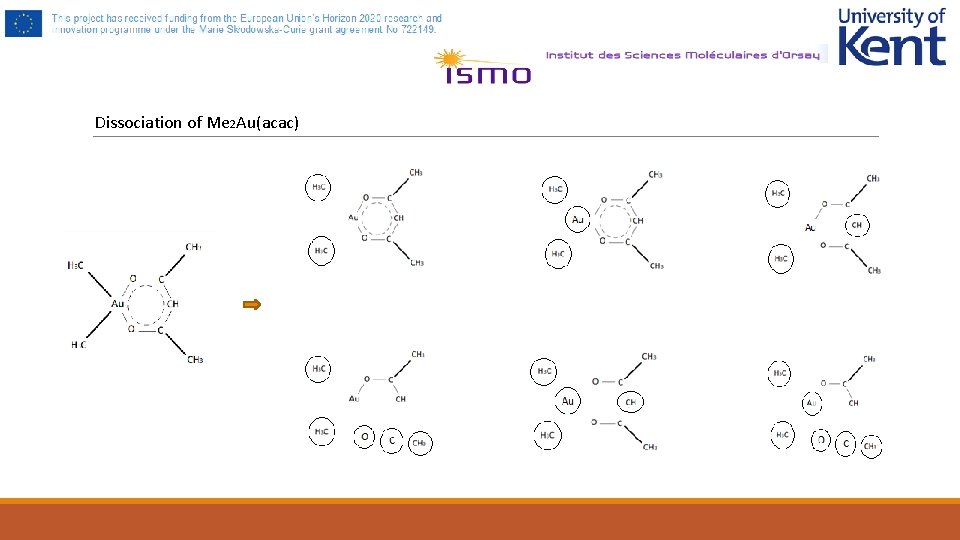
Dissociation of Me 2 Au(acac)
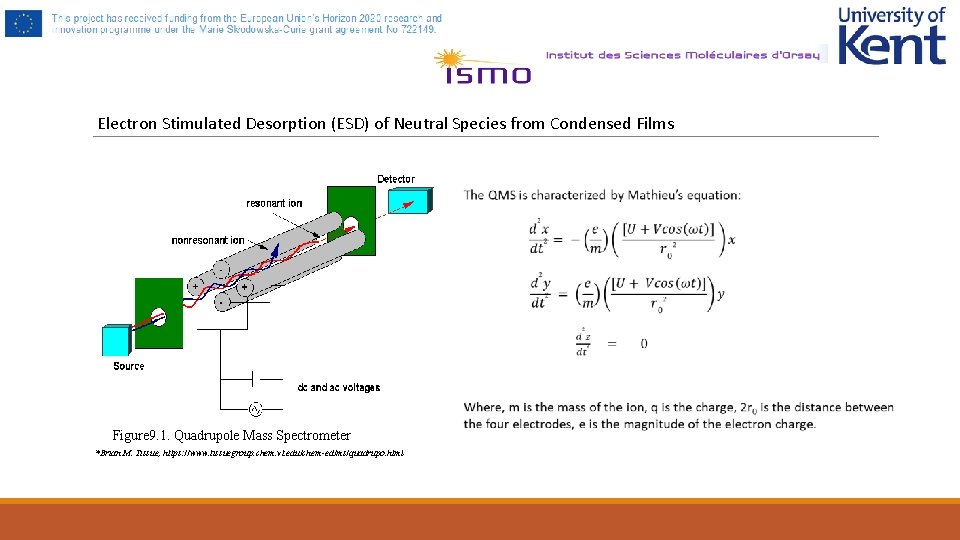
Electron Stimulated Desorption (ESD) of Neutral Species from Condensed Films Figure 9. 1. Quadrupole Mass Spectrometer *Brian M. Tissue, https: //www. tissuegroup. chem. vt. edu/chem-ed/ms/quadrupo. html
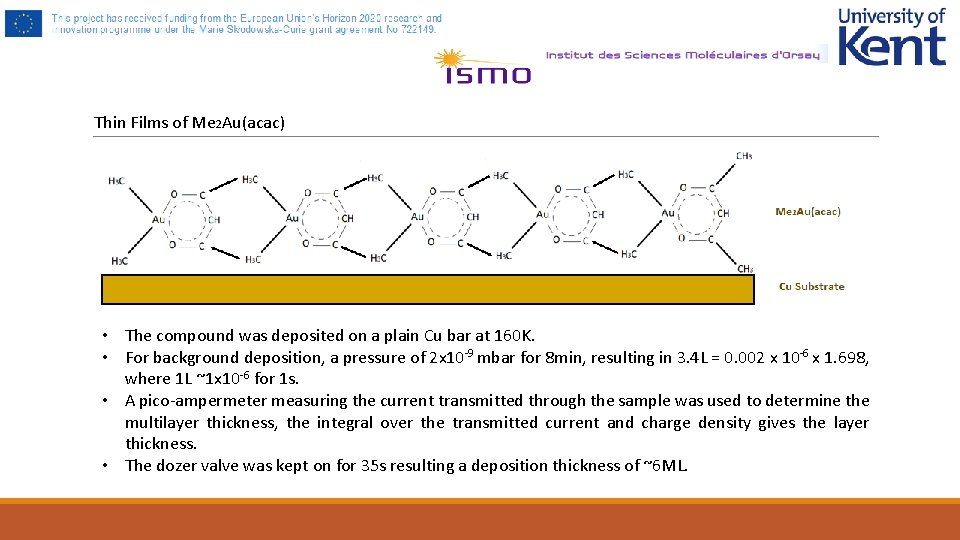
Thin Films of Me 2 Au(acac) • The compound was deposited on a plain Cu bar at 160 K. • For background deposition, a pressure of 2 x 10 -9 mbar for 8 min, resulting in 3. 4 L = 0. 002 x 10 -6 x 1. 698, where 1 L ~1 x 10 -6 for 1 s. • A pico-ampermeter measuring the current transmitted through the sample was used to determine the multilayer thickness, the integral over the transmitted current and charge density gives the layer thickness. • The dozer valve was kept on for 35 s resulting a deposition thickness of ~6 ML.
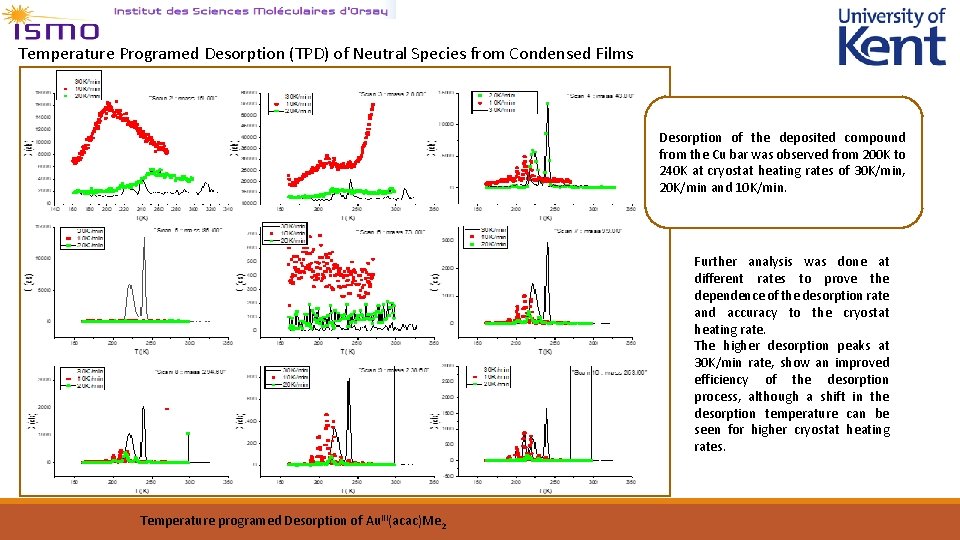
Temperature Programed Desorption (TPD) of Neutral Species from Condensed Films Desorption of the deposited compound from the Cu bar was observed from 200 K to 240 K at cryostat heating rates of 30 K/min, 20 K/min and 10 K/min. Further analysis was done at different rates to prove the dependence of the desorption rate and accuracy to the cryostat heating rate. The higher desorption peaks at 30 K/min rate, show an improved efficiency of the desorption process, although a shift in the desorption temperature can be seen for higher cryostat heating rates. Temperature programed Desorption of Au. III(acac)Me 2
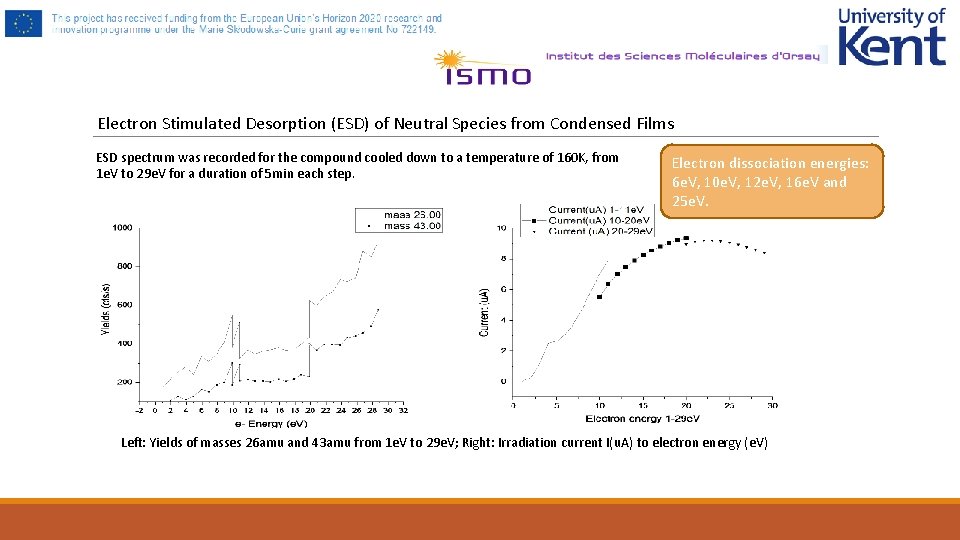
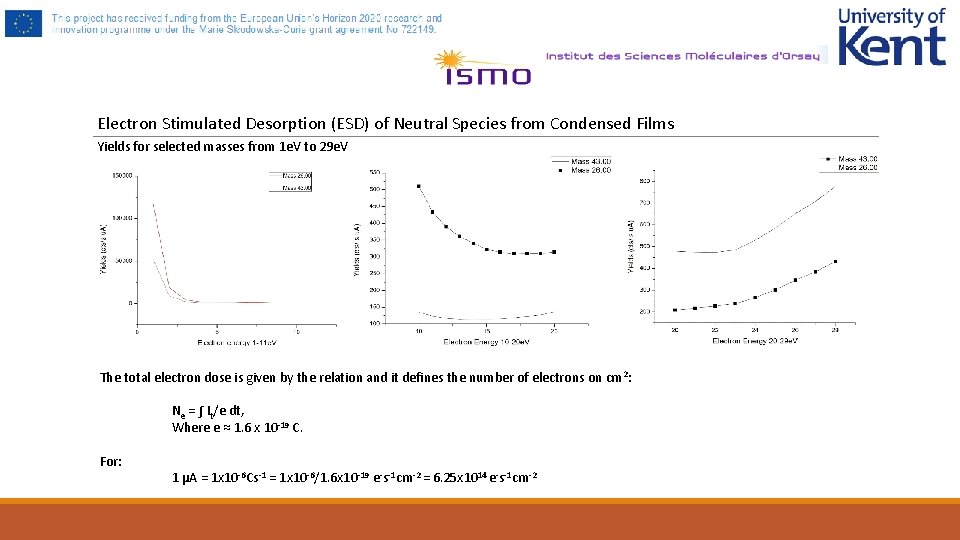
Electron Stimulated Desorption (ESD) of Neutral Species from Condensed Films ESD spectrum was recorded for the compound cooled down to a temperature of 160 K, from 1 e. V to 29 e. V for a duration of 5 min each step. Electron dissociation energies: 6 e. V, 10 e. V, 12 e. V, 16 e. V and 25 e. V. Left: Yields of masses 26 amu and 43 amu from 1 e. V to 29 e. V; Right: Irradiation current I(u. A) to electron energy (e. V)
Electron Stimulated Desorption (ESD) of Neutral Species from Condensed Films Yields for selected masses from 1 e. V to 29 e. V The total electron dose is given by the relation and it defines the number of electrons on cm 2: Ne = ∫ It/e dt, Where e ≈ 1. 6 x 10 -19 C. For: 1 µA = 1 x 10 -6 Cs-1 = 1 x 10 -6/1. 6 x 10 -19 e-s-1 cm-2 = 6. 25 x 1014 e-s-1 cm-2
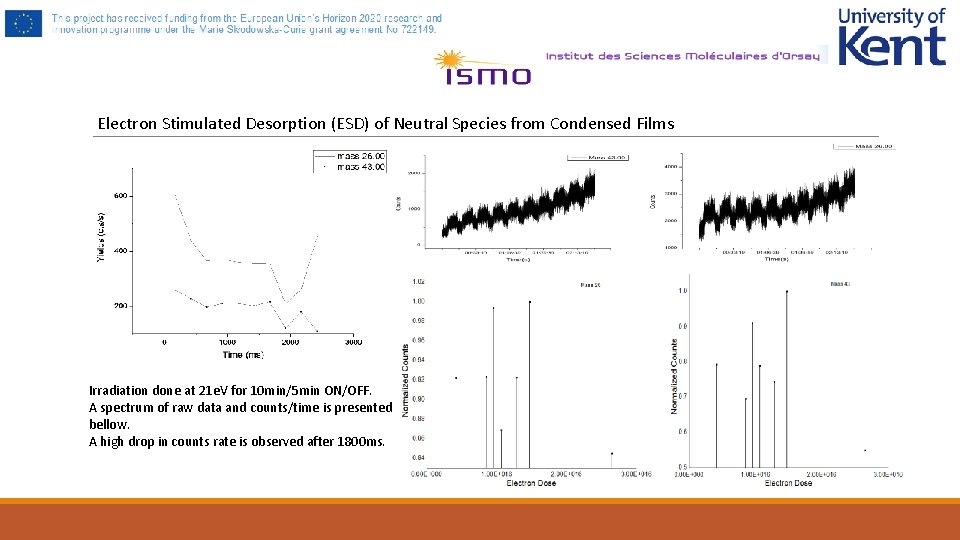
Electron Stimulated Desorption (ESD) of Neutral Species from Condensed Films Irradiation done at 21 e. V for 10 min/5 min ON/OFF. A spectrum of raw data and counts/time is presented bellow. A high drop in counts rate is observed after 1800 ms.