Inequality Capitalism in the LongRun Thomas Piketty Paris


,")


- Slides: 36
Inequality & Capitalism in the Long-Run Thomas Piketty Paris School of Economics HONG KONG, October 18 th 2013
• This lecture is based upon Capital in the 21 st century (Harvard Univ. Press, March 2014) • This book studies the global dynamics of income and wealth distribution since 18 c; it uses historical data collected over the past 15 years together with Atkinson, Saez, Postel-Vinay, Rosenthal, Alvaredo, Zucman, and 20+ others. • The book includes four parts: Part 1. Income and capital Part 2. The dynamics of the capital/income ratio Part 3. The structure of inequalities Part 4. Regulating capital in the 21 st century • In this lecture I will present some results from Parts 2 & 3, focusing upon the long-run evolution of capital/income ratios and wealth concentration (all graphs and series are available on line: see http: //piketty. pse. ens. fr/capital 21 c )
This lecture: three points • 1. The return of capital in the Old World (Europe, Japan). Wealth-income ratios are returning to high levels in low growth countries: β=s/g ↑ as g ↓ • 2. The future of wealth concentration: with high r-g (r = net-of-tax rate of return, g = growth rate), inequality might reach or surpass 19 c record levels • 3. Inequality in America: is the New World developing a new inequality model that is even more extreme than the Old World model? Or is it more merit-based?
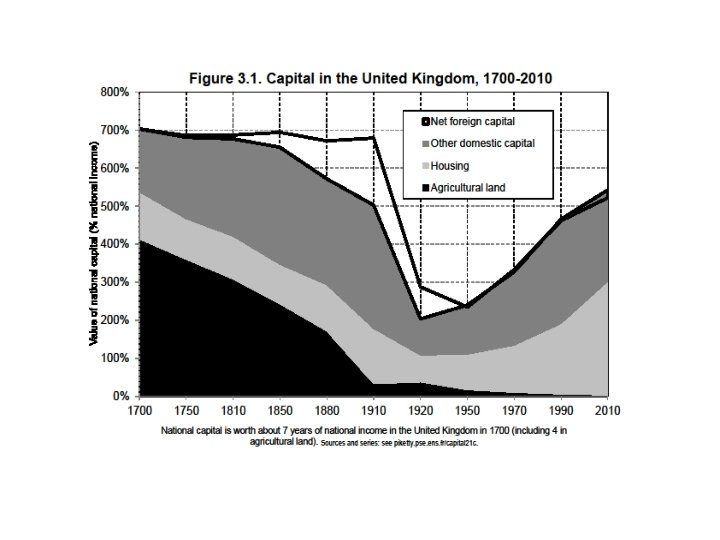
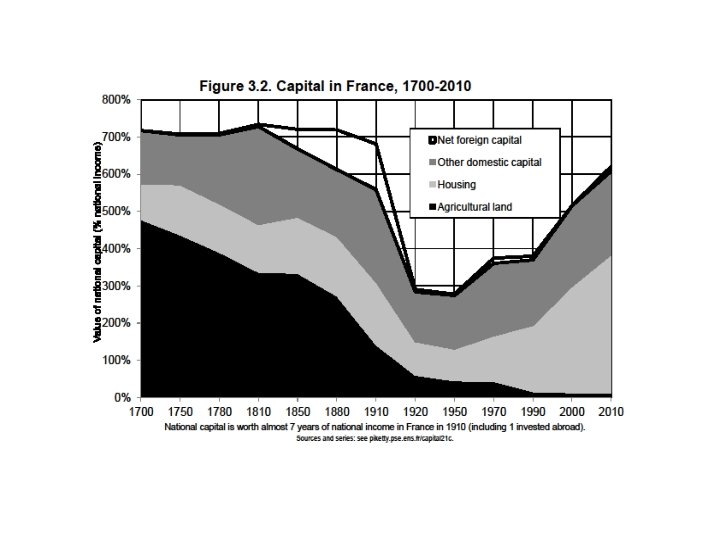
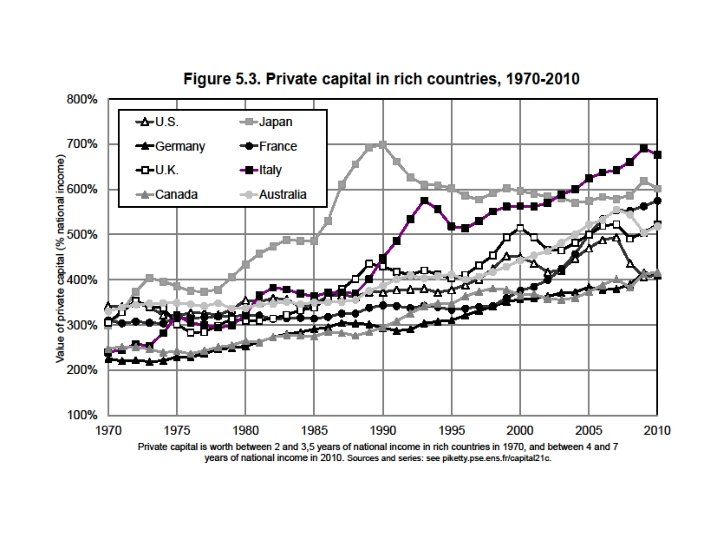
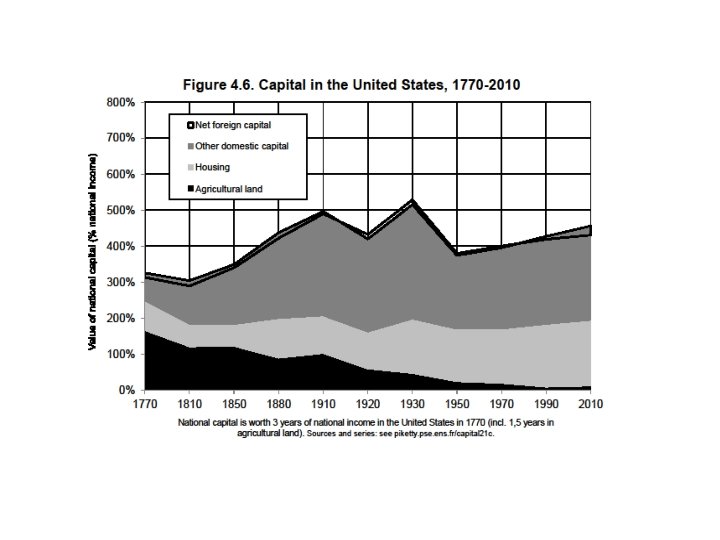
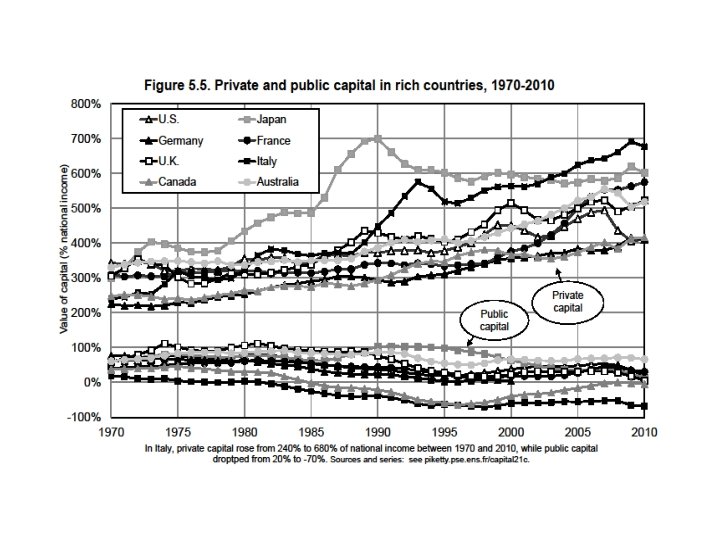
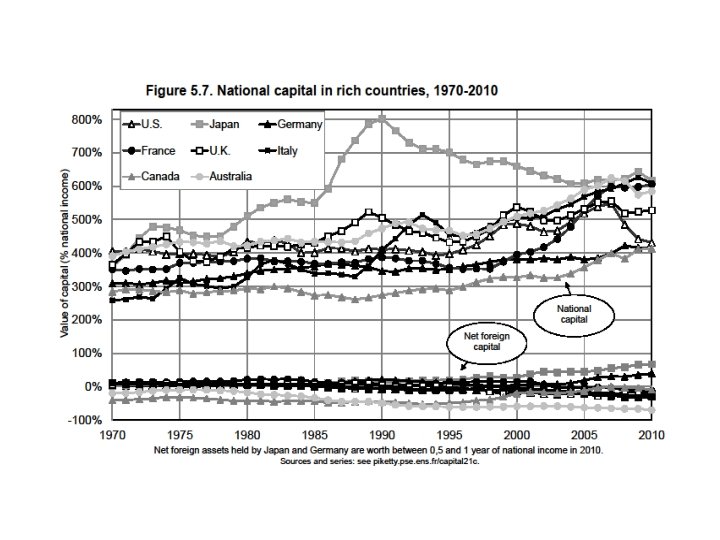
1. The return of capital • In textbooks, wealth-income & capital-ouput ratios are supposed to be constant. But the so-called « Kaldor facts » actually rely on little historical evidence. • In fact, we observe in Europe & Japan a large recovery of β=K/Y in recent decades: β=200 -300% in 1950 -60 s → β=500 -600% in 2000 -10 s Are we heading back to the β=600 -700% observed in 18 c-19 c? • With a flexible production function Y=F(K, L), any K/Y ratio can be a steady-state (there is no reason for β to be constant)
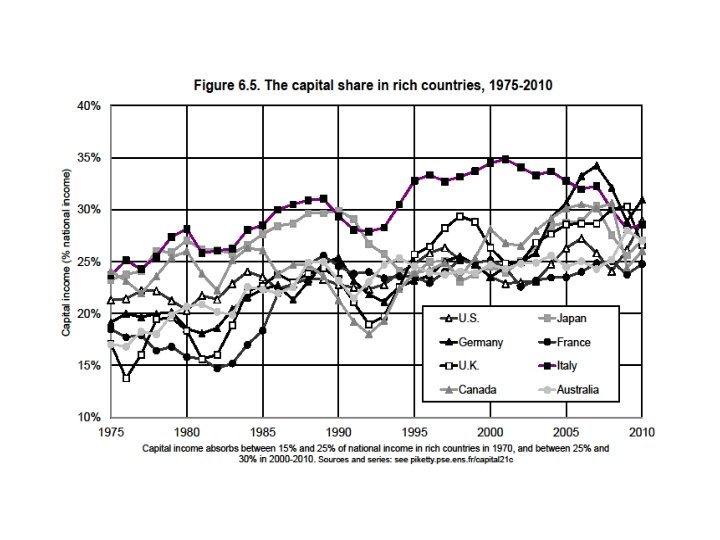
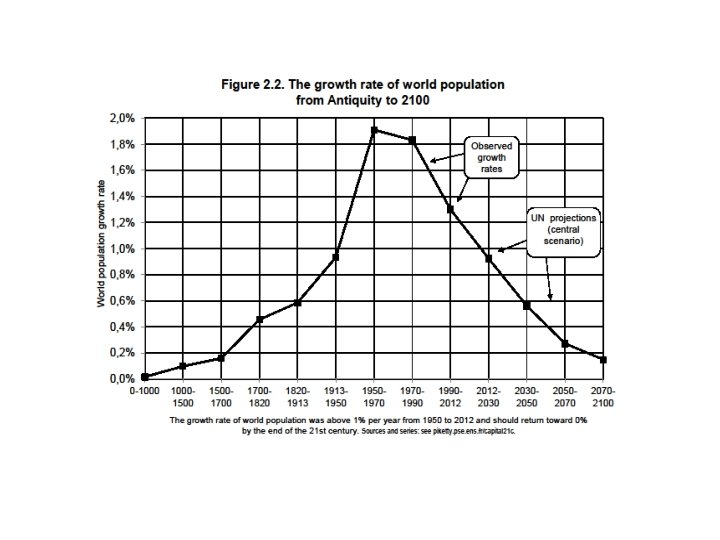
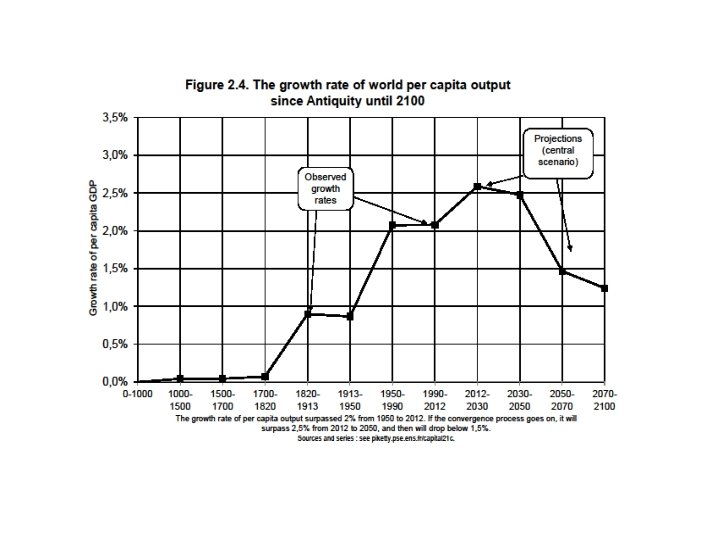
• The simplest way to think about this is the following: in the long-run, β=s/g with s = (net-of-depreciation) saving rate & g = economy’s growth rate (population + productivity) • With s=10%, g=3%, β≈300%; but if s=10%, g=1, 5%, β≈600% → capital is back because low growth is back (pop. growth↓ 0) Note: β=s/g = true whatever the combination of saving motives • Whether a rise in β also leads to a rise in capital share α = r β depends on the K-L elasticity of substitution: if σ>1, then r=FK declines proportionally less than β↑, so that α = r β rises = exactly what happened since 1970 s-80 s ; could continue • With a large rise in β, one can get large rise in α with F(K, L) that is just a little bit more substituable than Cobb-Douglas • Maybe σ↑ over devt process: more diversified uses for capital
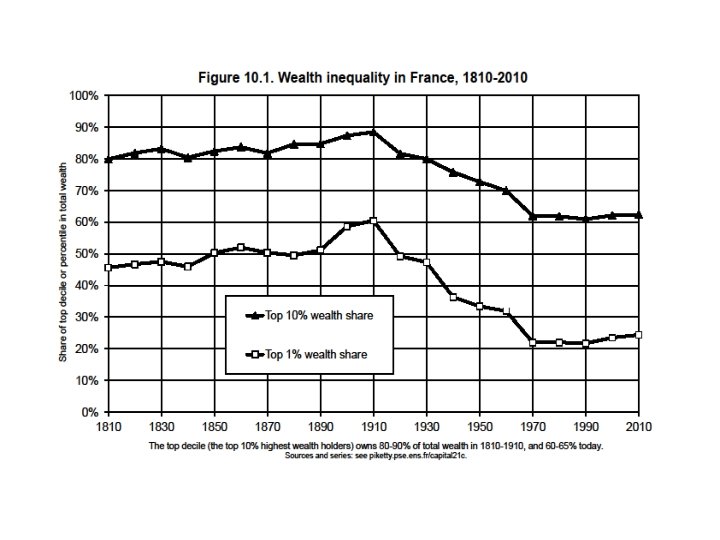
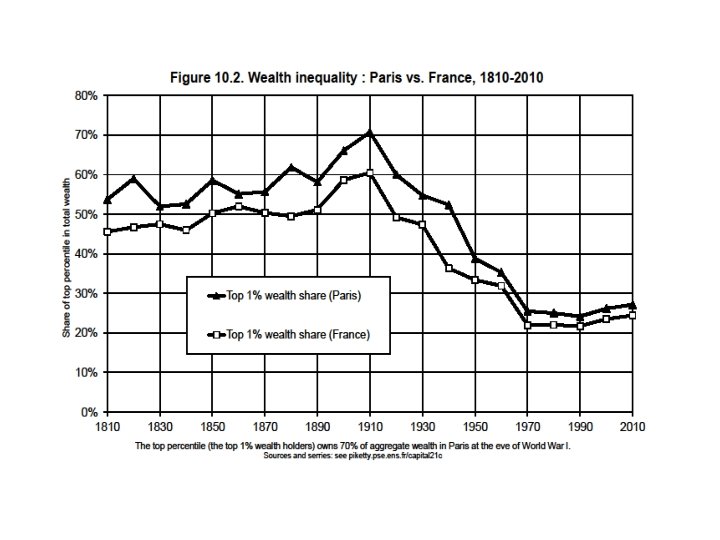
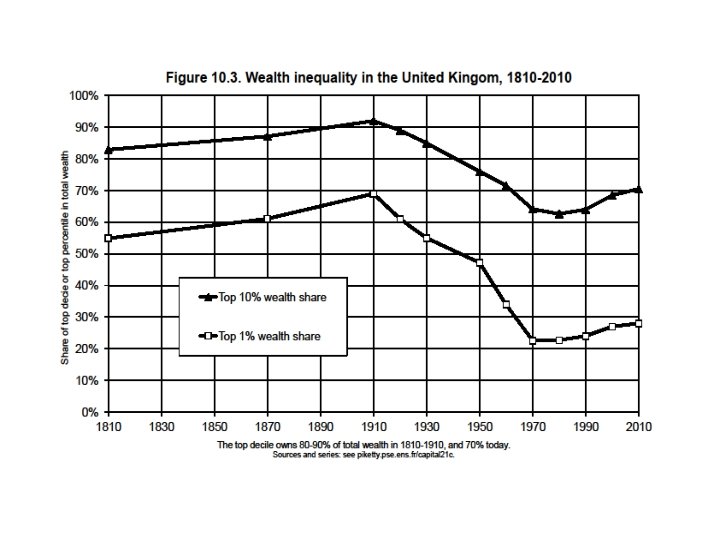
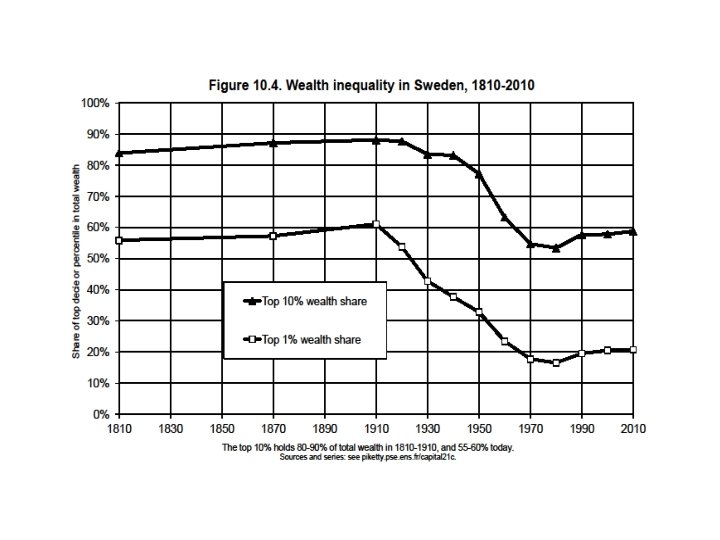
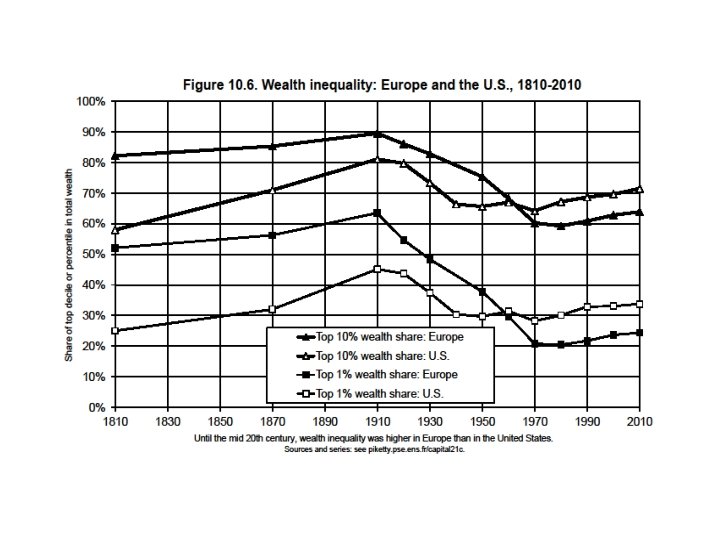
2. The future of wealth concentration • In all European countries (UK, France, Sweden…), wealth concentration was extremely high in 18 c-19 c & until WW 1: 80 -90% of aggregate wealth for top 10% wealth holders 50 -60% of aggregate wealth for top 1% wealth-holders • Today wealth concentration is still very high, but less extreme: about 60 -70% for top 10%; about 20 -30% for top 1% the bottom 50% still owns nothing (<5%) but the middle 40% now owns 20 -30% of aggregate wealth = the rise of the middle class • How did it happen, and will it last?
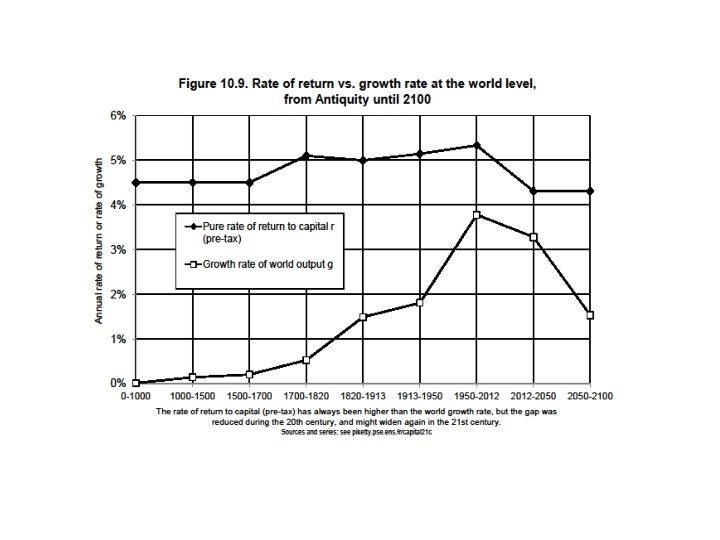
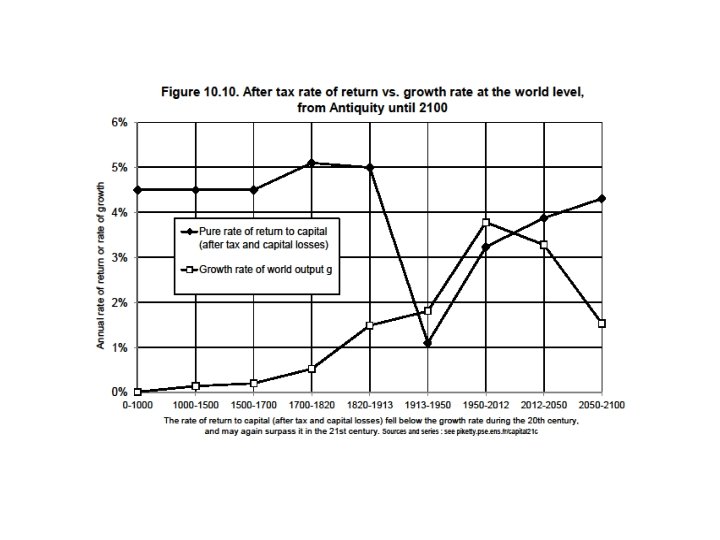
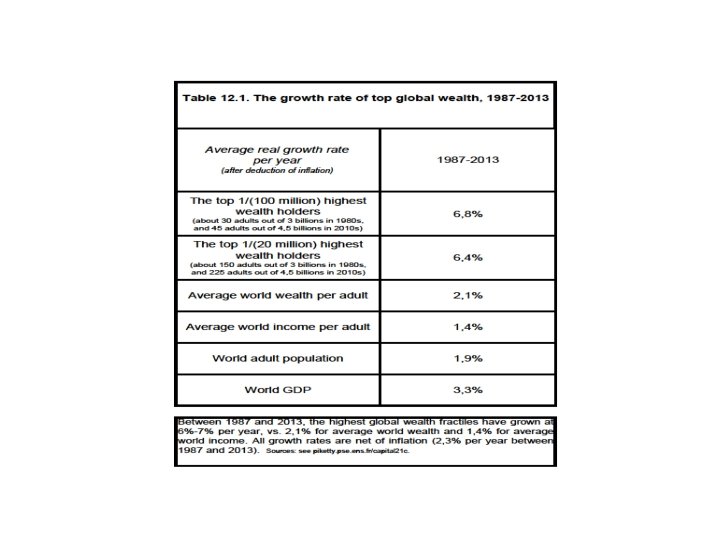
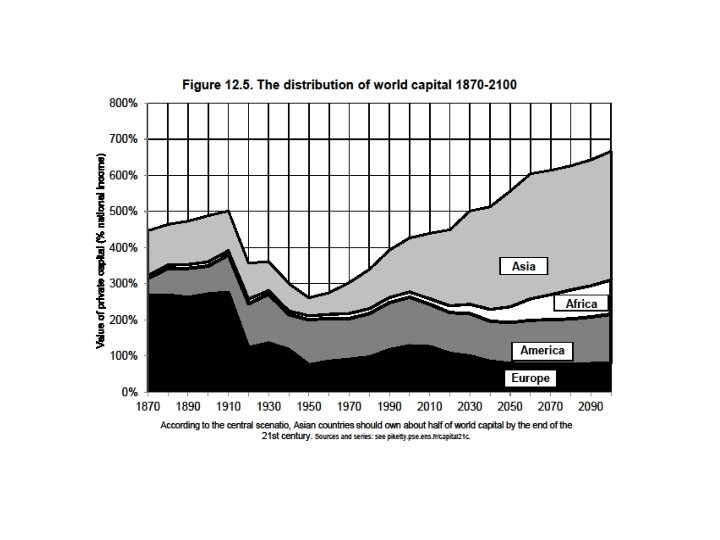
• Key finding: there was no decline in wealth concentration prior to World War shocks; was it just due to shocks? • Q. : Apart from shocks, what forces determine the long-run level of wealth concentration? • A. : In any dynamic, multiplicative wealth accumulation model with random individual shocks (tastes, demographic, returns, wages, . . ), the steady-state level of wealth concentration is an increasing function of r - g (with r = net-of-tax rate of return and g = growth rate) • With growth slowdown and rising tax competition to attract capital, r - g might well rise in the 21 c → back to 19 c levels • Future values of r also depend on technology (σ>1? ) • Under plausible assumptions, wealth concentration might reach or surpass 19 c record levels: see global wealth rankings
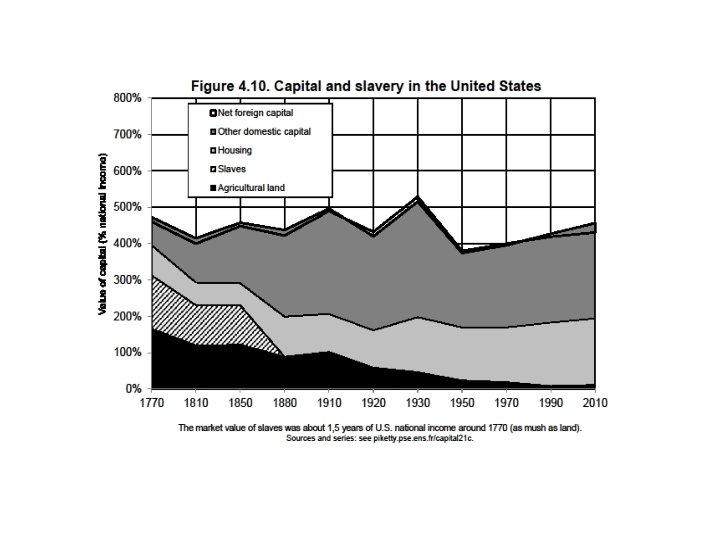
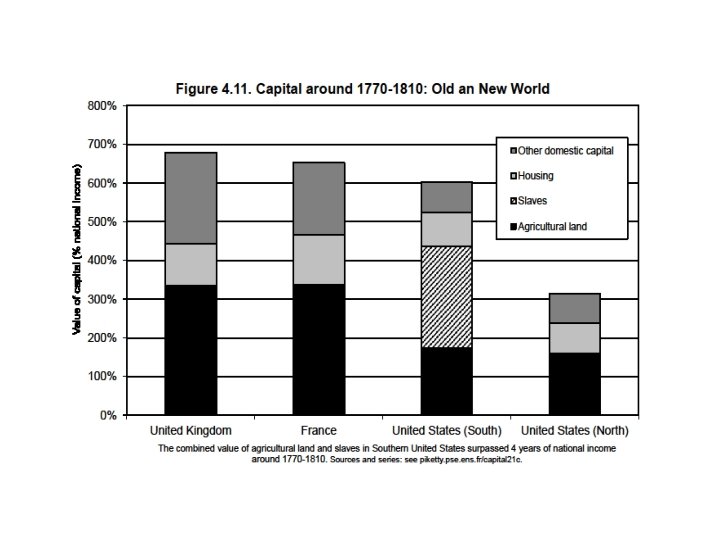
3. Inequality in America • Inequality in America = a different structure as in Europe: more egalitarian in some ways, more inegalitarian in some other dimensions • The New World in the 19 th century: the land of opportunity (capital accumulated in the past mattered much less than in Europe; perpetual demographic growth as a way to reduce the level of inherited wealth and wealth concentration)… and the land of slavery • Northern US were in many ways more egalitarian than Old Europe; but Southern US were more inegalitarian • We still have the same ambiguous relationship of America with inequality today: in some ways more merit-based; in other ways more violent (prisons)
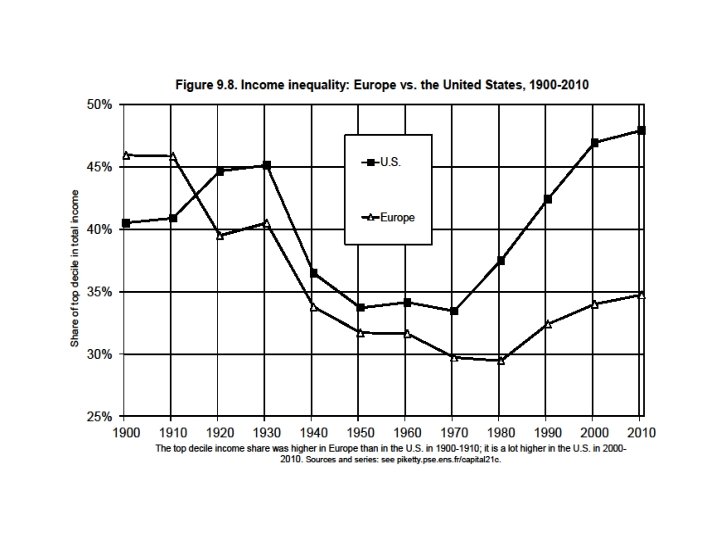
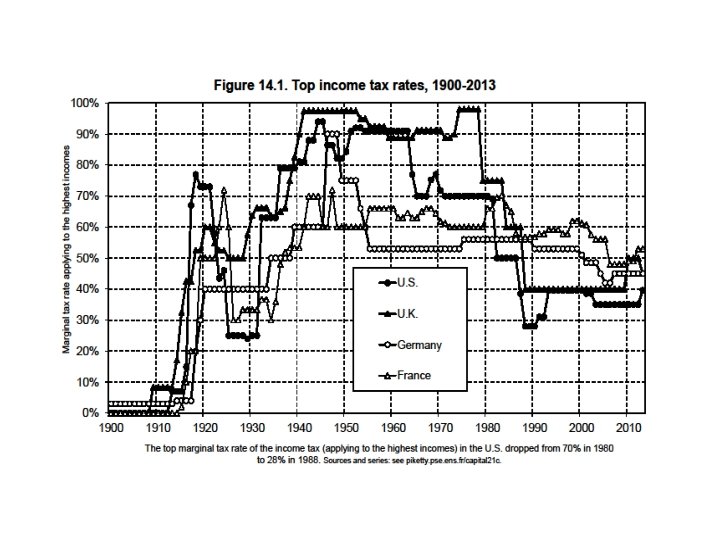
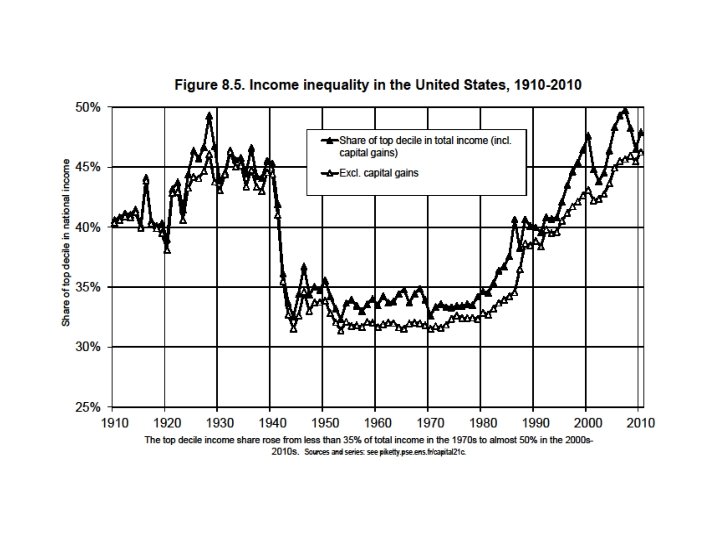
• The US distribution of income has become more unequal than in Europe over the course of the 20 th century; it is now as unequal as pre-WW 1 Europe • But the structure of inequality is different: US 2013 has less wealth inequality than Europe 1913, but higher inequality of labor income; in the US, this is sometime described as more merit-based: the rise of top labor incomes makes it possible to become rich with no inheritance (≈Napoleonic prefets) • Pb = this can be the worst of all worlds for those who are neither top income earners nor top successors: they are poor, and they are depicted as dump & undeserving (at least, nobody was trying to depict Ancien Regime inequality as fair) • Unclear whether rise of top incomes has a lot to do with merit or productivity: sharp decline in top tax rates & rise of CEO bargaining power are more convincing explanations
Conclusions • The history of income and wealth inequality is always political, chaotic and unpredictable; it involves national identities and sharp reversals; nobody can predict the reversals of the future • Marx: with g=0, β↑∞, r→ 0 : revolution, war • My conclusions are less apocalyptic: with g>0, at least we have a steady-state β=s/g • But with g>0 & small, this steady-state can be rather gloomy: it can involve a very large capital-income ratio β and capital share α, as well as extreme wealth concentration due to high r-g • This has nothing to do with a market imperfection: the more perfect the capital market, the higher r-g • The ideal solution: progressive wealth tax at the global scale, based upon automatic exchange of bank information • Other solutions involve political & capital controls (China, Russia. . ) or perpetual population growth (US) or some mixture of all
Supplementary slides