IACS Capstone Project Course Pavlos Protopapas Spring 2017



- Slides: 19
IACS Capstone Project Course Pavlos Protopapas - Spring 2017 AC 297 r http: //iacs. seas. harvard. edu/capstone https: //canvas. harvard. edu/courses/20897
What is the course about Work as a team Integrate knowledge acquired in other courses Apply skills and ideas in computational and data science such as data management, machine learning, statistics, and visualization. Learn new skills Solve complex real-world problems working across knowledge domains and applying cutting-edge tools and methods incorporating critical thinking. Practice professional skills while working on a substantial and challenging project with your partner organization, company, or research lab
The essence The course is not about doing what Pavlos (or your TF) wants you to do We will grade you on: 1. How you collaborate with others in conducting research or applied science 2. How you acquire, organize and process data 3. How you create and outline solutions using statistics, machine learning and mathematical modeling 4. How you implement those solutions: quality of the implementation 5. How you test your hypothesis and assumptions 6. How you communicate and defend your work 1. Very important: Creative, exciting ideas with rigor and depth
Feedback Teaching staff are here to: Guide you Provide additional ideas Brainstorm ideas Direct you to resources Teach you via mini-presentations and tutorials Challenge you This feedback is very important but AGAIN your job is not to execute our ideas
Feedback TFs Teaching Fellows: Reinier Maat, maat@g. harvard. edu Isaac Slavitt, isaac. slavitt@gmail. com Teresa Ruiz, truiz@seas. harvard. edu Patrick Ohiomaba, ohiomoba@gmail. com Wasay Abdul, awasay@g. harvard. edu Daniele Foresti, dforesti@seas. harvard. edu Matt Holman, mholman@cfa. harvard. edu Eleni Kaxiras, eleni@seas. harvard. edu [Niv Dayan, dayan@g. harvard. edu] [Orit Peleg, dayan@g. harvard. edu]
Partners 1. Moleskine 2. Como, a city and county in Lombardy, Italy 3. Biogen 4. Spotify 5. Tribe Dynamics 6. Trip. Advisor 7. Legendary Entertainment, makers of Jurassic World and The Dark Knight 8. Clinical Data Science Center at Mass General Hospital (MGH) 9. MBTA - Mass Bay Transportation Authority 10. Harvard School of Public Health
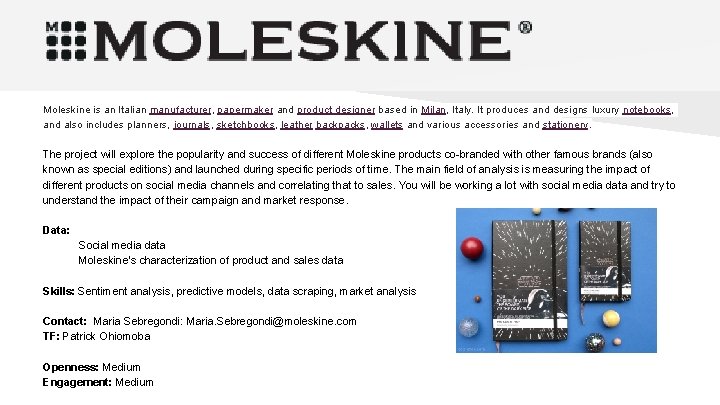
Moleskine is an Italian manufacturer, papermaker and product designer based in Milan, Italy. It produces and designs luxury notebooks, and also includes planners, journals, sketchbooks, leather backpacks, wallets and various accessories and stationery. The project will explore the popularity and success of different Moleskine products co-branded with other famous brands (also known as special editions) and launched during specific periods of time. The main field of analysis is measuring the impact of different products on social media channels and correlating that to sales. You will be working a lot with social media data and try to understand the impact of their campaign and market response. Data: Social media data Moleskine’s characterization of product and sales data Skills: Sentiment analysis, predictive models, data scraping, market analysis Contact: Maria Sebregondi: Maria. Sebregondi@moleskine. com TF: Patrick Ohiomoba Openness: Medium Engagement: Medium
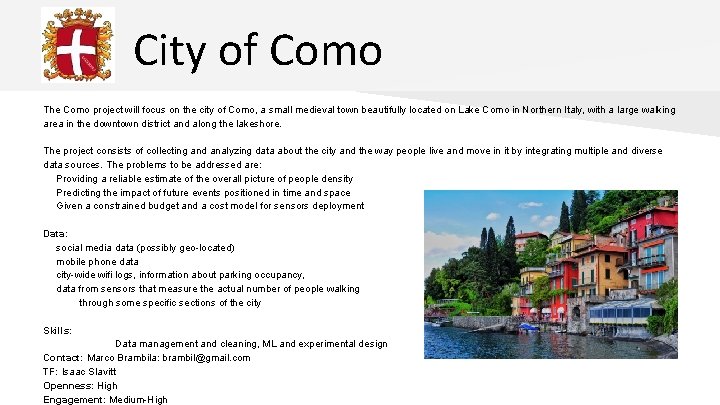
City of Como The Como project will focus on the city of Como, a small medieval town beautifully located on Lake Como in Northern Italy, with a large walking area in the downtown district and along the lakeshore. The project consists of collecting and analyzing data about the city and the way people live and move in it by integrating multiple and diverse data sources. The problems to be addressed are: Providing a reliable estimate of the overall picture of people density Predicting the impact of future events positioned in time and space Given a constrained budget and a cost model for sensors deployment Data: social media data (possibly geo-located) mobile phone data city-wide wifi logs, information about parking occupancy, data from sensors that measure the actual number of people walking through some specific sections of the city Skills: Data management and cleaning, ML and experimental design Contact: Marco Brambila: brambil@gmail. com TF: Isaac Slavitt Openness: High Engagement: Medium-High
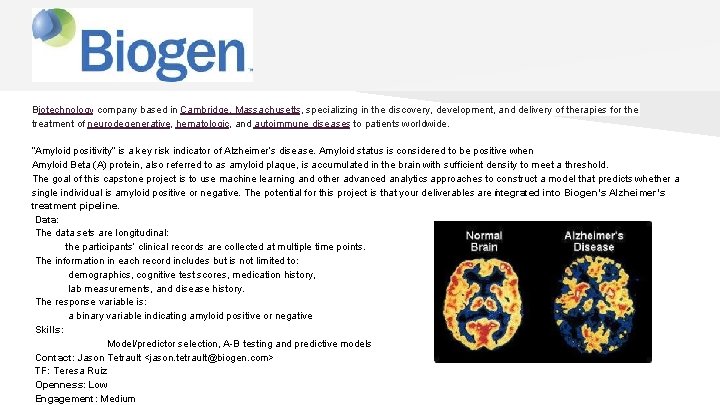
Biotechnology company based in Cambridge, Massachusetts, specializing in the discovery, development, and delivery of therapies for the treatment of neurodegenerative, hematologic, and autoimmune diseases to patients worldwide. “Amyloid positivity” is a key risk indicator of Alzheimer’s disease. Amyloid status is considered to be positive when Amyloid Beta (A) protein, also referred to as amyloid plaque, is accumulated in the brain with sufficient density to meet a threshold. The goal of this capstone project is to use machine learning and other advanced analytics approaches to construct a model that predicts whether a single individual is amyloid positive or negative. The potential for this project is that your deliverables are integrated into Biogen’s Alzheimer’s treatment pipeline. Data: The data sets are longitudinal: the participants’ clinical records are collected at multiple time points. The information in each record includes but is not limited to: demographics, cognitive test scores, medication history, lab measurements, and disease history. The response variable is: a binary variable indicating amyloid positive or negative Skills: Model/predictor selection, A-B testing and predictive models Contact: Jason Tetrault <jason. tetrault@biogen. com> TF: Teresa Ruiz Openness: Low Engagement: Medium
Spotify is a music, podcast, and video streaming service. It provides digital rights management-protected content from record labels and media companies. Spotify is a freemium service, meaning that basic services are free with advertisements, with additional features, such as improved streaming quality, offered via paid subscriptions. Using the audio attributes, build a model(s) to predict the genre of any given track. Build a system that retrieves all tracks that best fulfill an arbitrary combination of genres. For example “folk indie rock” should return tracks that best represent the combination of those genres. Base on the user’s preference suggest another track that is acoustically similar. Data: Million Song Dataset (MSD), MSD Publication Skills: Signal processing, time series analysis, predictive models and times series database TF: Reinier Maat Contact: Aparna Kumar aparna@spotify. com Openness: High Engagement: Medium
Legendary Pictures is an American media company based in Burbank, California. The company co-produce and co-finance films with Warner Bros. , and Universal Studios. Since 2016, Legendary has been a subsidiary of the Chinese conglomerate Wanda Group. The conversations happening on social media are increasingly shifting from text to visual media and the tools for automatically understanding these conversations need to keep up with the times. As a leading provider of social media analysis capabilities in the entertainment sphere, Legendary Entertainment Applied Analytics is looking to work with a team of students to develop a tool to infer the emotional content (such as happiness, fear or sadness) of images shared on social media. Data: Social media Skills: Experimental design, crowdsourcing, sentiment analysis of images with DNNs and data-scraping Contact: Jonathan Foster <jfoster@legendary. com> TF: Wasay Abdul Openness: Medium-Low Engagement: Medium
Recent advances in the availability of portable and affordable devices that measure noise, temperature, humidity, and pollutant concentrations allow for a more complete and mechanistic understanding of the determinants of personal environmental exposures. We can now continuously monitor for many health-relevant exposures, including carbon dioxide (CO 2 ), temperature, relative humidity, nitrogen dioxide (NO 2 ), and fine particulate matter (PM 2. 5 ) using small, inexpensive, real-time monitors. Many stakeholders are interested in the value of these sensors to: inform urban and regional policy; identify pollutant sources at various temporal and spatial scales; and to provide data for personal decision making. This project would involve the development of algorithms to inform the siting of monitoring stations within an urban area to maximize the incremental value of these data and optimize activities based on the predicted pollutant levels (e. g. best bike routes). Data: Data from sensors and public data Skills: Experimental design, Bayesian inference models, optimization methods. Contact: Gary Adamkiewicz: gadamkie@hsph. harvard. edu TF: Isaac Slavitt Openness: Medium Engagement: Medium
Many tasks involving the annotation of medical data would benefit from specialized tools to increase throughput. Common scenarios include (a) medical imaging data where spatial locations, either points or regions, are annotated with a specific label, and (b) clinical electronic health record data where patient records are annotated as normal versus abnormal or labeled based on a diagnosis from a physician. Because software tools to readily optimize workflow do not exist, manual annotation is time consuming. The purpose of this project will be to develop a medical image annotation tool that will allow researchers to (1) label modalities of medical imaging data (MRI and CT) in a facile manner and (2) predict annotation in an automated fashion. Data: MRI and CT scans Skills: Data cleaning, ML, DNN, signal processing and software development Contact: Mark Michalski: MMICHALSKI 1@partners. org TF: Daniele Foresti Openness: Low Engagement: High
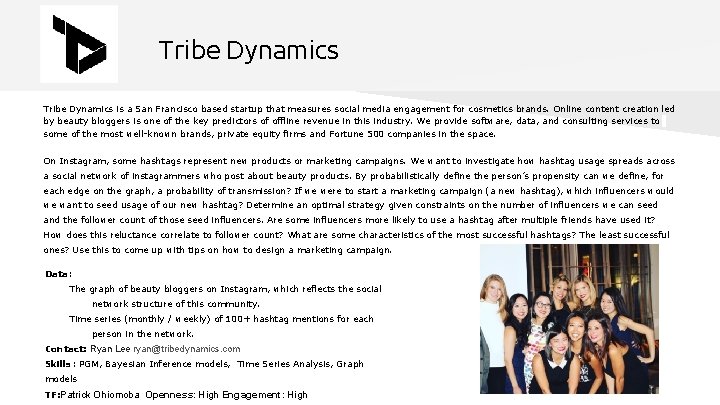
Tribe Dynamics is a San Francisco based startup that measures social media engagement for cosmetics brands. Online content creation led by beauty bloggers is one of the key predictors of offline revenue in this industry. We provide software, data, and consulting services to some of the most well-known brands, private equity firms and Fortune 500 companies in the space. On Instagram, some hashtags represent new products or marketing campaigns. We want to investigate how hashtag usage spreads across a social network of instagrammers who post about beauty products. By probabilistically define the person’s propensity can we define, for each edge on the graph, a probability of transmission? If we were to start a marketing campaign (a new hashtag), which influencers would we want to seed usage of our new hashtag? Determine an optimal strategy given constraints on the number of influencers we can seed and the follower count of those seed influencers. Are some influencers more likely to use a hashtag after multiple friends have used it? How does this reluctance correlate to follower count? What are some characteristics of the most successful hashtags? The least successful ones? Use this to come up with tips on how to design a marketing campaign. Data: The graph of beauty bloggers on Instagram, which reflects the social network structure of this community. Time series (monthly / weekly) of 100+ hashtag mentions for each person in the network. Contact: Ryan Lee ryan@tribedynamics. com Skills: PGM, Bayesian Inference models, Time Series Analysis, Graph models TF: Patrick Ohiomoba Openness: High Engagement: High
Trip. Advisor is an American travel website company providing reviews of travel-related content. It also includes interactive travel forums. The website services are free to users, who provide most of the content, and the website is supported by an advertising business model. In this project you will investigate the importance of unfulfilled queries. For example, if guests are querying for hotels in Idaho Fall with free wi-fi on Aug 21 and or Ethiopian restaurant in Davis Square with no results returned then one can: 1) Create market opportunities using incentives. 2 Adjust the predictive models to include these negative data and use negative results for the estimation of the confidence intervals. Data: Queries from tripadvisor Skills: Inference models, AB testings Contact: Jeff Palmucci: jpalmucci@tripadvisor. com TF: Reinier Maat Openness: High-Very high Engagement: Medium
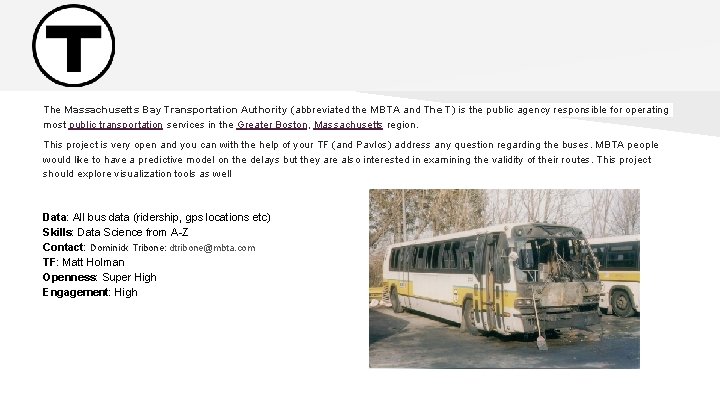
The Massachusetts Bay Transportation Authority (abbreviated the MBTA and The T) is the public agency responsible for operating most public transportation services in the Greater Boston, Massachusetts region. This project is very open and you can with the help of your TF (and Pavlos) address any question regarding the buses. MBTA people would like to have a predictive model on the delays but they are also interested in examining the validity of their routes. This project should explore visualization tools as well Data: All bus data (ridership, gps locations etc) Skills: Data Science from A-Z Contact: Dominick Tribone: dtribone@mbta. com TF: Matt Holman Openness: Super High Engagement: High
Next steps Friday 27/1: Select projects: https: //canvas. harvard. edu/courses/20897/assignments/129517 Monday 29/1: Teams will be announced Set meeting times with Pavlos and TFs Week 29/1 -2/2: Meet with partners, Pavlos and TFs
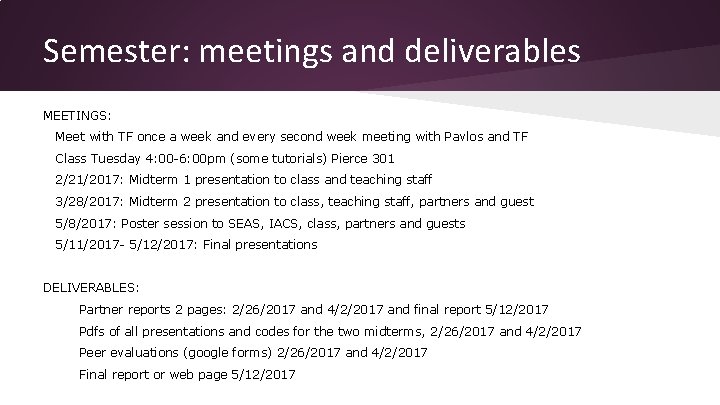
Semester: meetings and deliverables MEETINGS: Meet with TF once a week and every second week meeting with Pavlos and TF Class Tuesday 4: 00 -6: 00 pm (some tutorials) Pierce 301 2/21/2017: Midterm 1 presentation to class and teaching staff 3/28/2017: Midterm 2 presentation to class, teaching staff, partners and guest 5/8/2017: Poster session to SEAS, IACS, class, partners and guests 5/11/2017 - 5/12/2017: Final presentations DELIVERABLES: Partner reports 2 pages: 2/26/2017 and 4/2/2017 and final report 5/12/2017 Pdfs of all presentations and codes for the two midterms, 2/26/2017 and 4/2/2017 Peer evaluations (google forms) 2/26/2017 and 4/2/2017 Final report or web page 5/12/2017
Tutorials Tutorial 1: collaboration - partner etiquette, Isaac Tutorial 2: Deep Neural Networks, Reinier Tutorial 3: ML with sklearn, TBD Tutorial 4: Data Management, DBs, TBD Tutorial 5: On presentations, TBD Tutorial 6: TBD Some guest lectures Guest Lecturer 1: 3 D printing, Daniele Guest Lecturer 2: