
Period finding in astronomical time series Pavlos Protopapas
- Slides: 47
Period finding in astronomical time series Pavlos Protopapas Time Series Center Harvard Smithsonian Center for Astrophysics, School of Engineering and Applied Sciences, Harvard
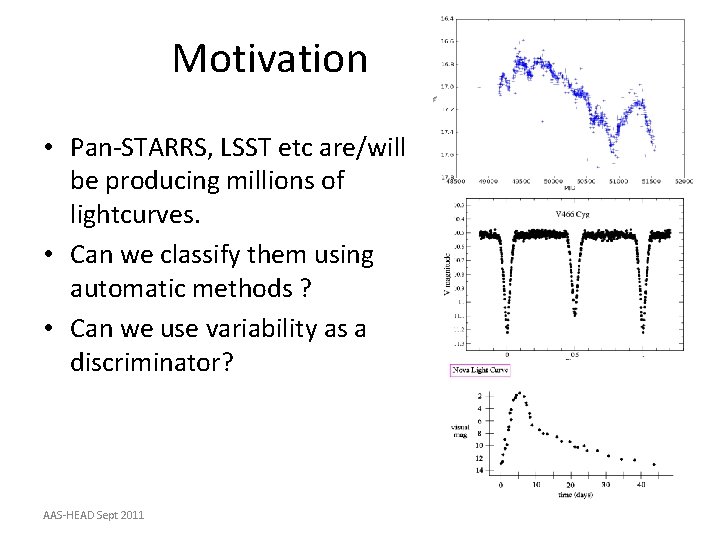
Motivation • Pan-STARRS, LSST etc are/will be producing millions of lightcurves. • Can we classify them using automatic methods ? • Can we use variability as a discriminator? AAS-HEAD Sept 2011
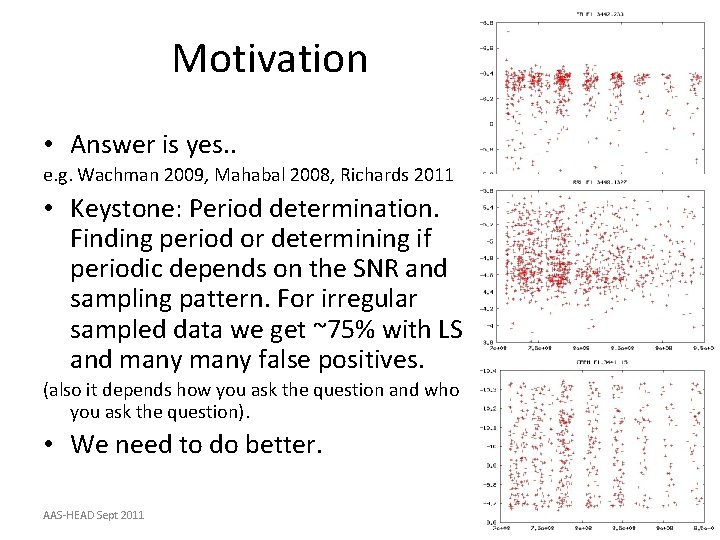
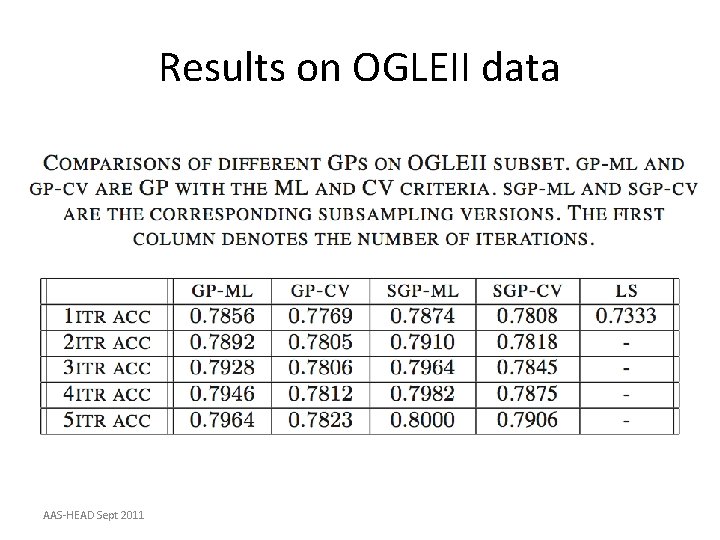
Motivation • Answer is yes. . e. g. Wachman 2009, Mahabal 2008, Richards 2011 • Keystone: Period determination. Finding period or determining if periodic depends on the SNR and sampling pattern. For irregular sampled data we get ~75% with LS and many false positives. (also it depends how you ask the question and who you ask the question). • We need to do better. AAS-HEAD Sept 2011
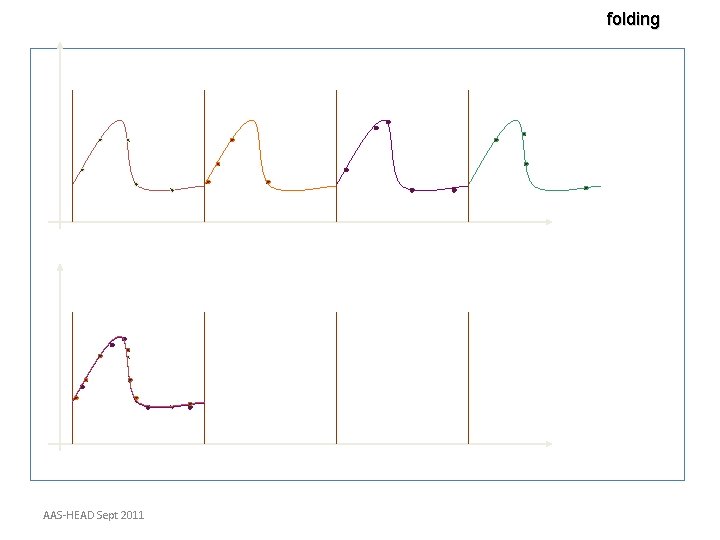
folding AAS-HEAD Sept 2011
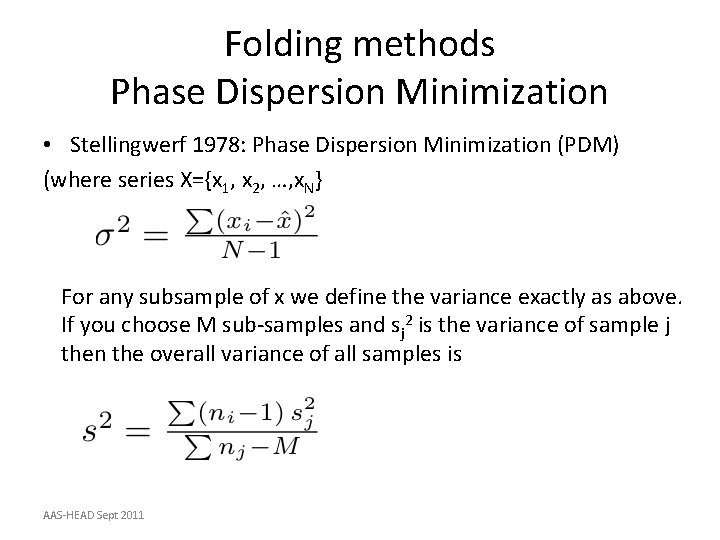
Folding methods Phase Dispersion Minimization • Stellingwerf 1978: Phase Dispersion Minimization (PDM) (where series X={x 1, x 2, …, x. N} For any subsample of x we define the variance exactly as above. If you choose M sub-samples and sj 2 is the variance of sample j then the overall variance of all samples is AAS-HEAD Sept 2011
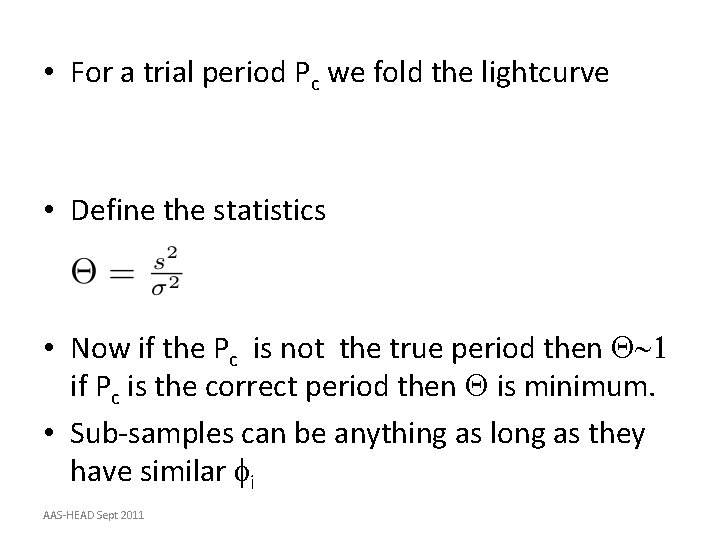
• For a trial period Pc we fold the lightcurve • Define the statistics • Now if the Pc is not the true period then Q~1 if Pc is the correct period then Q is minimum. • Sub-samples can be anything as long as they have similar fi AAS-HEAD Sept 2011
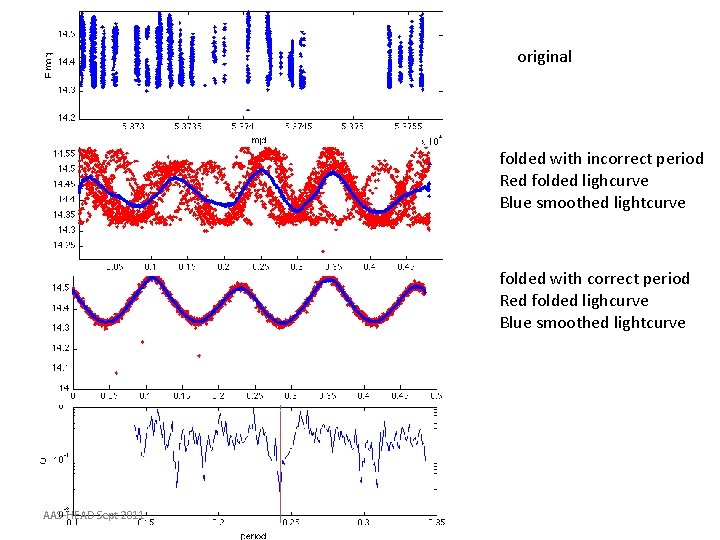
original folded with incorrect period Red folded lighcurve Blue smoothed lightcurve folded with correct period Red folded lighcurve Blue smoothed lightcurve AAS-HEAD Sept 2011
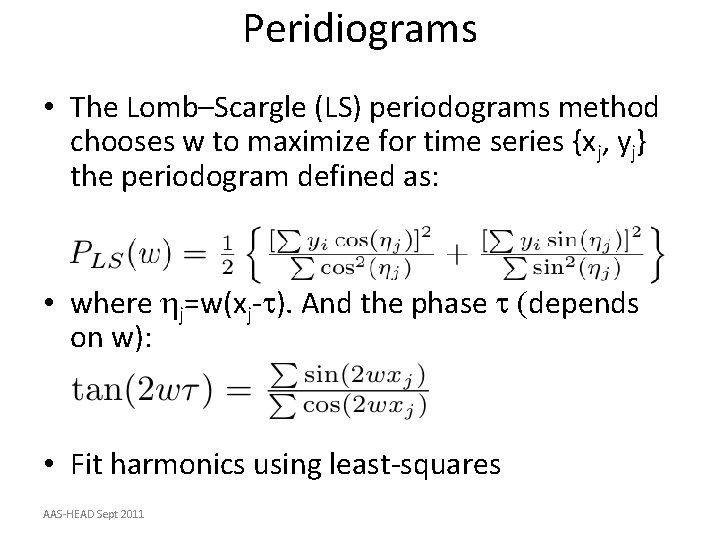
Peridiograms • The Lomb–Scargle (LS) periodograms method chooses w to maximize for time series {xj, yj} the periodogram defined as: • where hj=w(xj-t). And the phase t (depends on w): • Fit harmonics using least-squares AAS-HEAD Sept 2011
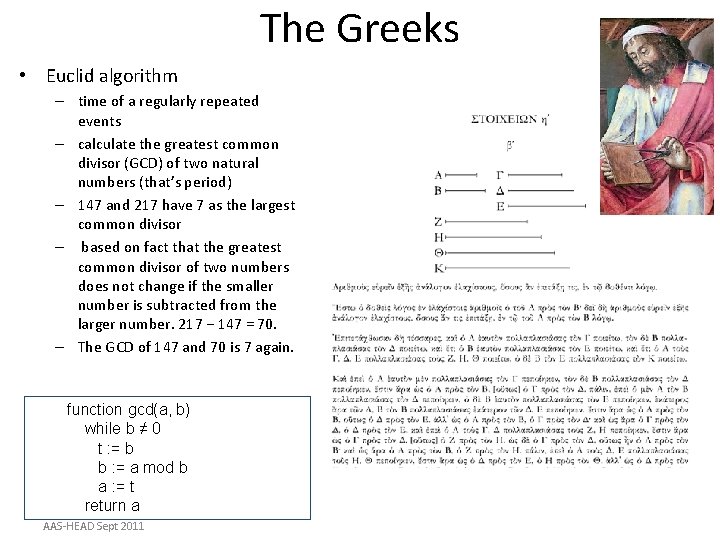
The Greeks • Euclid algorithm – time of a regularly repeated events – calculate the greatest common divisor (GCD) of two natural numbers (that’s period) – 147 and 217 have 7 as the largest common divisor – based on fact that the greatest common divisor of two numbers does not change if the smaller number is subtracted from the larger number. 217 − 147 = 70. – The GCD of 147 and 70 is 7 again. function gcd(a, b) while b ≠ 0 t : = b b : = a mod b a : = t return a AAS-HEAD Sept 2011
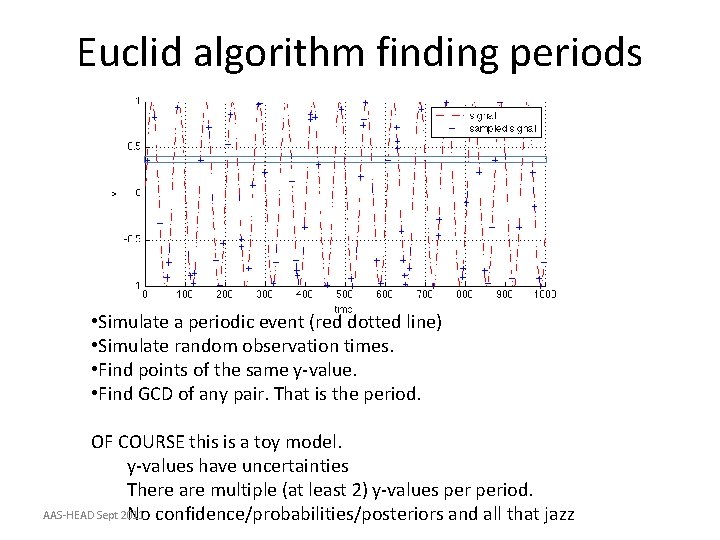
Euclid algorithm finding periods • Simulate a periodic event (red dotted line) • Simulate random observation times. • Find points of the same y-value. • Find GCD of any pair. That is the period. OF COURSE this is a toy model. y-values have uncertainties There are multiple (at least 2) y-values period. AAS-HEAD Sept 2011 No confidence/probabilities/posteriors and all that jazz
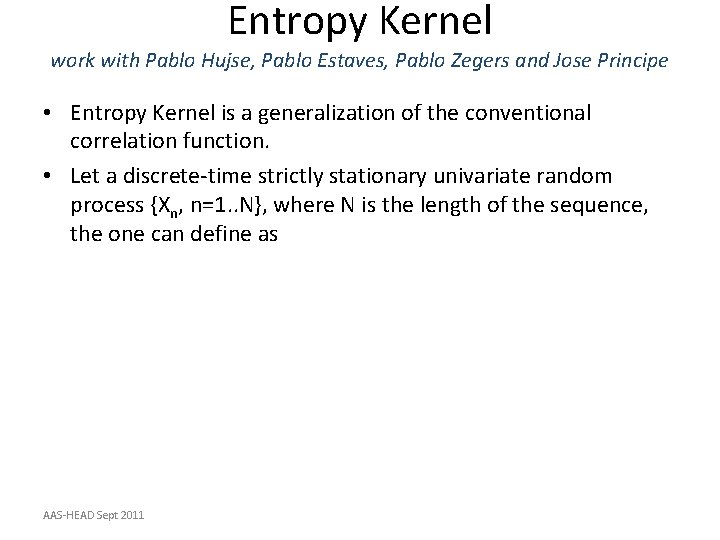
Entropy Kernel work with Pablo Hujse, Pablo Estaves, Pablo Zegers and Jose Principe • Entropy Kernel is a generalization of the conventional correlation function. • Let a discrete-time strictly stationary univariate random process {Xn, n=1. . N}, where N is the length of the sequence, the one can define as AAS-HEAD Sept 2011
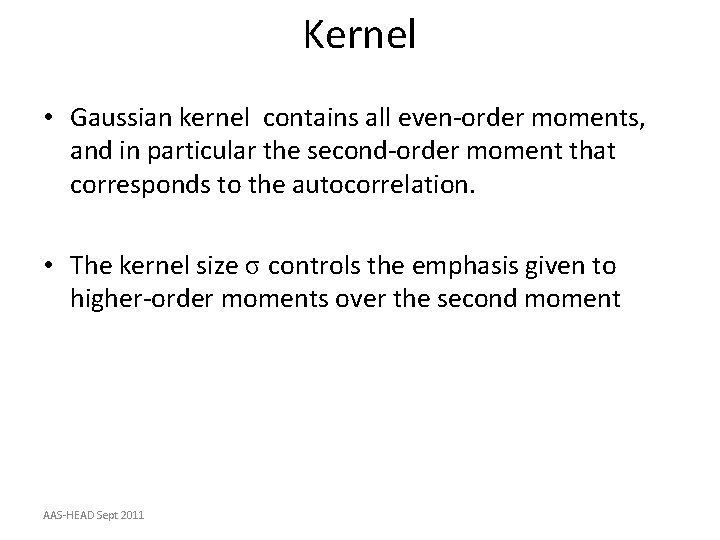
Kernel • Gaussian kernel contains all even-order moments, and in particular the second-order moment that corresponds to the autocorrelation. • The kernel size σ controls the emphasis given to higher-order moments over the second moment AAS-HEAD Sept 2011
Gaussian Kernel aka Correntropy • The name correntropy comes from the fact that it looks like correlation but the sum over the lags (or over dimensions of the multivariate random variable) is the information potential (i. e. , the argument of Renyi’s quadratic entropy • Renyi’s quadratic entropy is a generalization of the Shannon entropy (uncertainty associated with a random variable) AAS-HEAD Sept 2011
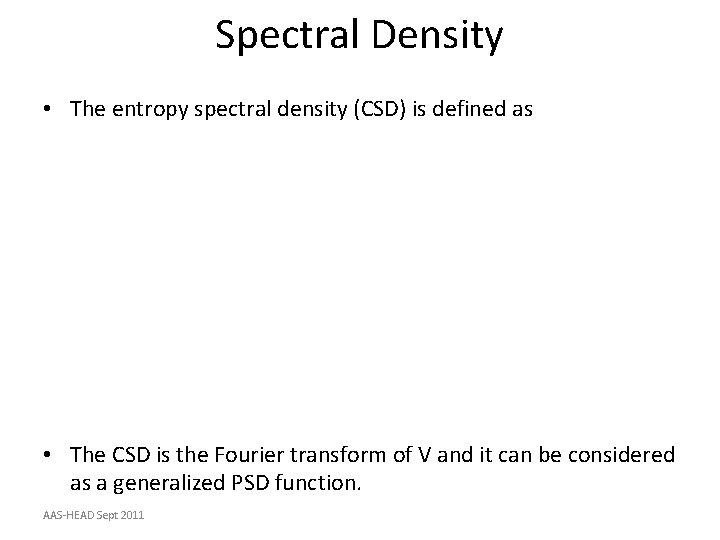
Spectral Density • The entropy spectral density (CSD) is defined as • The CSD is the Fourier transform of V and it can be considered as a generalized PSD function. AAS-HEAD Sept 2011
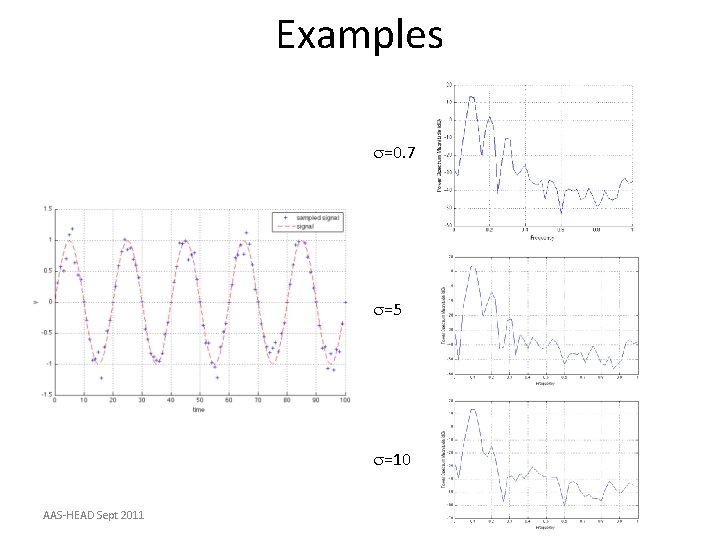
Examples s=0. 7 s=5 s=10 AAS-HEAD Sept 2011
Irregular sampling • Remember we have irregular sampling. • Proposed a slotted method W. Mayo, “Spectrum measurements with laser velocimeters, ” in Proceedings of dynamic flow conference, DISA Electronik A/S DK-2740, (Skoolunder, Denmark), pp. 851– 868, 1978.
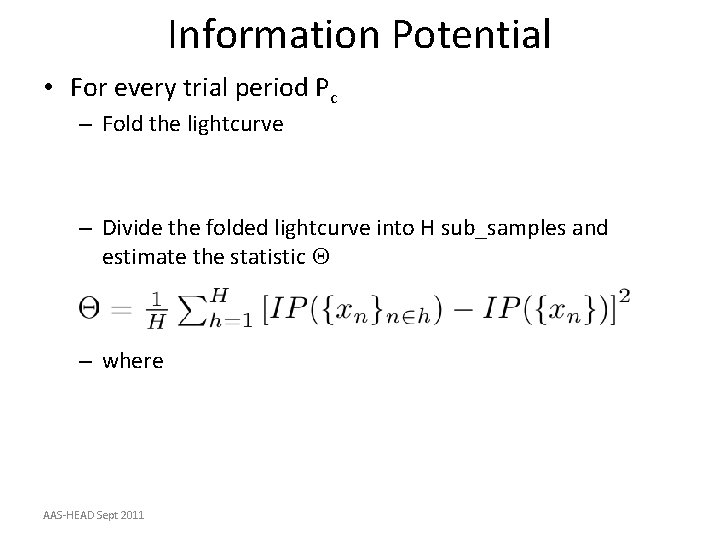
Information Potential • For every trial period Pc – Fold the lightcurve – Divide the folded lightcurve into H sub_samples and estimate the statistic Q – where AAS-HEAD Sept 2011
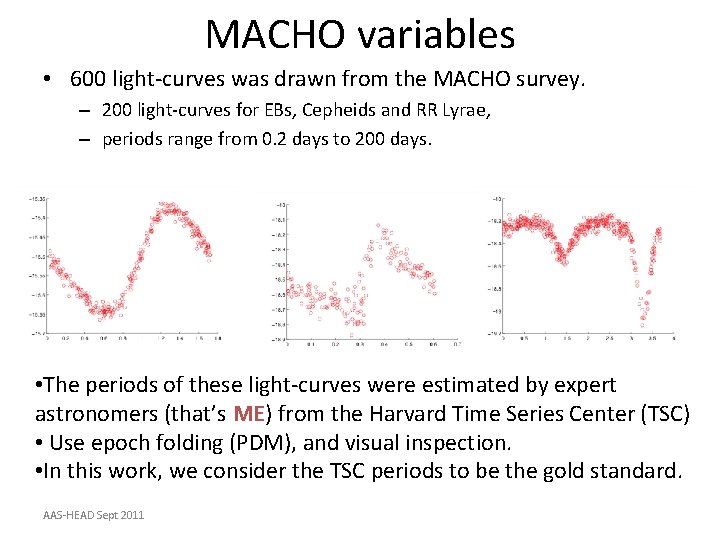
MACHO variables • 600 light-curves was drawn from the MACHO survey. – 200 light-curves for EBs, Cepheids and RR Lyrae, – periods range from 0. 2 days to 200 days. • The periods of these light-curves were estimated by expert astronomers (that’s ME) from the Harvard Time Series Center (TSC) • Use epoch folding (PDM), and visual inspection. • In this work, we consider the TSC periods to be the gold standard. AAS-HEAD Sept 2011
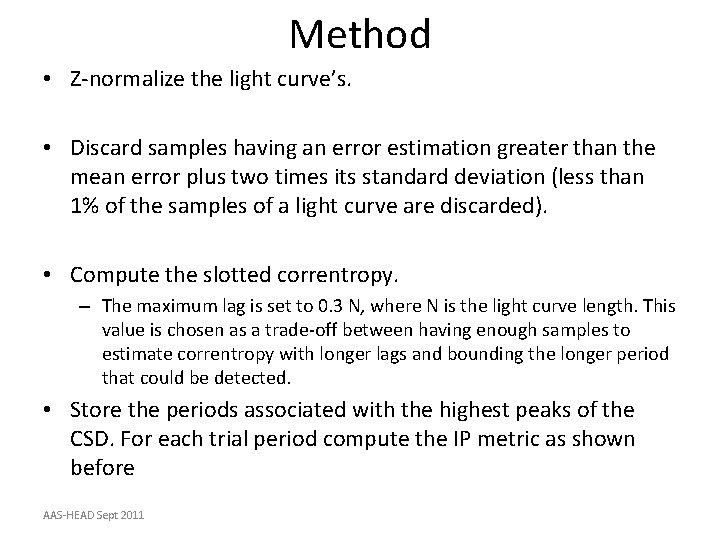
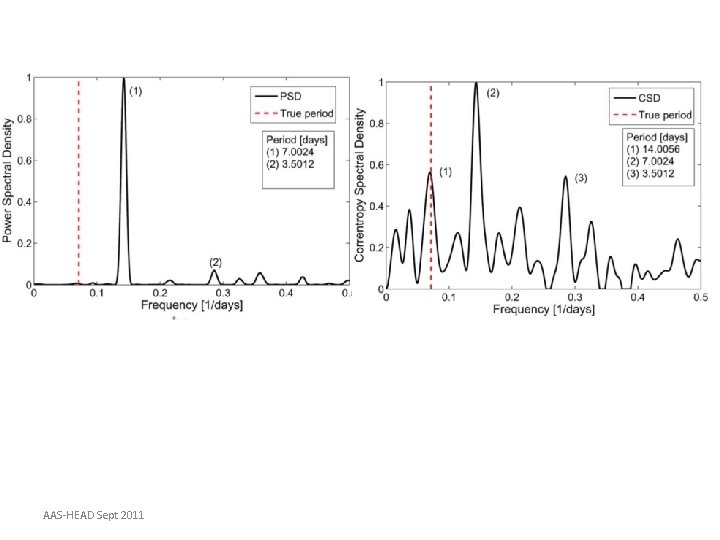
Method • Z-normalize the light curve’s. • Discard samples having an error estimation greater than the mean error plus two times its standard deviation (less than 1% of the samples of a light curve are discarded). • Compute the slotted correntropy. – The maximum lag is set to 0. 3 N, where N is the light curve length. This value is chosen as a trade-off between having enough samples to estimate correntropy with longer lags and bounding the longer period that could be detected. • Store the periods associated with the highest peaks of the CSD. For each trial period compute the IP metric as shown before AAS-HEAD Sept 2011
AAS-HEAD Sept 2011
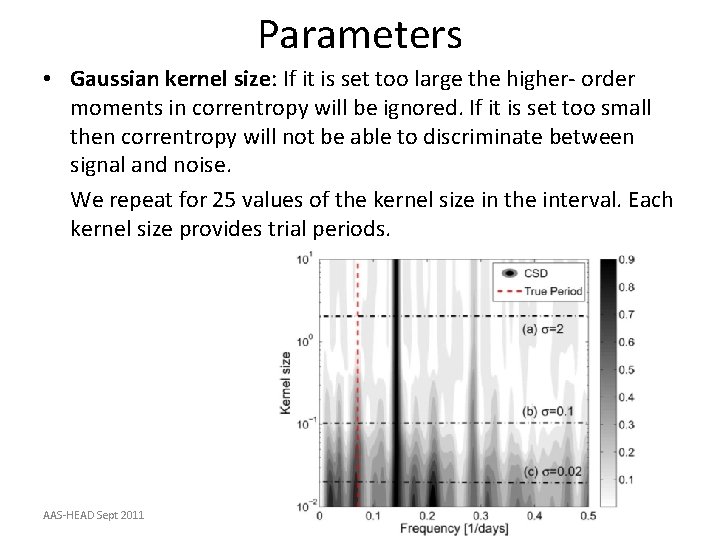
Parameters • Gaussian kernel size: If it is set too large the higher- order moments in correntropy will be ignored. If it is set too small then correntropy will not be able to discriminate between signal and noise. We repeat for 25 values of the kernel size in the interval. Each kernel size provides trial periods. AAS-HEAD Sept 2011
Other parameters • Correntropy slot size Dt: Set to 0. 25 days to capture the shorter periods present in the data set • Number of peaks analyzed from the CSD: In our experiments we found that setting Np=10 is a good trade-off between obtaining the biggest hit rate and having less computational load. AAS-HEAD Sept 2011
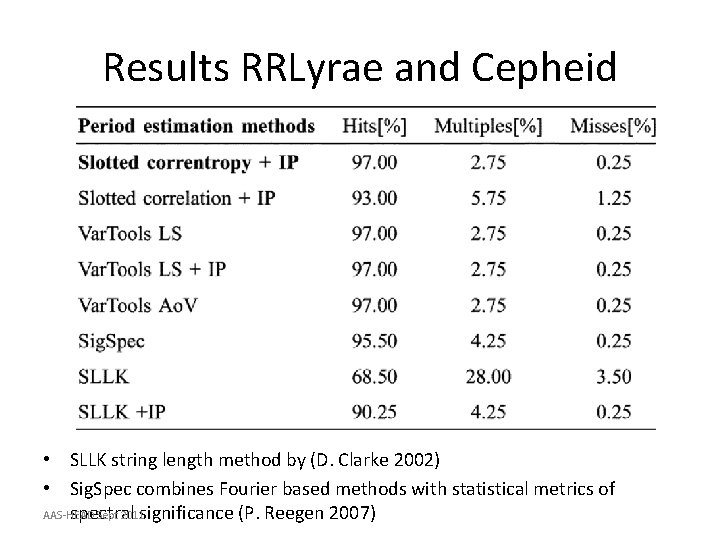
Results RRLyrae and Cepheid • SLLK string length method by (D. Clarke 2002) • Sig. Spec combines Fourier based methods with statistical metrics of AAS-HEAD Sept 2011 spectral significance (P. Reegen 2007)
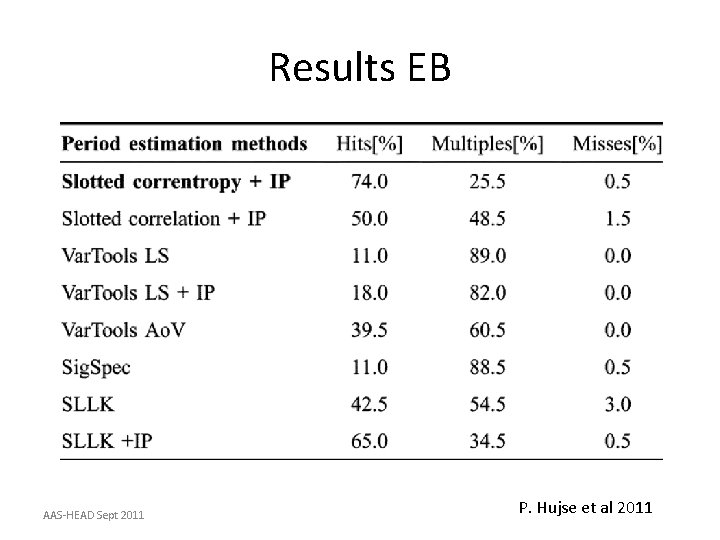
Results EB AAS-HEAD Sept 2011 P. Hujse et al 2011
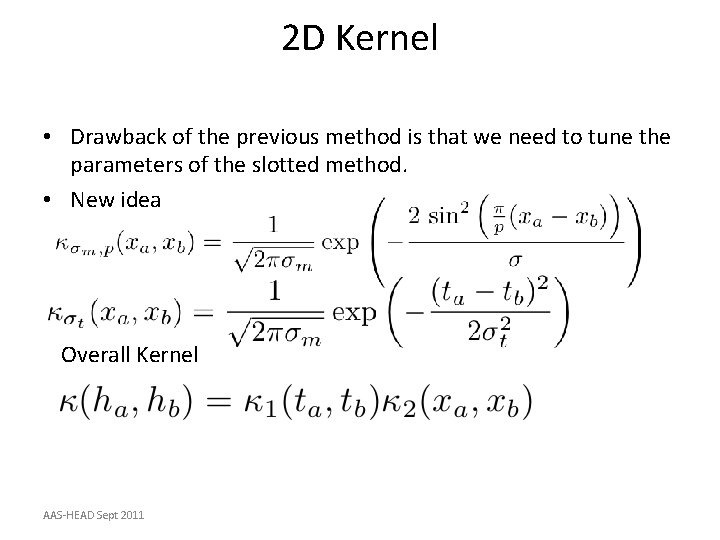
2 D Kernel • Drawback of the previous method is that we need to tune the parameters of the slotted method. • New idea Overall Kernel AAS-HEAD Sept 2011
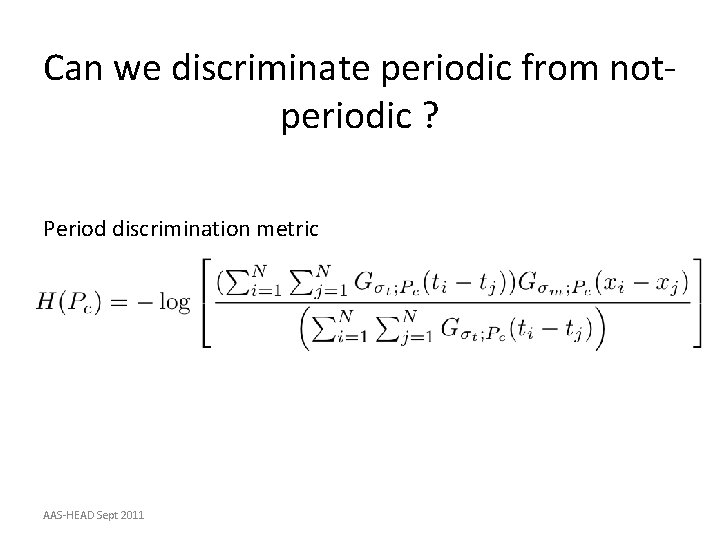
Can we discriminate periodic from notperiodic ? Period discrimination metric AAS-HEAD Sept 2011
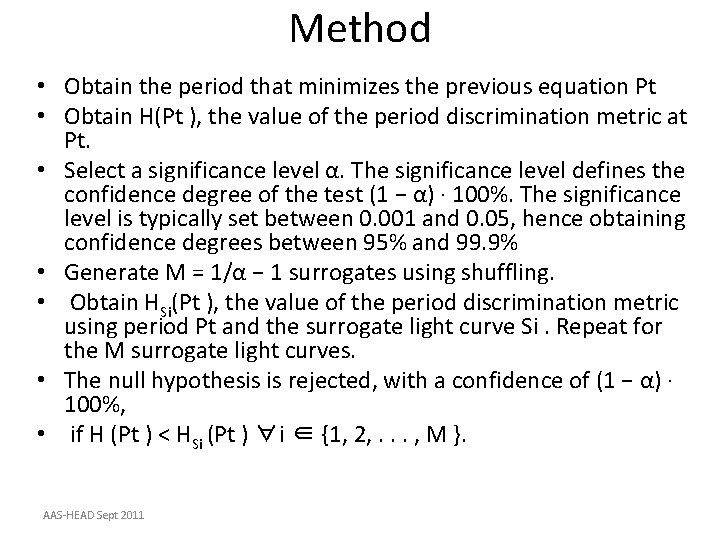
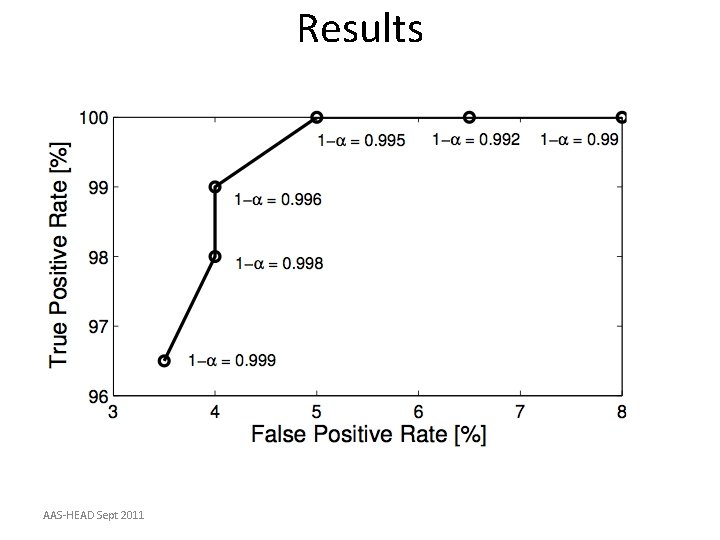
Method • Obtain the period that minimizes the previous equation Pt • Obtain H(Pt ), the value of the period discrimination metric at Pt. • Select a significance level α. The significance level defines the confidence degree of the test (1 − α) · 100%. The significance level is typically set between 0. 001 and 0. 05, hence obtaining confidence degrees between 95% and 99. 9% • Generate M = 1/α − 1 surrogates using shuffling. • Obtain HSi(Pt ), the value of the period discrimination metric using period Pt and the surrogate light curve Si. Repeat for the M surrogate light curves. • The null hypothesis is rejected, with a confidence of (1 − α) · 100%, • if H (Pt ) < HSi (Pt ) ∀i ∈ {1, 2, . . . , M }. AAS-HEAD Sept 2011
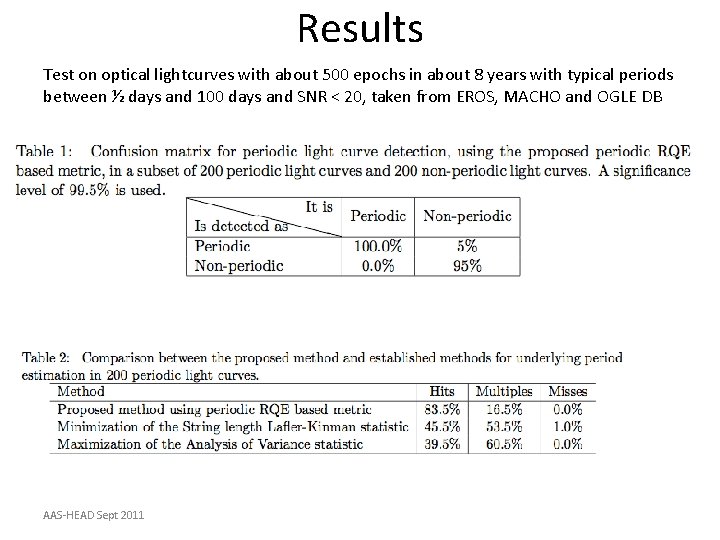
Results Test on optical lightcurves with about 500 epochs in about 8 years with typical periods between ½ days and 100 days and SNR < 20, taken from EROS, MACHO and OGLE DB AAS-HEAD Sept 2011
Results AAS-HEAD Sept 2011
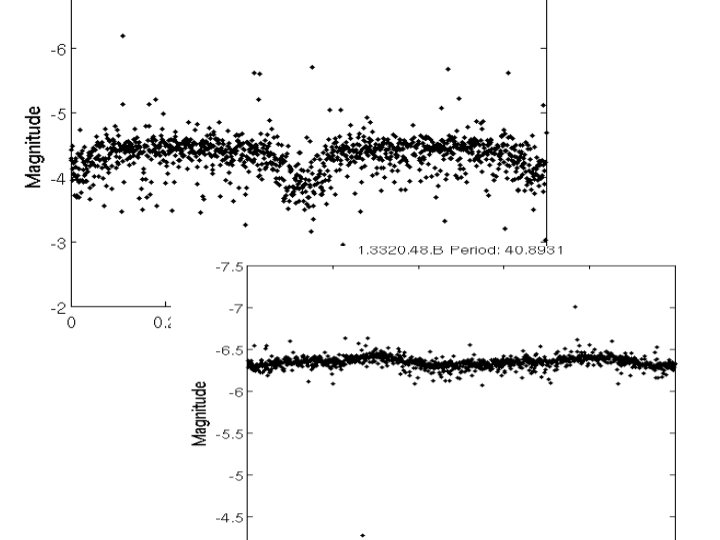
False Positives (FP) • 4% is too high considering we want to look into millions of lightcurves • Further examination of FP have alias of 1 day or 29. 5 days. • Remove those in a test containing 200 periodic and 2000 non periodic we found 2 FPs AAS-HEAD Sept 2011
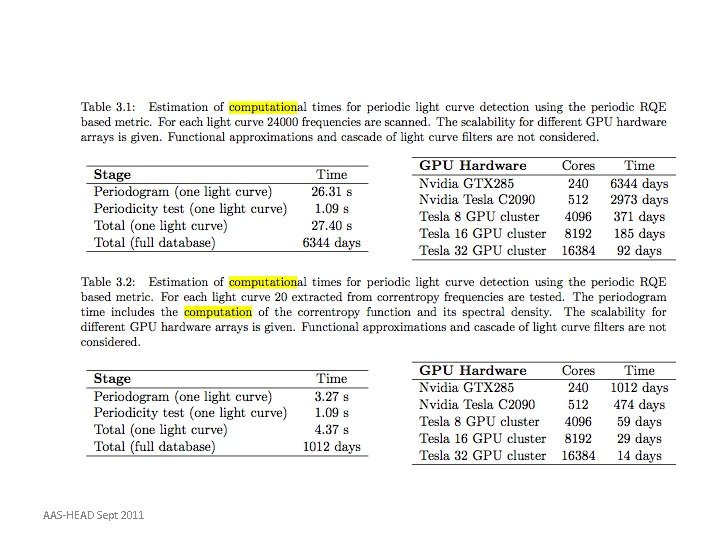
Computational aspects • With the 2 D periodic kernel we do not have to worry of slotted parameters but P is an unknown. • One has to try many different periods. AAS-HEAD Sept 2011
AAS-HEAD Sept 2011
Nonparametric Bayesian Estimation of Periodic Functions using GP work with Yuyang Wang, Roni Khardon • Gaussian Processes has been widely used in the Bayesian literature by substituting a parametric latent function with a stochastic process with a Gaussian prior. • Not the first Bayesian approach (P. Gregory and T. Loredo, “Bayesian periodic signal detection: Analysis of ROSAT observations of PSR 0540 -693, ” The Astrophysical Journal, vol. 473, p. 1059, 1996. AAS-HEAD Sept 2011
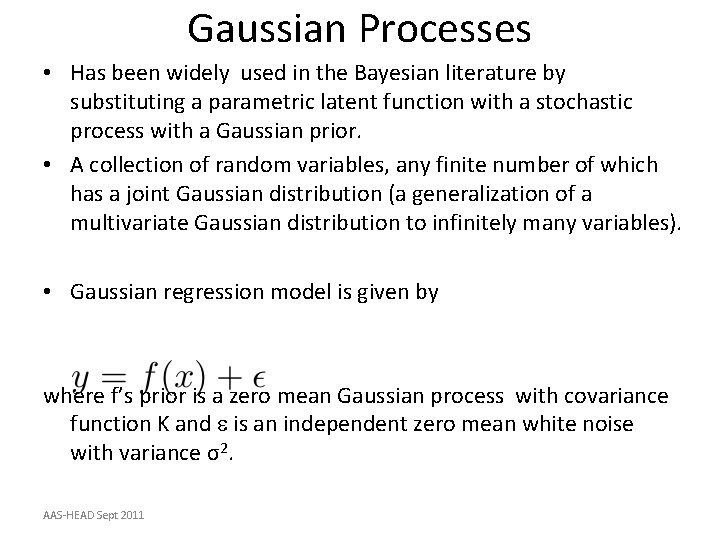
Gaussian Processes • Has been widely used in the Bayesian literature by substituting a parametric latent function with a stochastic process with a Gaussian prior. • A collection of random variables, any finite number of which has a joint Gaussian distribution (a generalization of a multivariate Gaussian distribution to infinitely many variables). • Gaussian regression model is given by where f’s prior is a zero mean Gaussian process with covariance function K and e is an independent zero mean white noise with variance σ2. AAS-HEAD Sept 2011
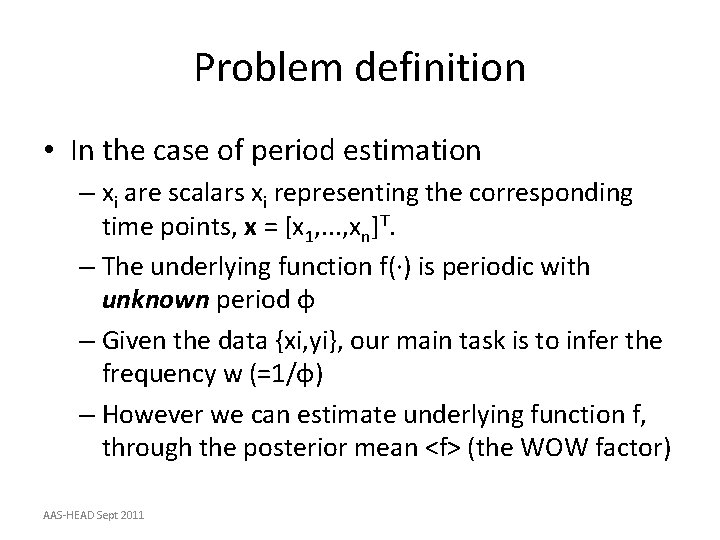
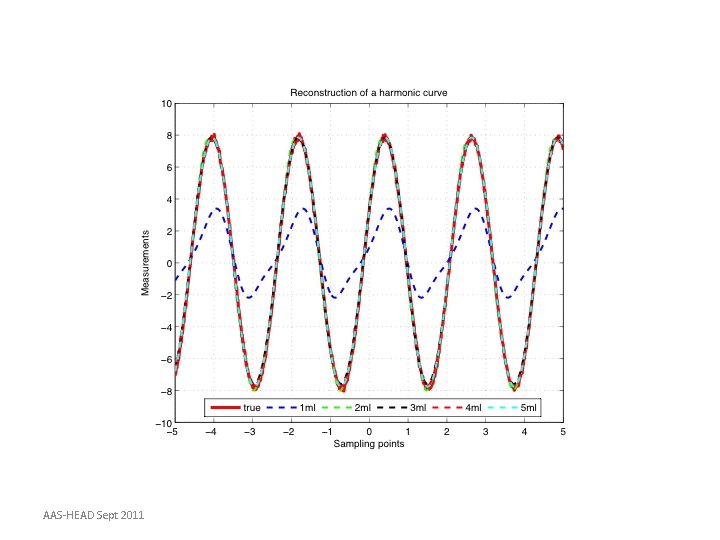
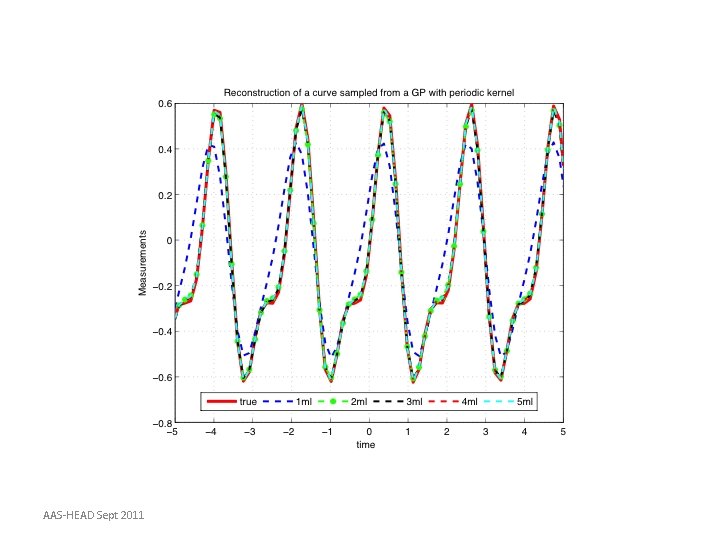
Problem definition • In the case of period estimation – xi are scalars xi representing the corresponding time points, x = [x 1, . . . , xn]T. – The underlying function f(·) is periodic with unknown period φ – Given the data {xi, yi}, our main task is to infer the frequency w (=1/φ) – However we can estimate underlying function f, through the posterior mean <f> (the WOW factor) AAS-HEAD Sept 2011
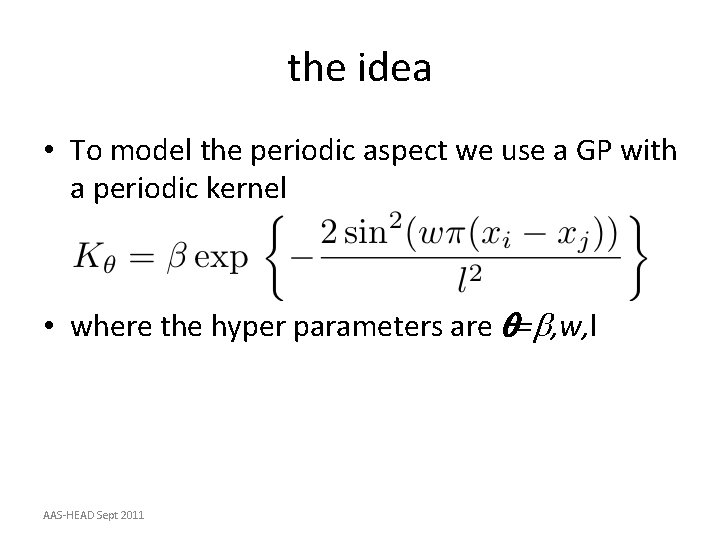
the idea • To model the periodic aspect we use a GP with a periodic kernel • where the hyper parameters are q=b, w, l AAS-HEAD Sept 2011
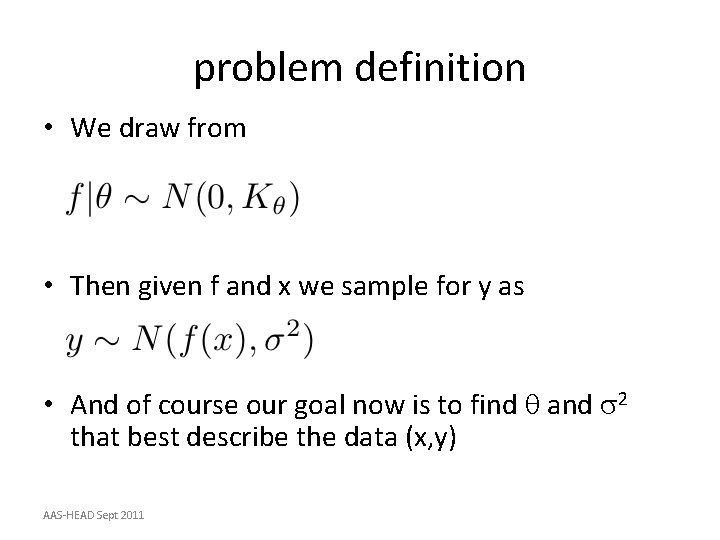
problem definition • We draw from • Then given f and x we sample for y as • And of course our goal now is to find q and s 2 that best describe the data (x, y) AAS-HEAD Sept 2011
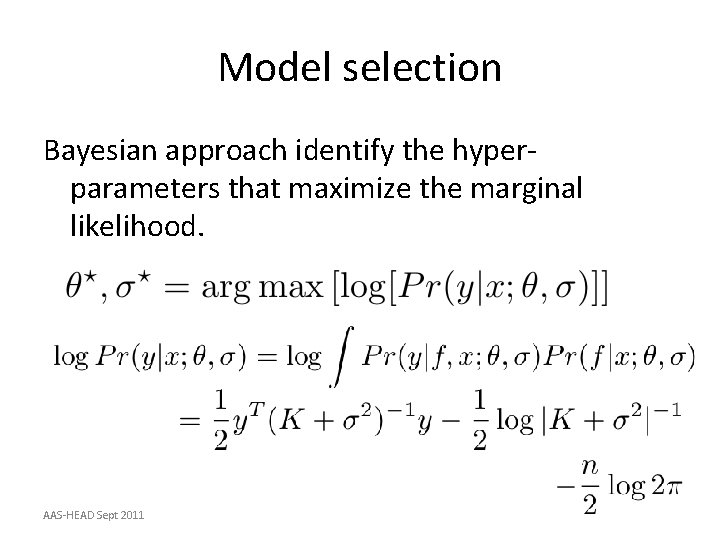
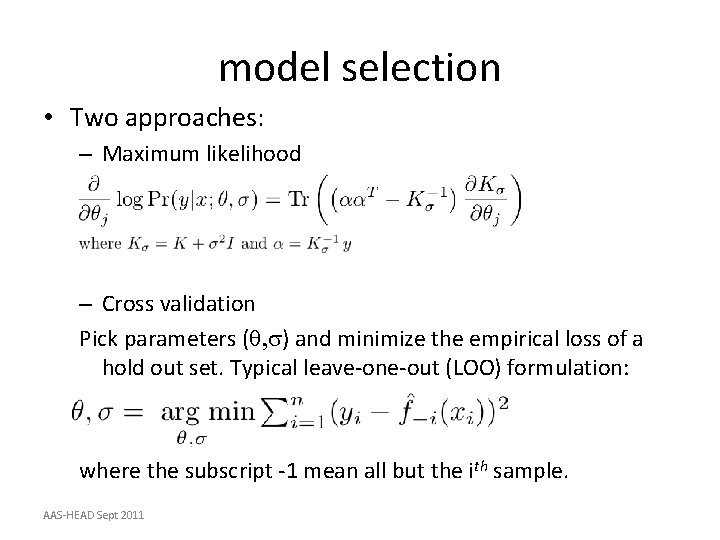
Model selection Bayesian approach identify the hyperparameters that maximize the marginal likelihood. AAS-HEAD Sept 2011
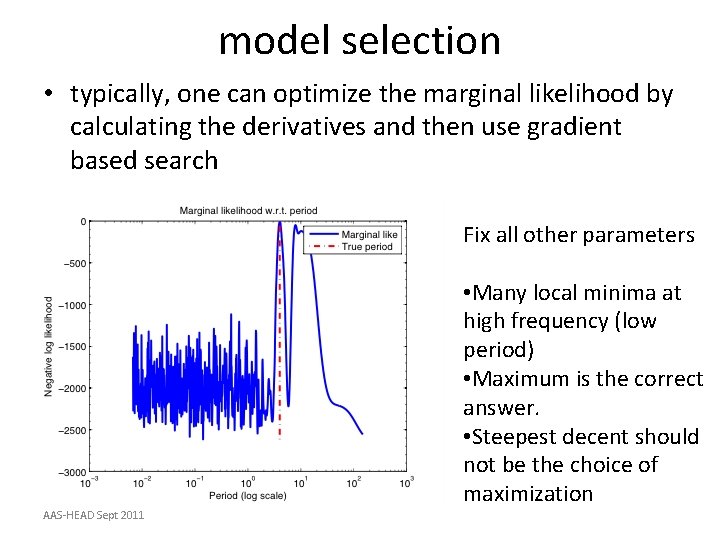
model selection • typically, one can optimize the marginal likelihood by calculating the derivatives and then use gradient based search Fix all other parameters AAS-HEAD Sept 2011 • Many local minima at high frequency (low period) • Maximum is the correct answer. • Steepest decent should not be the choice of maximization
model selection • Two approaches: – Maximum likelihood – Cross validation Pick parameters (q, s) and minimize the empirical loss of a hold out set. Typical leave-one-out (LOO) formulation: where the subscript -1 mean all but the ith sample. AAS-HEAD Sept 2011
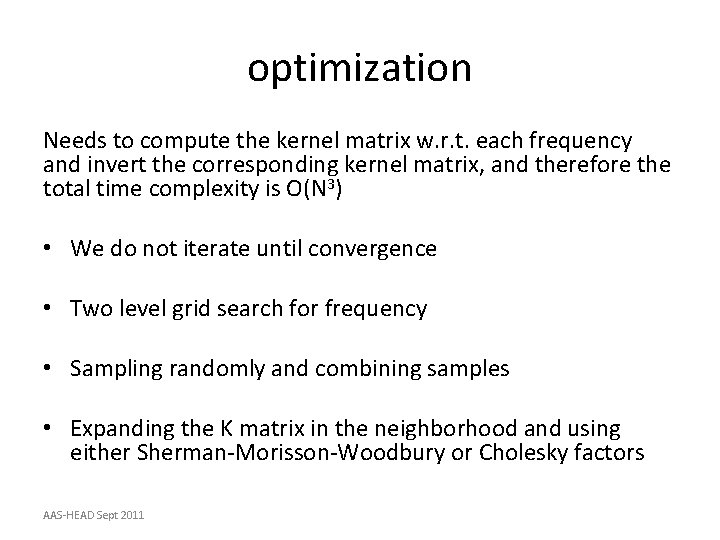
optimization Needs to compute the kernel matrix w. r. t. each frequency and invert the corresponding kernel matrix, and therefore the total time complexity is O(N 3) • We do not iterate until convergence • Two level grid search for frequency • Sampling randomly and combining samples • Expanding the K matrix in the neighborhood and using either Sherman-Morisson-Woodbury or Cholesky factors AAS-HEAD Sept 2011
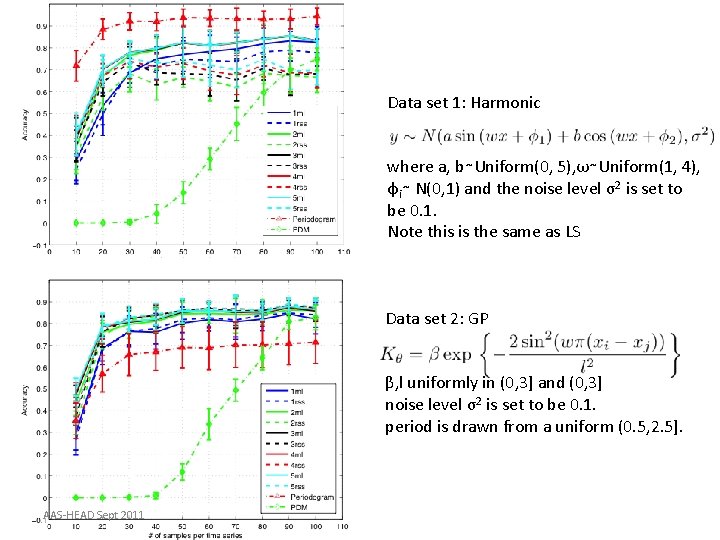
Data set 1: Harmonic where a, b∼Uniform(0, 5), ω∼Uniform(1, 4), φi∼ N(0, 1) and the noise level σ2 is set to be 0. 1. Note this is the same as LS Data set 2: GP β, l uniformly in (0, 3] and (0, 3] noise level σ2 is set to be 0. 1. period is drawn from a uniform (0. 5, 2. 5]. AAS-HEAD Sept 2011
AAS-HEAD Sept 2011
AAS-HEAD Sept 2011
Results on OGLEII data AAS-HEAD Sept 2011
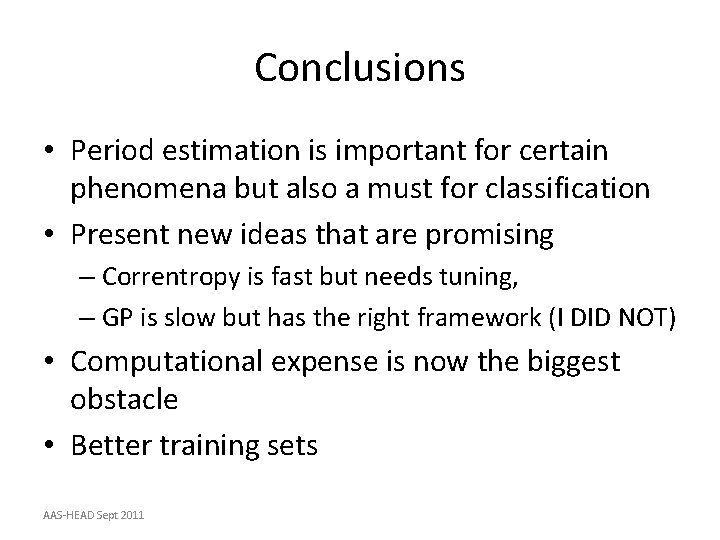
Conclusions • Period estimation is important for certain phenomena but also a must for classification • Present new ideas that are promising – Correntropy is fast but needs tuning, – GP is slow but has the right framework (I DID NOT) • Computational expense is now the biggest obstacle • Better training sets AAS-HEAD Sept 2011