GREEN WALLS AND ANALYSIS OF THEIR IMPACT ON






- Slides: 34
GREEN WALLS AND ANALYSIS OF THEIR IMPACT ON THE QUALITY OF THE INDOOR ENVIRONMENT Doctoral Thesis Ph. D candidate: Ing. arch. Mohammed Salem Alhosni Supervisor: prof. Ing. Zuzana Vranayová, Ph. D. Consultant: doc. Ing. Peter Kapalo, Ph. D.
MAIN IDEAS OF THESIS GREEN INFRASTRUCTURE � key strategy � provide cleaner air and water, � improving living environments, � human health and mental well being. COMPARING � EXTERIOR and INTERIOR PARAMETERS is the first part of the research of this dissertation. � The second is to compare IDENTICAL HALLS WITH THE GREEN WALL and WITHOUT GREEN WALL
INTRODUCTION Chapter 1 History of Green Walls Chapter 2 Existing Green Walls Chapter 3 Effects of Green Walls Chapter 4 Objectives and Thesis of the Dissertation Chapter 5 Methodology of Research of Quality of Indoor Environment Chapter 6 Questionnaire Chapter 7 Experimental TUKE Green Wall Chapter 8 Measurements of Indoor Environment
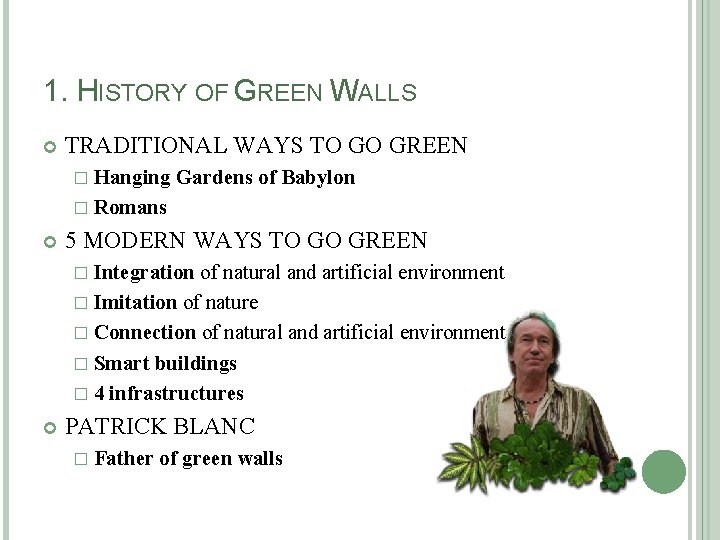
1. HISTORY OF GREEN WALLS TRADITIONAL WAYS TO GO GREEN � Hanging Gardens of Babylon � Romans 5 MODERN WAYS TO GO GREEN � Integration of natural and artificial environment � Imitation of nature � Connection of natural and artificial environment � Smart buildings � 4 infrastructures PATRICK BLANC � Father of green walls
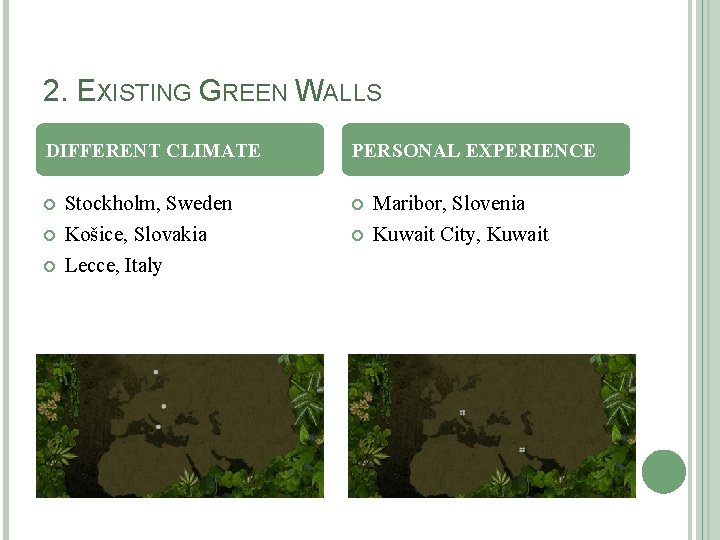
2. EXISTING GREEN WALLS DIFFERENT CLIMATE Stockholm, Sweden Košice, Slovakia Lecce, Italy PERSONAL EXPERIENCE Maribor, Slovenia Kuwait City, Kuwait
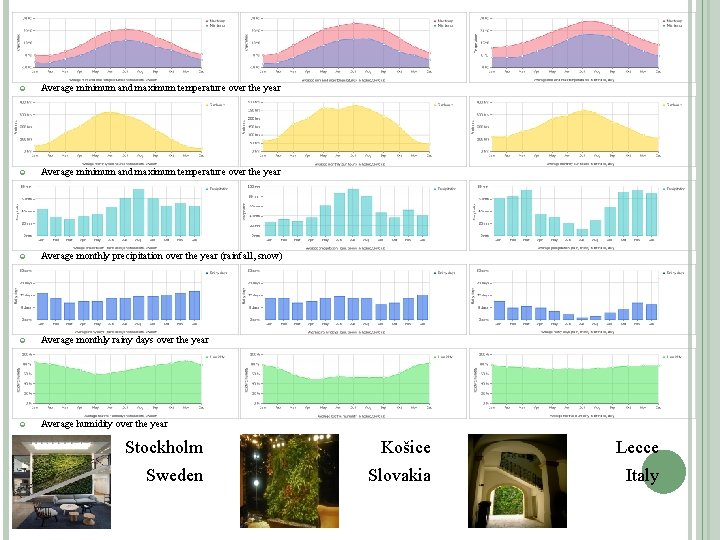
Average minimum and maximum temperature over the year Average monthly precipitation over the year (rainfall, snow) Average monthly rainy days over the year Average humidity over the year Stockholm Košice Lecce Sweden Slovakia Italy
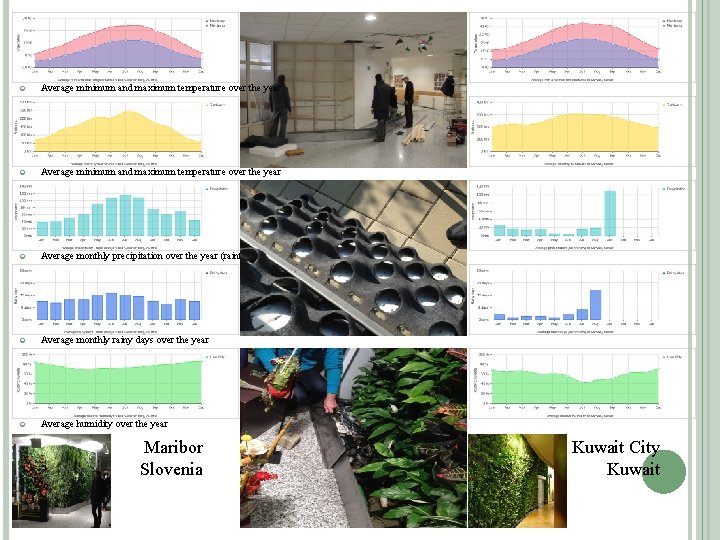
Average minimum and maximum temperature over the year Average monthly precipitation over the year (rainfall, snow) Average monthly rainy days over the year Average humidity over the year Maribor Slovenia Kuwait City Kuwait
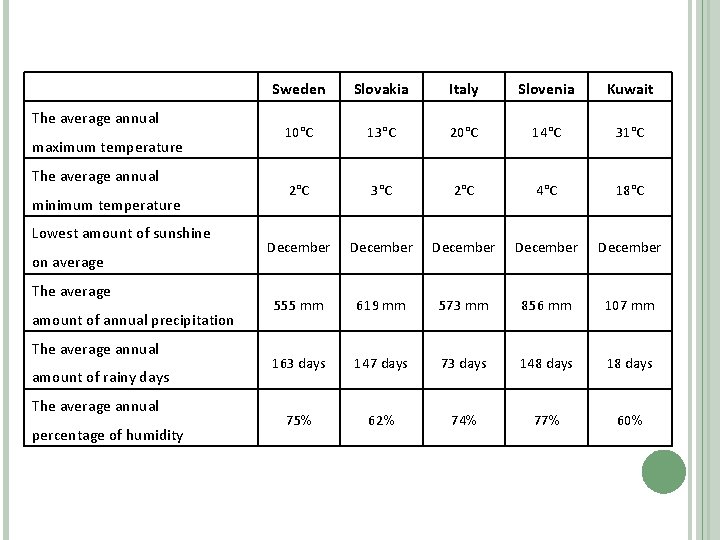
The average annual maximum temperature The average annual minimum temperature Lowest amount of sunshine on average The average amount of annual precipitation The average annual amount of rainy days The average annual percentage of humidity Sweden Slovakia Italy Slovenia Kuwait 10°C 13°C 20°C 14°C 31°C 2°C 3°C 2°C 4°C 18°C December December 555 mm 619 mm 573 mm 856 mm 107 mm 163 days 147 days 73 days 148 days 18 days 75% 62% 74% 77% 60%
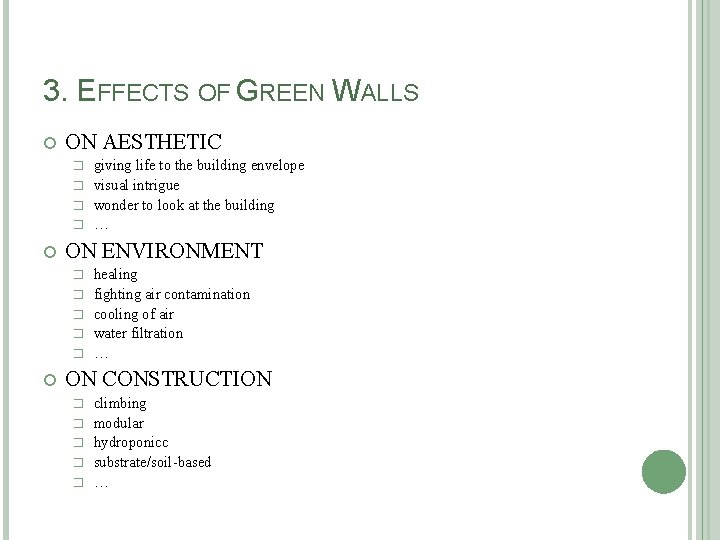
3. EFFECTS OF GREEN WALLS ON AESTHETIC giving life to the building envelope � visual intrigue � wonder to look at the building � … � ON ENVIRONMENT � � � healing fighting air contamination cooling of air water filtration … ON CONSTRUCTION � � � climbing modular hydroponicc substrate/soil-based …
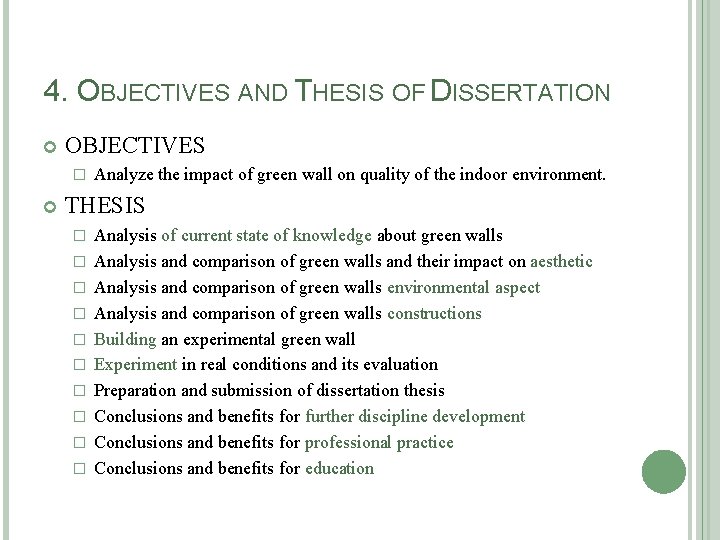
4. OBJECTIVES AND THESIS OF DISSERTATION OBJECTIVES � Analyze the impact of green wall on quality of the indoor environment. THESIS � � � � � Analysis of current state of knowledge about green walls Analysis and comparison of green walls and their impact on aesthetic Analysis and comparison of green walls environmental aspect Analysis and comparison of green walls constructions Building an experimental green wall Experiment in real conditions and its evaluation Preparation and submission of dissertation thesis Conclusions and benefits for further discipline development Conclusions and benefits for professional practice Conclusions and benefits for education
5. METHODOLOGY OF RESEARCH
6. QUESTIONNAIRE Place � at the Faculty of Civil Engineering Period � between December 11, 2017 and February 09, 2018 Respondents � 145 � students and employers of the faculty Evaluated graphically � Interpretation in: Conclusions and benefits for further discipline development Conclusions and benefits for professional practice Conclusions and benefits for education
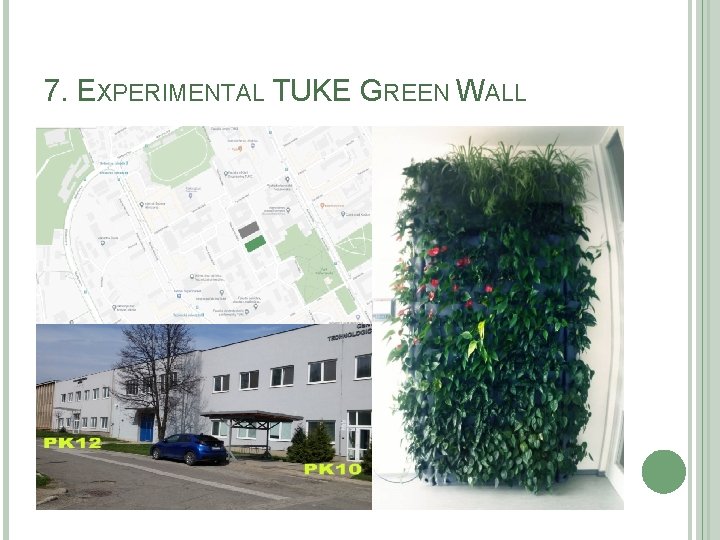
7. EXPERIMENTAL TUKE GREEN WALL
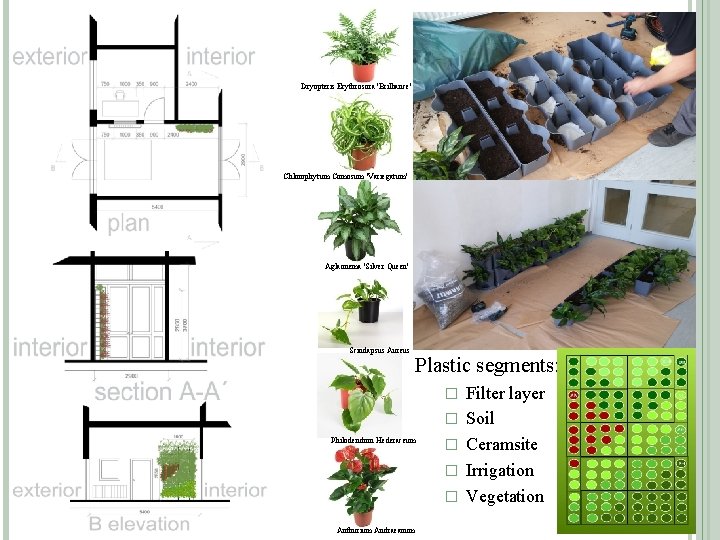
Dryopteris Erythrosora 'Brilliance' Chlorophytum Comosum 'Variegatum' Aglaonema 'Silver Queen' Scindapsus Aureus Plastic segments: � � Philodendron Hederaceum � � � Anthurium Andraeanum Filter layer Soil Ceramsite Irrigation Vegetation
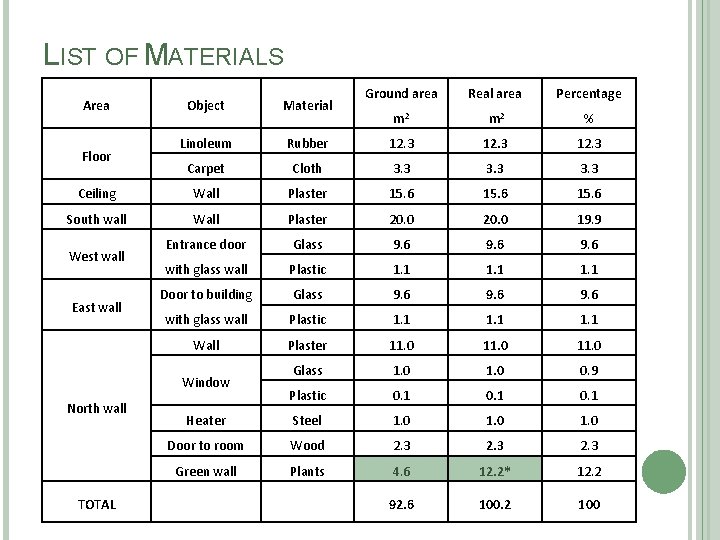
LIST OF MATERIALS Ground area Real area Percentage m 2 % Rubber 12. 3 Carpet Cloth 3. 3 Ceiling Wall Plaster 15. 6 South wall Wall Plaster 20. 0 19. 9 Entrance door Glass 9. 6 with glass wall Plastic 1. 1 Door to building Glass 9. 6 with glass wall Plastic 1. 1 Wall Plaster 11. 0 Glass 1. 0 0. 9 Plastic 0. 1 Heater Steel 1. 0 Door to room Wood 2. 3 Green wall Plants 4. 6 12. 2* 12. 2 92. 6 100. 2 100 Area Floor West wall East wall Object Material Linoleum Window North wall TOTAL
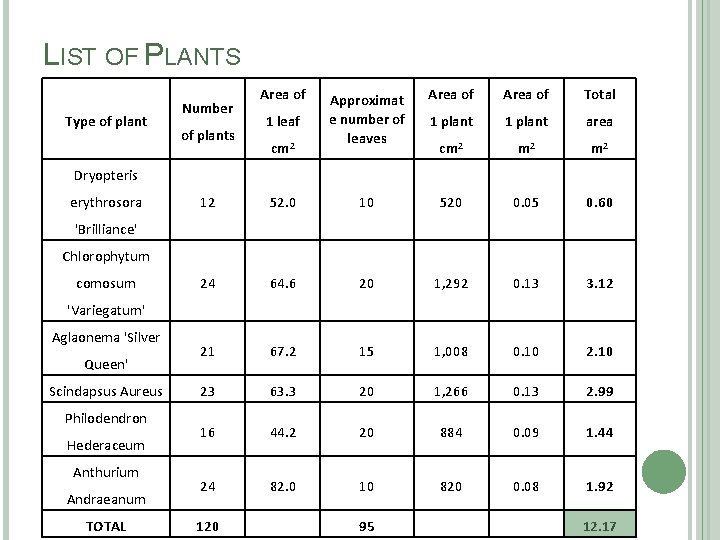
LIST OF PLANTS Type of plant Number of plants Area of 1 leaf cm 2 Approximat e number of leaves Area of Total 1 plant area cm 2 m 2 Dryopteris erythrosora 12 52. 0 10 520 0. 05 0. 60 24 64. 6 20 1, 292 0. 13 3. 12 21 67. 2 15 1, 008 0. 10 23 63. 3 20 1, 266 0. 13 2. 99 16 44. 2 20 884 0. 09 1. 44 24 82. 0 10 820 0. 08 1. 92 'Brilliance' Chlorophytum comosum 'Variegatum' Aglaonema 'Silver Queen' Scindapsus Aureus Philodendron Hederaceum Anthurium Andraeanum TOTAL 120 95 12. 17
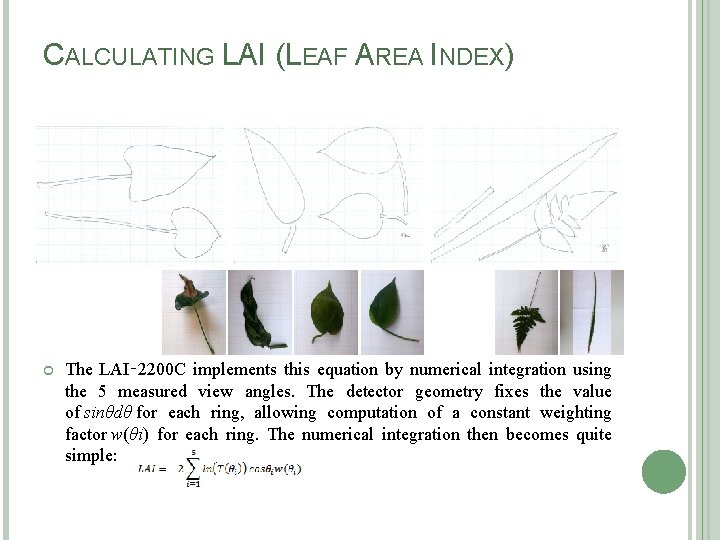
CALCULATING LAI (LEAF AREA INDEX) The LAI‑ 2200 C implements this equation by numerical integration using the 5 measured view angles. The detector geometry fixes the value of sinθdθ for each ring, allowing computation of a constant weighting factor w(θi) for each ring. The numerical integration then becomes quite simple:
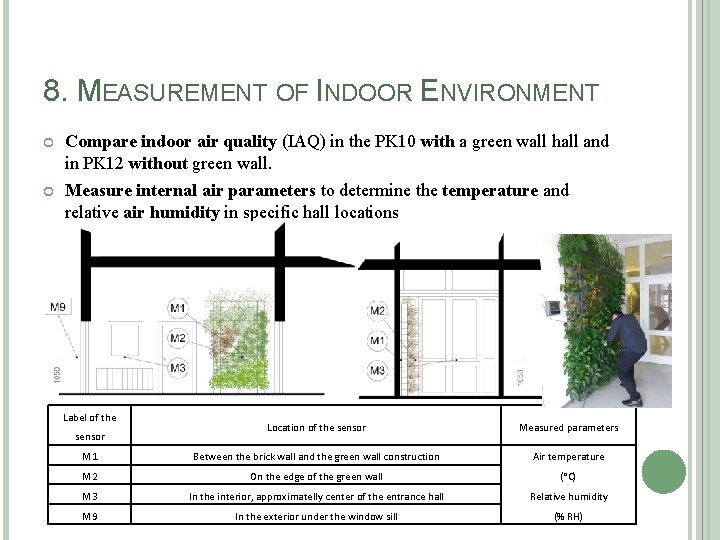
8. MEASUREMENT OF INDOOR ENVIRONMENT Compare indoor air quality (IAQ) in the PK 10 with a green wall hall and in PK 12 without green wall. Measure internal air parameters to determine the temperature and relative air humidity in specific hall locations Label of the Location of the sensor Measured parameters M 1 Between the brick wall and the green wall construction Air temperature M 2 On the edge of the green wall (°C) M 3 In the interior, approximatelly center of the entrance hall Relative humidity M 9 In the exterior under the window sill (% RH) sensor
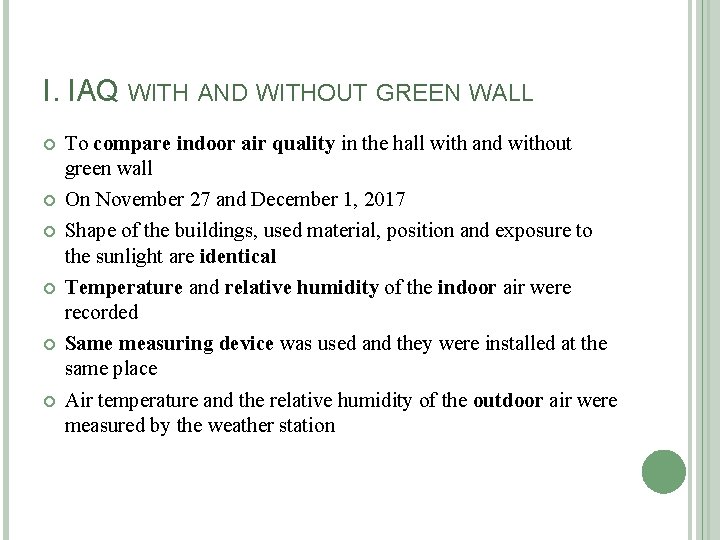
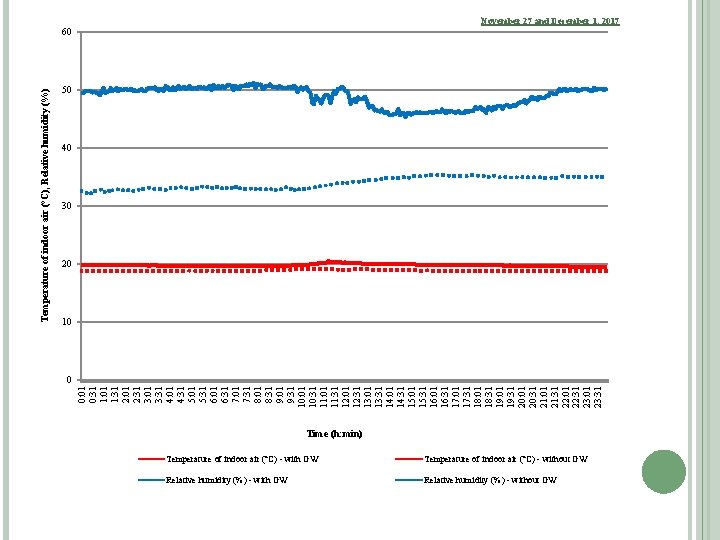
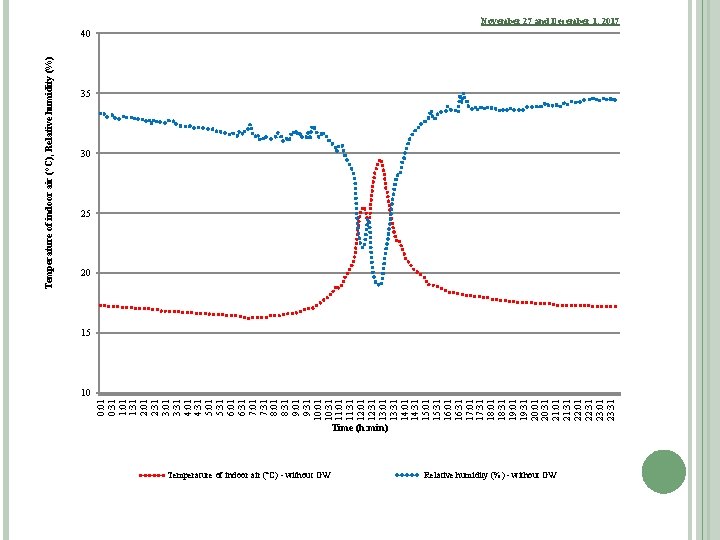
I. IAQ WITH AND WITHOUT GREEN WALL To compare indoor air quality in the hall with and without green wall On November 27 and December 1, 2017 Shape of the buildings, used material, position and exposure to the sunlight are identical Temperature and relative humidity of the indoor air were recorded Same measuring device was used and they were installed at the same place Air temperature and the relative humidity of the outdoor air were measured by the weather station
0: 01 0: 31 1: 01 1: 31 2: 01 2: 31 3: 01 3: 31 4: 01 4: 31 5: 01 5: 31 6: 01 6: 31 7: 01 7: 31 8: 01 8: 31 9: 01 9: 31 10: 01 10: 31 11: 01 11: 31 12: 01 12: 31 13: 01 13: 31 14: 01 14: 31 15: 01 15: 31 16: 01 16: 31 17: 01 17: 31 18: 01 18: 31 19: 01 19: 31 20: 01 20: 31 21: 01 21: 31 22: 01 22: 31 23: 01 23: 31 Temperature of indoor air (°C), Relative humidity (%) 60 November 27 and December 1, 2017 50 40 30 20 10 0 Time (h: min) Temperature of indoor air (°C) - with GW Temperature of indoor air (°C) - without GW Relative humidity (%) - without GW
0: 01 0: 31 1: 01 1: 31 2: 01 2: 31 3: 01 3: 31 4: 01 4: 31 5: 01 5: 31 6: 01 6: 31 7: 01 7: 31 8: 01 8: 31 9: 01 9: 31 10: 01 10: 31 11: 01 11: 31 12: 01 12: 31 13: 01 13: 31 14: 01 14: 31 15: 01 15: 31 16: 01 16: 31 17: 01 17: 31 18: 01 18: 31 19: 01 19: 31 20: 01 20: 31 21: 01 21: 31 22: 01 22: 31 23: 01 23: 31 Temperature of indoor air (°C), Relative humidity (%) 40 November 27 and December 1, 2017 35 30 25 20 15 10 Time (h: min) Temperature of indoor air (°C) - without GW Relative humidity (%) - without GW
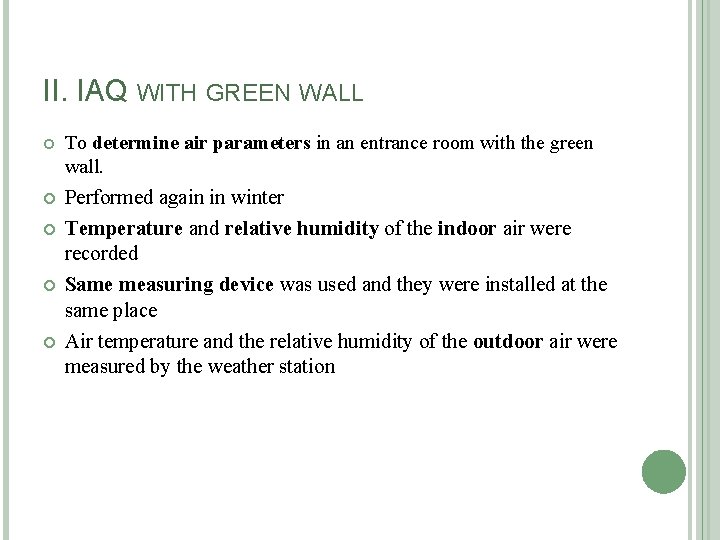
II. IAQ WITH GREEN WALL To determine air parameters in an entrance room with the green wall. Performed again in winter Temperature and relative humidity of the indoor air were recorded Same measuring device was used and they were installed at the same place Air temperature and the relative humidity of the outdoor air were measured by the weather station
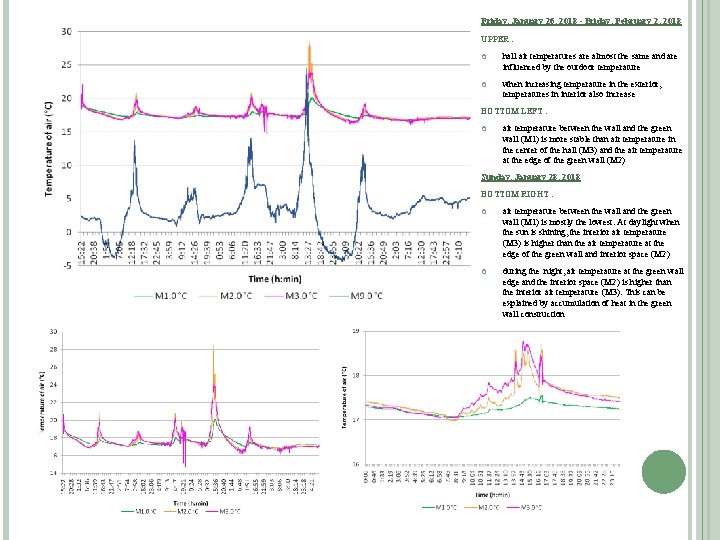
Friday, January 26, 2018 - Friday, February 2, 2018 UPPER : hall air temperatures are almost the same and are influenced by the outdoor temperature when increasing temperature in the exterior, temperatures in interior also increase BOTTOM LEFT : air temperature between the wall and the green wall (M 1) is more stable than air temperature in the center of the hall (M 3) and the air temperature at the edge of the green wall (M 2) Sunday, January 28, 2018 BOTTOM RIGHT : air temperature between the wall and the green wall (M 1) is mostly the lowest. At daylight when the sun is shining, the interior air temperature (M 3) is higher than the air temperature at the edge of the green wall and interior space (M 2) during the night, air temperature at the green wall edge and the interior space (M 2) is higher than the interior air temperature (M 3). This can be explained by accumulation of heat in the green wall construction
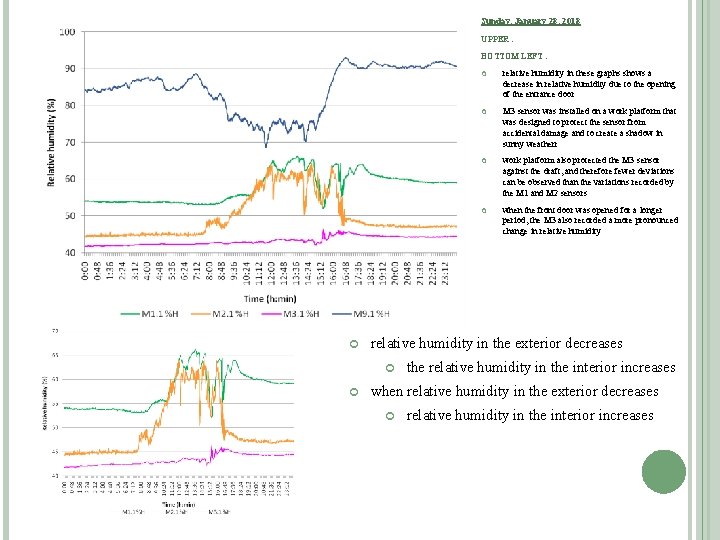
Sunday, January 28, 2018 UPPER : BOTTOM LEFT : relative humidity in these graphs shows a decrease in relative humidity due to the opening of the entrance door M 3 sensor was installed on a work platform that was designed to protect the sensor from accidental damage and to create a shadow in sunny weatherr work platform also protected the M 3 sensor against the draft, and therefore fewer deviations can be observed than the variations recorded by the M 1 and M 2 sensors when the front door was opened for a longer period, the M 3 also recorded a more pronounced change in relative humidity in the exterior decreases the relative humidity in the interior increases when relative humidity in the exterior decreases relative humidity in the interior increases
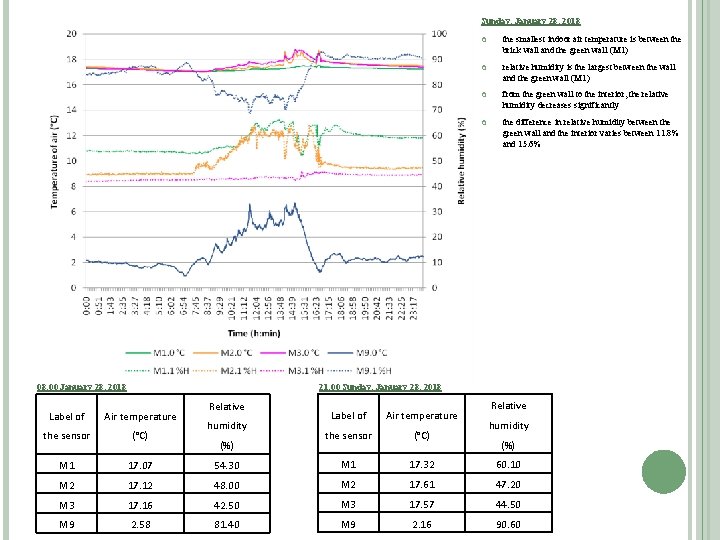
Sunday, January 28, 2018 08: 00 January 28, 2018 the smallest indoor air temperature is between the brick wall and the green wall (M 1) relative humidity is the largest between the wall and the green wall (M 1) from the green wall to the interior, the relative humidity decreases significantly the difference in relative humidity between the green wall and the interior varies between 11. 8% and 15. 6% 21: 00 Sunday, January 28, 2018 Relative Label of Air temperature the sensor (°C) 54. 30 M 1 17. 32 60. 10 17. 12 48. 00 M 2 17. 61 47. 20 M 3 17. 16 42. 50 M 3 17. 57 44. 50 M 9 2. 58 81. 40 M 9 2. 16 90. 60 Label of Air temperature the sensor (°C) M 1 17. 07 M 2 humidity (%)
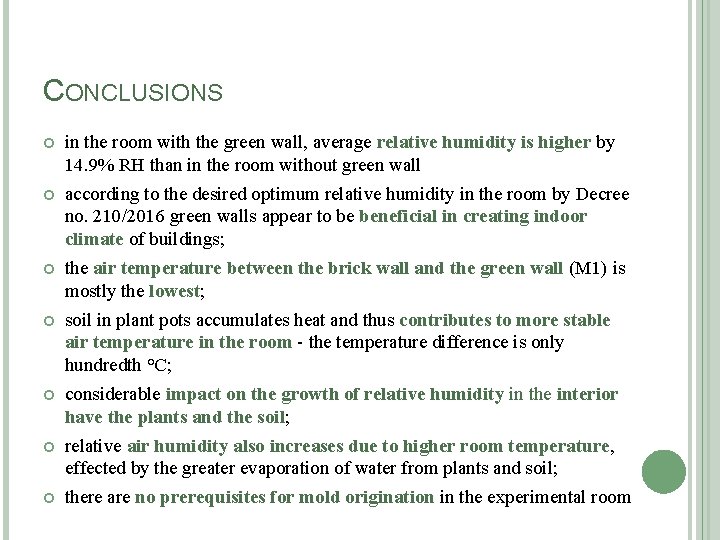
CONCLUSIONS in the room with the green wall, average relative humidity is higher by 14. 9% RH than in the room without green wall according to the desired optimum relative humidity in the room by Decree no. 210/2016 green walls appear to be beneficial in creating indoor climate of buildings; the air temperature between the brick wall and the green wall (M 1) is mostly the lowest; soil in plant pots accumulates heat and thus contributes to more stable air temperature in the room - the temperature difference is only hundredth °C; considerable impact on the growth of relative humidity in the interior have the plants and the soil; relative air humidity also increases due to higher room temperature, effected by the greater evaporation of water from plants and soil; there are no prerequisites for mold origination in the experimental room
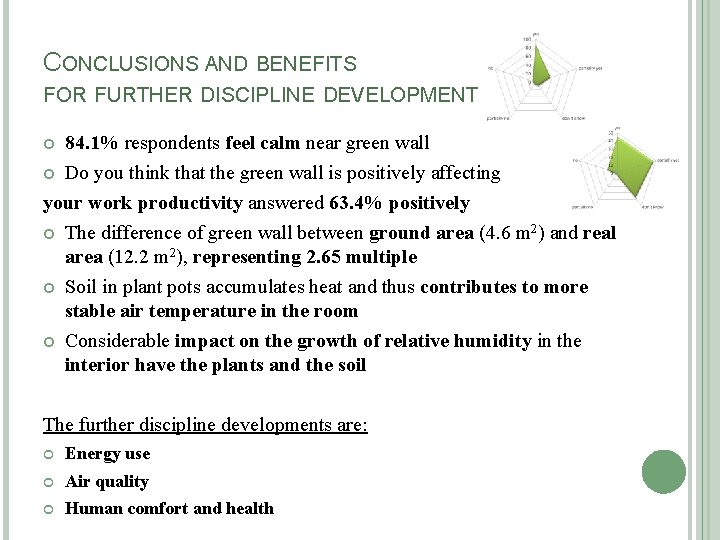
CONCLUSIONS AND BENEFITS FOR FURTHER DISCIPLINE DEVELOPMENT 84. 1% respondents feel calm near green wall Do you think that the green wall is positively affecting your work productivity answered 63. 4% positively The difference of green wall between ground area (4. 6 m 2) and real area (12. 2 m 2), representing 2. 65 multiple Soil in plant pots accumulates heat and thus contributes to more stable air temperature in the room Considerable impact on the growth of relative humidity in the interior have the plants and the soil The further discipline developments are: Energy use Air quality Human comfort and health
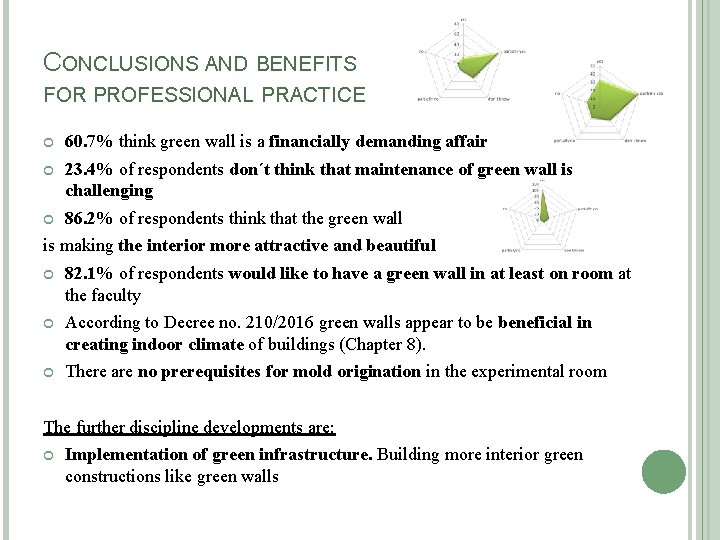
CONCLUSIONS AND BENEFITS FOR PROFESSIONAL PRACTICE 60. 7% think green wall is a financially demanding affair 23. 4% of respondents don´t think that maintenance of green wall is challenging 86. 2% of respondents think that the green wall is making the interior more attractive and beautiful 82. 1% of respondents would like to have a green wall in at least on room at the faculty According to Decree no. 210/2016 green walls appear to be beneficial in creating indoor climate of buildings (Chapter 8). There are no prerequisites for mold origination in the experimental room The further discipline developments are: Implementation of green infrastructure. Building more interior green constructions like green walls
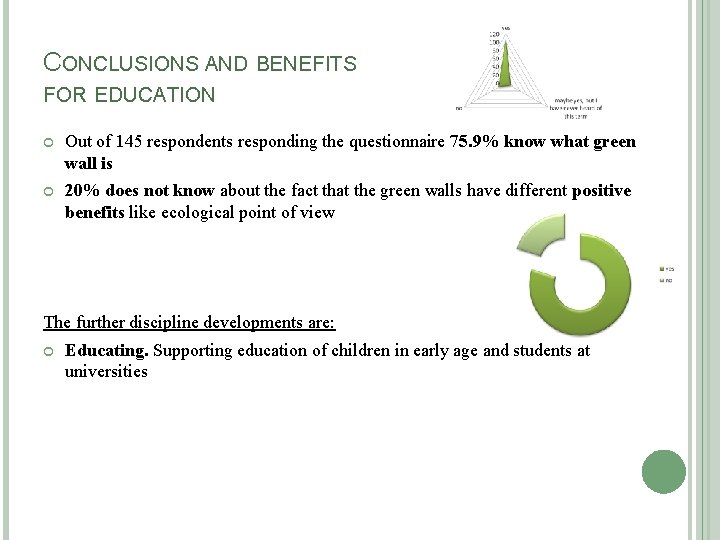
CONCLUSIONS AND BENEFITS FOR EDUCATION Out of 145 respondents responding the questionnaire 75. 9% know what green wall is 20% does not know about the fact that the green walls have different positive benefits like ecological point of view The further discipline developments are: Educating. Supporting education of children in early age and students at universities
THANK YOU!
OPPONENT 1 ( PROF. ING. DUŠAN PETRÁŠ, PHD. ) 1. There could be done more deeper analysis of the green walls not only in different climate zones and countries, but also based on the construction systems ? - to compare their location: Latitude is alike, longitude is different - to show that geen wall can be built anywhere according to very different climate - construction system was not important in this work - it doesn´t have effect on indoor parameters - soil and vegetation, have effect on temperature and humidity 2. How the questionnaire can be applied by subjective evaluation how people are satisfied with environment? -145 repondents answered it - questionnaire was focusing on these topics: -respondent’s general overview about the green walls, - green wall effect on respondent, -ecology/air quality and respondent´s opinion. - every topic is hidden in dissertation - partial conclusions of the topics are made
OPPONENT 2 (MATJAZ NEKREP, PHD. )
OPPONENT 3 ( DOC. ING. SILVIA VILČEKOVÁ, PHD. ) 1. Why did you measure and analyse only indoor air temperature and relative humidity? These basic physical parameters do not represent the quality of the indoor environment. You used instruments that measure carbon dioxide as well, however the results are not given in thesis. Why did not you analyse carbon dioxide concentrations? - continaution of previous Ph. D work impact on and next research analysis of: CO 2, redtemperature and humidity for further development ucing noise, particular matters etc. is needed 2. How did you use the calculation the leaves area on the green wall in analysing their impact on the indoor air parameters? - relationship between area of green wall in m 2 and volume of room in m 3 is important - functionality between these two variables may be used in future - to advise, how much green in m 2 is needed per m 3 - in terms of air quality 3. Measurements were carried out on November 27 and December 1, 2017. How long did the measurements last? - ? ? ?
OPPONENT 3 ( DOC. ING. SILVIA VILČEKOVÁ, PHD. ) 4. The difference of the outside air temperature was on average 5. 2°C and the relative humidity of the outdoor air was on average 1. 1%. On the basis of the measurements made, it can be stated that the green wall significantly influences the internal environment. Can you explain this statement? -difference in the hall air temperature is on average 0. 9 °C - difference in relative air humidity in the two halls varies from 10. 8% to 18. 2% - the difference of the outside air temperature was on average 5. 2 °C - relative humidity of the outdoor air was on average 1. 1% - green wall significantly influences the internal environment 5. It is possible to observe the phenomenon of heating the air in the room due to solar radiation, but also reducing the relative humidity to below 20%. Can you explain this claim in relation another claim? It was the effort to measure during a period when it was cloudy to not get a direct sunlight, so there was the least impact on the measurement results. -the sun was shining during the measuremet - no other explanation -mistake during the measurement