Geology 56606660 Applied Geophysics 21 Mar 2018 Last


- Slides: 14

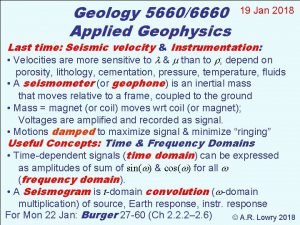
Geology 5660/6660 Applied Geophysics 21 Mar 2018 Last Time: Density; Gravity Anomalies & Modeling • Model structures as having anomalous mass density lithology, porosity, temperature (lowest for soils/seds, higher for lithified sed rocks, highest for crystalline rocks) • Gravity anomaly due to a sphere: (represents only the vertical component of the total vector anomaly!) • Discussed nonuniqueness: Different density (but same mass, same center of mass) can yield an identical gravity anomaly! Different shape at a shallower depth can yield the exact same gravity anomaly! (But all geophysical/geological models are nonunique… Gravity provides info others can’t!) For Fri 23 Mar: Burger 429 -446 (§ 7. 1 -7. 2) © A. R. Lowry 2018

Geology 5660/6660 Applied Geophysics Last Time (Cont’d): Gravity Modeling • Anomalies for: horizontal cylinder: vertical cylinder:

Gravity on a Dipping Fault Recall: Sediments: = 2200 kg/m 3 Basement: = 2700 kg/m 3

x=0 = 0 x r 2 2 = 500 = 0 t = 3 km

= 30° 40 = 90° 60

Note asymptotes depend on t ! t = 3 km; = 500 kg/m 3 t = 1. 5 km; = 1000 kg/m 3

Example: Green Canyon A low-resistivity anomaly consistent with Paleozoic bedrock suggested the mapped trace of the ECF is ~30 m east of the true fault location, near the dotted line.

Tide-Corrected Gravity Example: Green Canyon Drift Correction Model Drift-Corrected Gravity The drift correction was correlative with the measurements, which is a bit worrying… But only a small fraction (~2%) of the observations so we needn’t worry about it too much.

Latitude-Corrected Gravity Free Air Correction Free Air Anomaly The free air correction is actually larger than the raw obs (as is generally true in high-relief areas). The gravity base site appears as a worrisome outlier in both the correction & anomaly though. Inspection reveals a ~1. 6 m height error in week-one (non-RTK) GPS measurement of the elevation.

Latitude-Corrected Gravity Free Air Correction Free Air Anomaly The error was corrected by interpolating the heights at the nearest geophones (which were about the same elevation) to the x-position of the gravity base. The free air correction and anomaly with elev corrected at the gravity base are cleaner, but the western-most site may have a similar height error.

Free Air Anomaly Bouguer Slab Correction Terrain Correction Complete Bouguer Anomaly The complete Bouguer anomaly looks reasonable, and similar to what we might expect at a normal fault, save for a few outlier points (e. g. , Grav 6 at x = – 34. 4 m). However we have no valid reason to throw these out at this stage.

RMS Misfit: 0. 1046 m. Gal Fault Model Used: = – 196 kg/m 3 x 0 = 75 m = 49. 8° h = 1. 06 km The density contrast between basin sediments and Paleozoic bedrock clearly dominate the measured gravity. Misfit (largely in the footwall) may partly reflect fault damagezone effects, but probably mostly out-of-plane effects &/or measurement errors.

The x 0 = 75 m model prediction for the projection of the East Cache Fault to the surface at Green Canyon reinforces the possibility that fault trace is a few tens of m further west than previously mapped, and thus that the low resistivity, high chargeability anomaly found on the eastern side of the resistivity/IP profile is Paleozoic bedrock in the footwall of the fault. The model is very sensitive to choice of x 0: Putting the fault trace at ~10 m where it is mapped (& keeping other parameters the same) yields an RMS misfit of 0. 1443 m. Gal; in my experience, a model with (19 – 4 =) 15 degrees of freedom that yields a 38% larger misfit than the minimum error solution can be ruled out at very high confidence. However given the scale of mass averaging and likely nearsurface complexities & geometrical effects associated with fault rupture, the most we can really say with confidence is that a fault trace somewhere west of the mapped trace is favored by the data.

Magnetics: • Like gravity, a potential field method governed by Laplace’s equation: 2 u = f (sources) • Unlike gravity, source term is a vector rather than a scalar Gravity: Monopole source field is always directed radially toward a “sink” location S N Magnetics: Dipole source field direction & strength depend on one “source”, one “sink”

