FOOD INSECURITY IN JUNEAU FOOD RESOURCE SUMMIT FACE


 •")

 •")
 no income 147 16. 9%")
")
 • Juneau")


 • Fresh fruits and")


- Slides: 20
FOOD INSECURITY IN JUNEAU FOOD RESOURCE SUMMIT
FACE OF HUNGER IN ALASKA FOOD BANK OF ALASKA STATISTICS FEEDING AMERICA SURVEY 2014 • 32% are under the age of 18 • 13% are seniors • 60% have worked for pay in the last 12 months • 23% have at least one veteran in the house
FACE OF HUNGER IN JUNEAU 2014 HUNGER IN AMERICA STUDY BY FEEDING AMERICA Weekly Monthly Annually Total number of individuals 1900 8500 101, 400 Unduplicated 800 2100 5400 Total number of households 1200 5100 60, 700 Unduplicated 400 1100 2600
HOUSING FOR CLIENTS IN JUNEAU • Non-temporary housing (400 households - 41. 9%) • Temporary housing (553 households - 58. 1%) • Households w/out stove, microwave or hot plate (226 - 23. 4%) • Households w/out access to refrigeration (197 - 21. 1%) • Respondents lived at least two places in last 12 months (392 - 31%) • Respondents started living with another person or family (229 25. 6%) • Respondents experienced foreclosure or eviction in the past five years (72 - 7. 7%)
HOUSEHOLD EMPLOYMENT FOR CLIENTS USING SERVICES IN JUNEAU • Worked for pay in last 4 weeks (344 - 32. 3%) • Worked for pay in the last 12 months (661 -62%) • Currently out of work (722 - 67. 7%) • • Elderly, children, disabled Currently out of work, but looking (235 - 22. 1%)
HOUSEHOLD HEALTH FOR CLIENTS • Household member in poor health (128 - 13%) • Household member with diabetes (121 - 16. 1%) • Household member with high blood pressure (303 34. 9%) • Household: no member has health insurance (403 39%) • Household with unpaid medical bills (576 - 55. 8%)
HOUSEHOLD MONTHLY INCOME 367 HOUSEHOLDS LIVING IN POVERTY (43%) no income 147 16. 9% $1 -$1000 225 25. 9% $1001 -$2000 260 29. 8% $2001 -$3000 188 21. 6% More than $3000 51 5. 8%
SPENDING TRADEOFFS CHOOSE BETWEEN PAYING FOR FOOD AND PAYING FOR OTHER EXPENSES (12 MONTHS) Medicine/medical care 353 36. 8% Utilities 426 49. 8% Housing 351 34. 6% Transportation 433 50. 5%
HOUSEHOLD SNAP PARTICIPATION • Juneau Households currently receiving SNAP: 458 (51. 8%) • Juneau Households not receiving SNAP: 426 (48. 2%)
STRATEGIES FOR FOOD ASSISTANCE • I usually wait to come to this program until I run out of food (553: 57%) • I plan to get food here on a regular basis (416: 43%)
COPING STRATEGIES Eaten food past expiration date 389 40. 2% Sold or pawned personal property 270 29. 1% Purchased food in dented or damaged packages 418 44. 6% Purchased inexpensive, unhealthy food 929 95. 9% Received help from family or friends 369 39. 3% Watered down food or drinks 138 14. 6%
MOST REQUESTED ITEM • Protein food items like meat (59%) • Fresh fruits and vegetables (44. 5%) • Dairy products such as milk, cheese, yogurt (27. 5%) • Beverages such as water or juice (21. 6%) • Shampoo, soap, diapers (19%) • Grains such as bread or pasta (15. 1%)
JUNEAU’S RESPONSE TO FOOD INSECURITY
JUNEAU RESOURCE SUMMIT • With the help of United Way, coalition of many of the food agencies gather once a month to share resources and ideas while identifying gaps in service. • Values -Improve our community through interconnection of services -Provide access to sustainable nutritious daily food and distribute surplus food better -Create opportunities for human connection
RESOURCES AVAILABLE
SOUTHEAST ALASKA FOOD BANK HUB FOR AGENCIES TO PURCHASE FOOD FOR DISTRIBUTION
GOALS • Food bank expands space to better distribute perishables and have more purchasing power • Better communication, cooperation, and accountability among agencies • Ease for donors • Salvage grocery store • Close gaps in children and senior food insecurity
SHEPHERD OF THE VALLEY PANTRY STATISTICS 2014 - 7428 people 2013 - 5189 people 2012 - 3602 people 2011 - 1668 people 2010 - 1247 people • $2, 812. 18 yearly bill to food bank (that's 20, 087 pounds at 14 cents a pound)
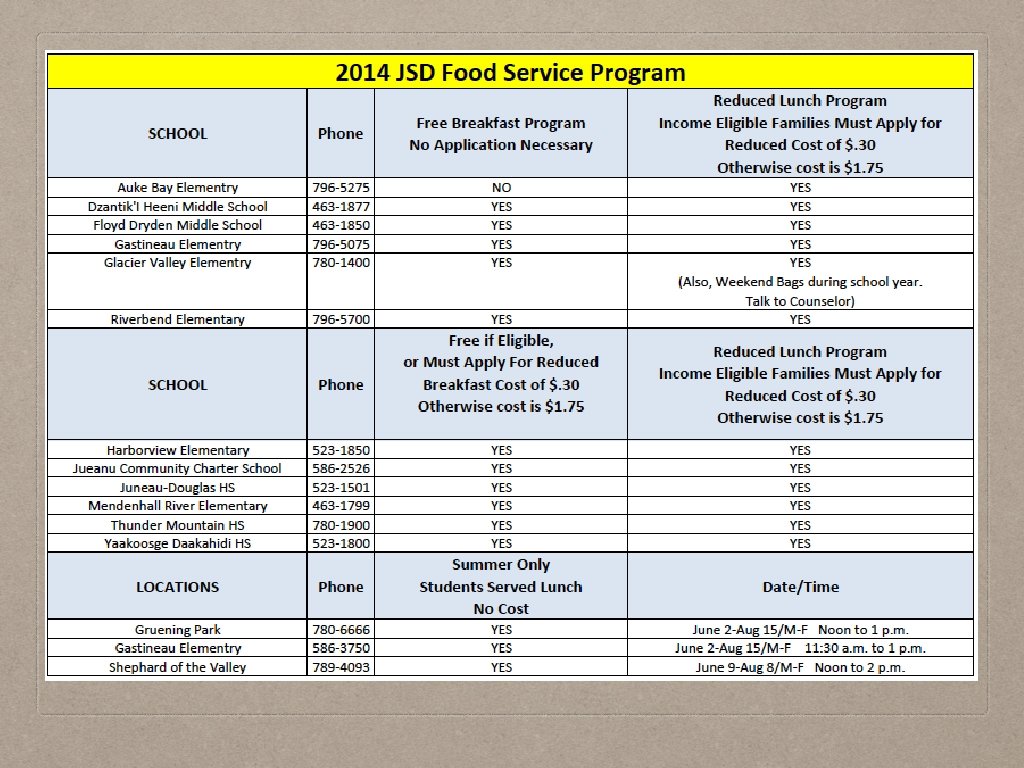
SUMMER LUNCH PROGRAM Goals: 1. Provide healthy meals for neighborhood youth through the summer gap in a safe place 2. Encourage time for relationships with caring and supportive people 3. Shape a constructive use of time without screens 4. Seek to follow Jesus’ command to “feed his sheep” 1750 meals served to 200 youth