Financial Report on Lucky Cement INTRODUCTION Lucky Cement


 2. Long Term Investment(27% increase) 3. Cash Bank")


 • Deferred Liabilities(3% decrease) • Short Term")


- Slides: 15
Financial Report on Lucky Cement
INTRODUCTION Lucky Cement is one of the largest producers and leading exporters of quality cement in Pakistan and is listed on the Pakistan Stock Exchange (PSX). The Company has also issued Global Depository Receipts (GDRs), listed and traded on the Professional Securities Market of the London Stock Exchange and is the first Shariah Compliant Company of Pakistan certified by the SECP. Over the years, the Company has grown substantially and is expanding its business operations with production facilities at strategic locations in Karachi to cater to the Southern regions and Pezu, Khyber Pakhtunkhwa to furnish the Northern areas of the Country. Lucky Cement is Pakistan’s first Company to export sizeable quantities of loose cement, being the only cement manufacturer to have its own loading and storage export terminal at Karachi Port.
Five main financial statements: • Income statement • Balance sheet • Statement of changes in equity, • Cash flow statement • Statement of comprehensive income
1. Property Plant and Equipment(29% increase) 2. Long Term Investment(27% increase) 3. Cash Bank Balance(75% decrease) 4. Stores and spares(14% decrease) 5. Stock in Trade(34% increase)
Property Plant and Equipment • Property, plant and equipment is the long-term asset or noncurrent asset section of the balance sheet that reports the tangible, long-lived assets that are used in the company's operations. • These assets are commonly referred to as the company's fixed assets or plant assets. • Their is a 29% increase from last year. • The increase is mainly due to capital expenditure and enhancement, alternative energy, vertical grinding mills, vertical cement mills, and equity investments in KIA and other offshore projects in Iraq and Congo.
Long Term Investments 1. 2. 3. 4. 5. 6. Lucky Holdings LCL Investment Holdings Limited LCL Holdings Limited Kia Lucky Motors Pakistan Limited Lucky Cement Holdings (Pvt) Limited Yunus Energy Limited Long Term Investments has increased by around 27%.
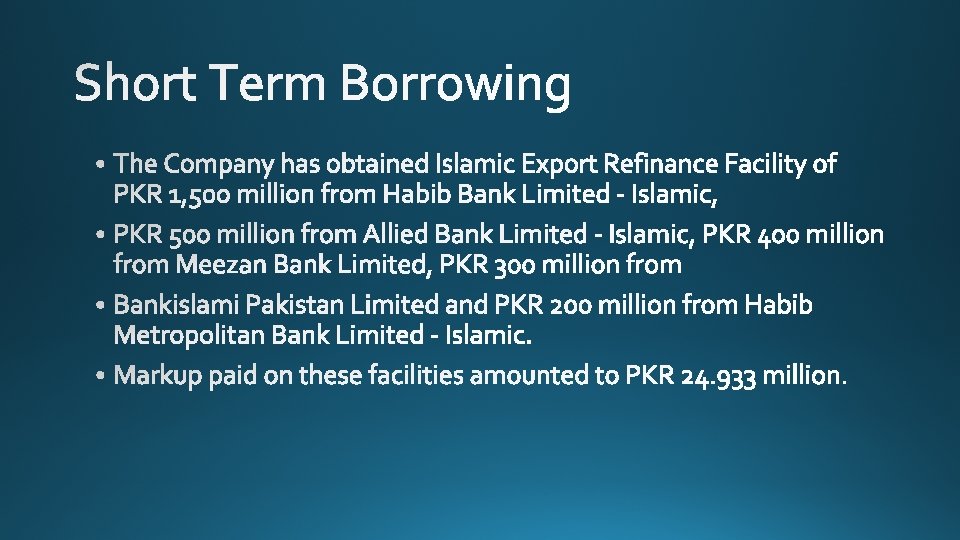
• Trade and other Payables(32% increase) • Deferred Liabilities(3% decrease) • Short Term Borrowing(increased by 29%) • Taxation- Net(48% decrease) • Unpaid dividends (9% increase)
Trade and other Payables has 32% increase from last year due to high tax losses registered by subsidiaries.
Gross sales are the total sales that was done in the financial year of 2018 -2019 which are Rs 67, 547 billion. The net sales value after the deduction of sales tax and federal excise duty and rebates and commission. The procedure used to estimate refunds and returns are checked and adjusted regularly in the light of predetermined and legal obligations, historical trends, past experiences and expected market conditions. Market conditions are evaluated using distributors and other third-party analyses, market research data and internally generated information. Reported Net Sales for 2019 is Rs 48, 021 billion which is almost equivalent to the Net Sales in 2018 which were Rs 47, 541 billion. An increase in Net Sales didn’t meant an increase in Gross Profit for the company. For the fiscal year 2019 the company's Gross Profit Margin see a decrease of 6%.
• The current ratio has decreased significantly which is due to an increase in current liabilities. • ● The Acid-test ratio has fallen below 1: 1 although last year it was higher than 2: 1, this indicates that the company does not have enough liquid assets to pay their current liabilities. • ● There has been a small decrease in inventory turnover as well. • ● Accounts Receivable Turnover has also shown a decrease from last year but looking at past records show that the company has managed to maintain this ratio through the last few years. • ● Debt to Assets ratio has significantly decreased which shows. This is because the debts have decreased. • ● Interest Expense is not mentioned in the financial report. • ● There has been a decrease in profit margin. This is due to a significant increase in expenses that the company has to bear such as distribution cost while the gross revenue has remained the same. • ● Gross Profit Margin ratio has also fallen as cost of goods sold has increased. • ● The Assets Turnover has decreased due to a decrease in overall net sales. • ● Return on Assets has decreased as net income has decreased.