Estimation of alternative splicing isoform frequencies from RNASeq
- Slides: 26
Estimation of alternative splicing isoform frequencies from RNA-Seq data Marius Nicolae Computer Science and Engineering Department University of Connecticut Joint work with Serghei Mangul, Ion Mandoiu and Alex Zelikovsky
Outline • • Introduction EM Algorithm Experimental results Conclusions and future work
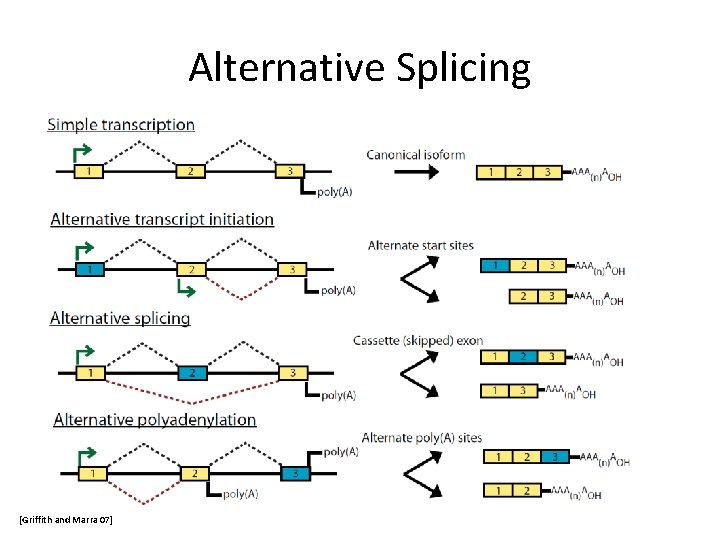
Alternative Splicing [Griffith and Marra 07]
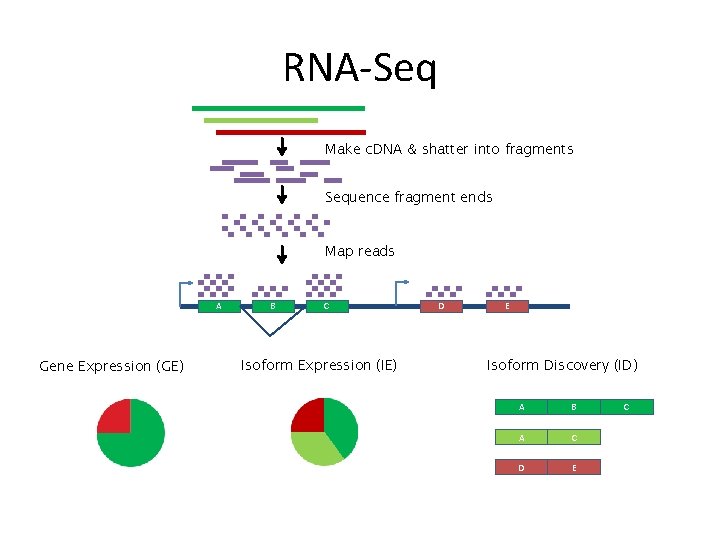
RNA-Seq Make c. DNA & shatter into fragments Sequence fragment ends Map reads A Gene Expression (GE) B C Isoform Expression (IE) D E Isoform Discovery (ID) A B A C D E C
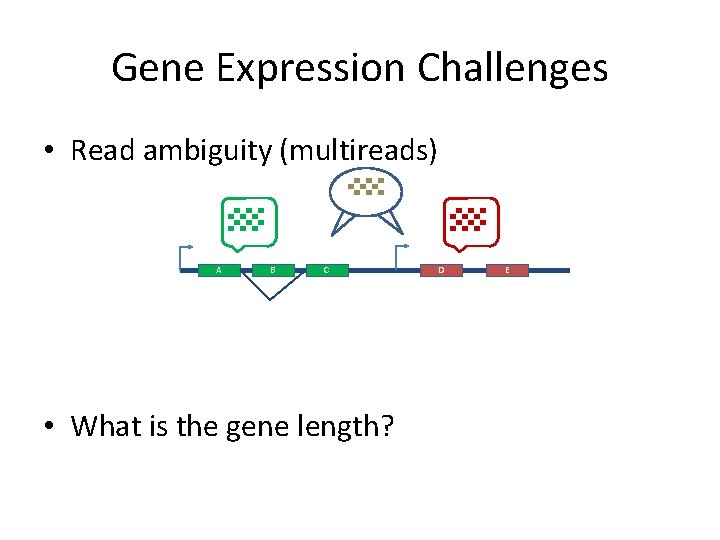
Gene Expression Challenges • Read ambiguity (multireads) A B C • What is the gene length? D E
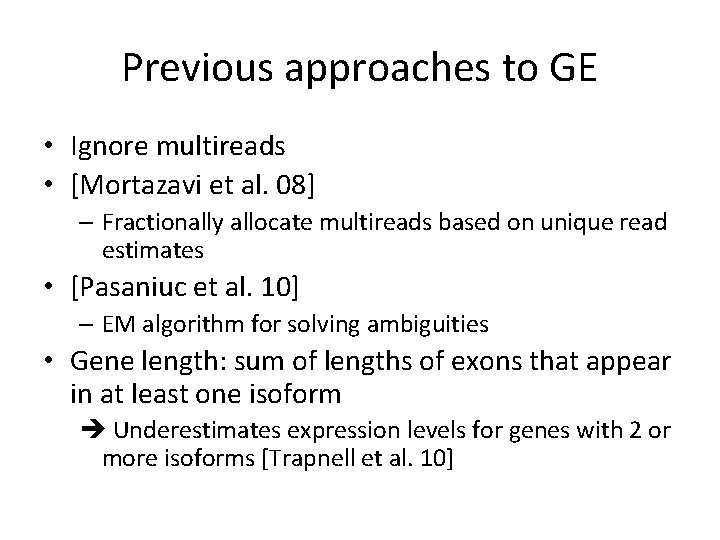
Previous approaches to GE • Ignore multireads • [Mortazavi et al. 08] – Fractionally allocate multireads based on unique read estimates • [Pasaniuc et al. 10] – EM algorithm for solving ambiguities • Gene length: sum of lengths of exons that appear in at least one isoform Underestimates expression levels for genes with 2 or more isoforms [Trapnell et al. 10]
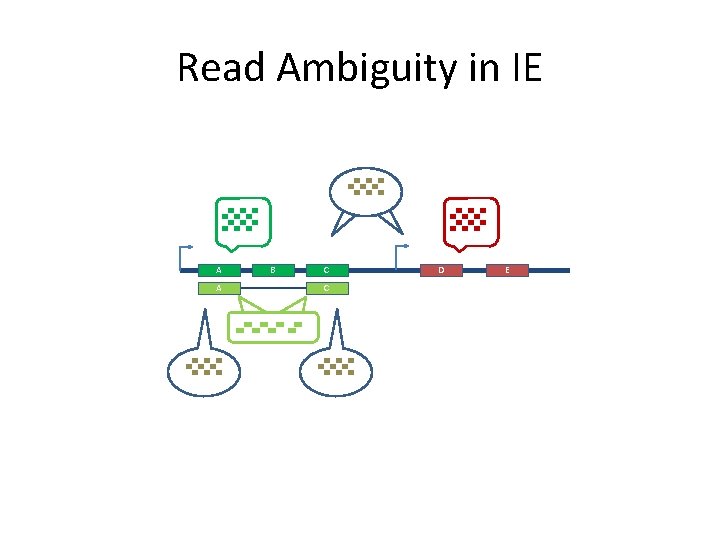
Read Ambiguity in IE A A B C C D E
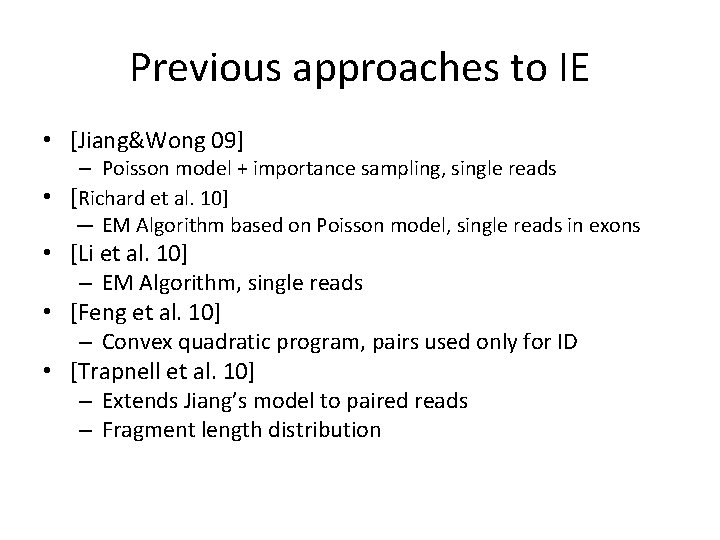
Previous approaches to IE • [Jiang&Wong 09] – Poisson model + importance sampling, single reads • [Richard et al. 10] — EM Algorithm based on Poisson model, single reads in exons • [Li et al. 10] – EM Algorithm, single reads • [Feng et al. 10] – Convex quadratic program, pairs used only for ID • [Trapnell et al. 10] – Extends Jiang’s model to paired reads – Fragment length distribution
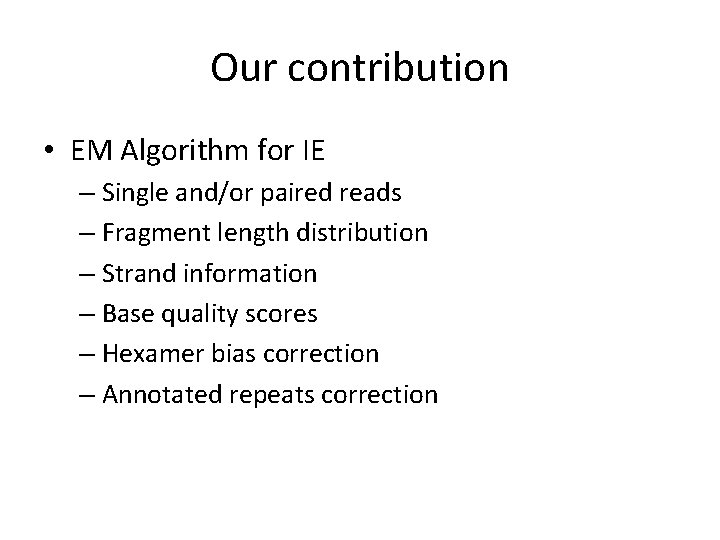
Our contribution • EM Algorithm for IE – Single and/or paired reads – Fragment length distribution – Strand information – Base quality scores – Hexamer bias correction – Annotated repeats correction
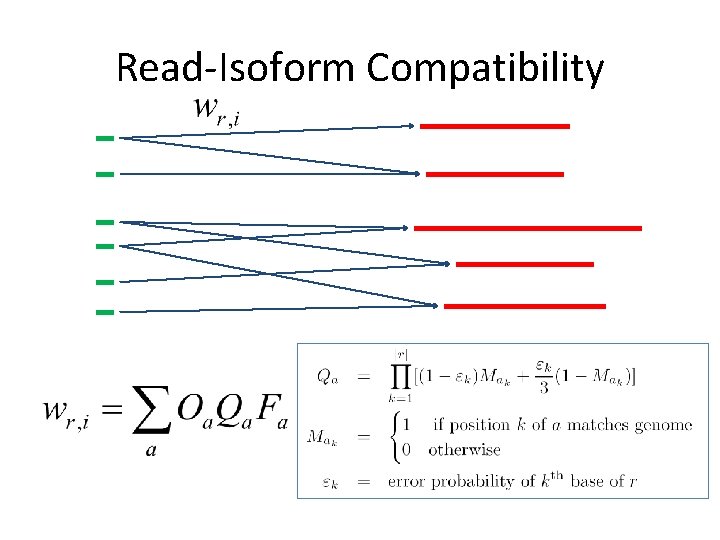
Read-Isoform Compatibility
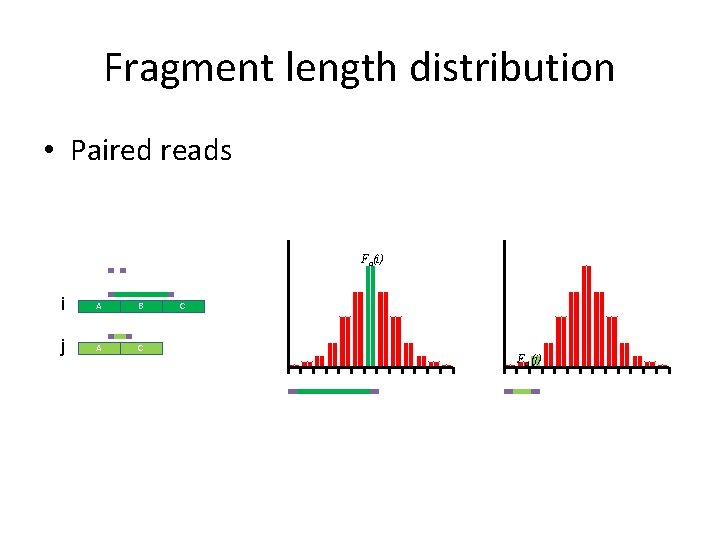
Fragment length distribution • Paired reads Fa(i) i A B j A C C Fa (j)
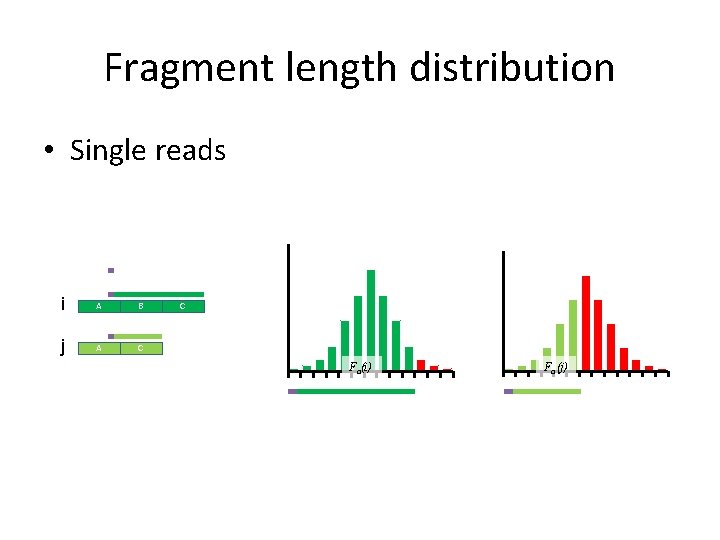
Fragment length distribution • Single reads i A B j A C C Fa(i) Fa (j)
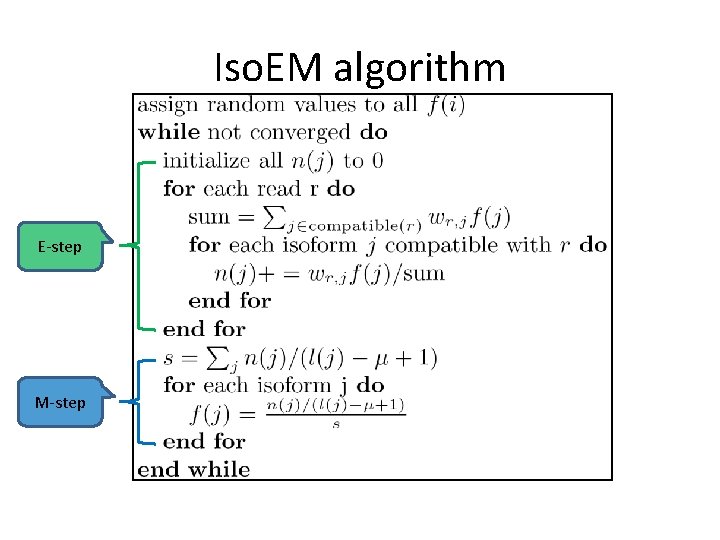
Iso. EM algorithm E-step M-step
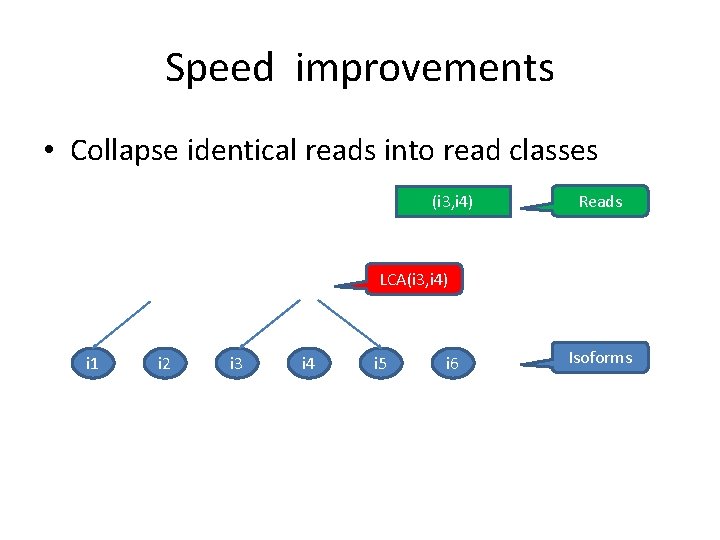
Speed improvements • Collapse identical reads into read classes (i 3, i 5) (i 3, i 4) (i 1, i 2) Reads LCA(i 3, i 4) i 1 i 2 i 3 i 4 i 5 i 6 Isoforms
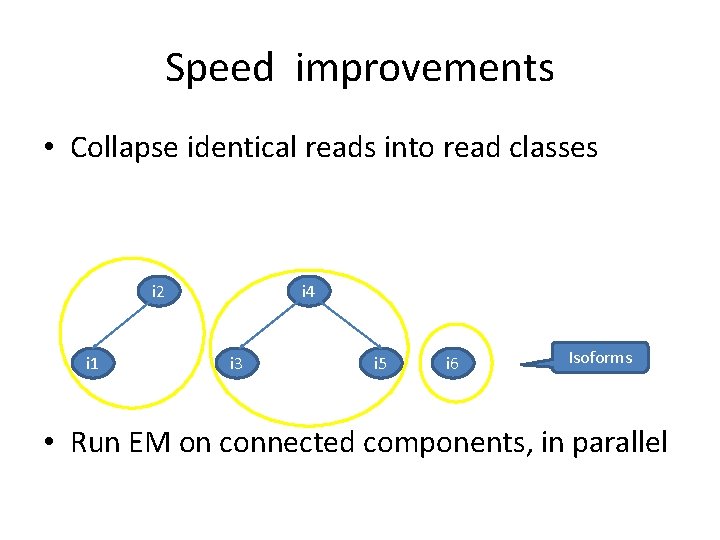
Speed improvements • Collapse identical reads into read classes i 2 i 1 i 4 i 3 i 5 i 6 Isoforms • Run EM on connected components, in parallel
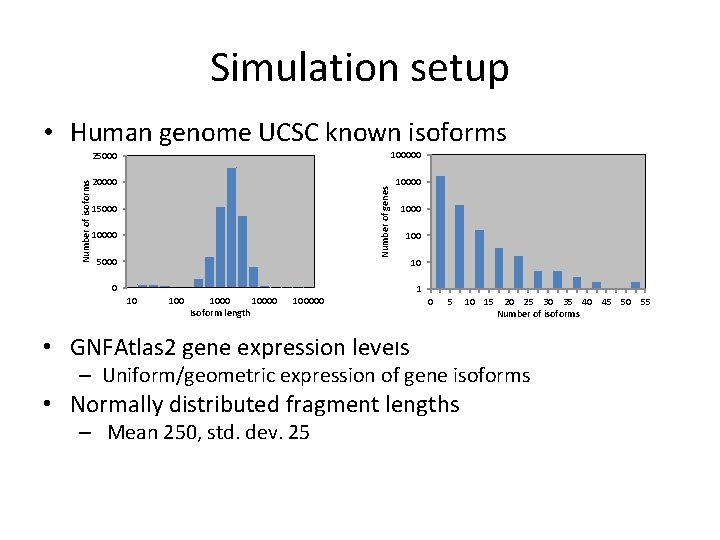
Simulation setup 25000 100000 20000 10000 Number of genes Number of isoforms • Human genome UCSC known isoforms 15000 10000 5000 100 0 10 10000 Isoform length 100000 10 1 0 5 • GNFAtlas 2 gene expression levels 10 15 20 25 30 35 40 45 50 55 Number of isoforms – Uniform/geometric expression of gene isoforms • Normally distributed fragment lengths – Mean 250, std. dev. 25
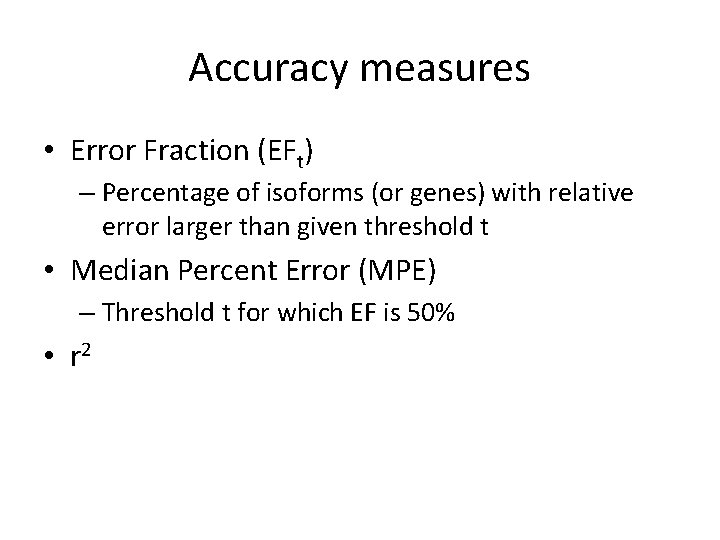
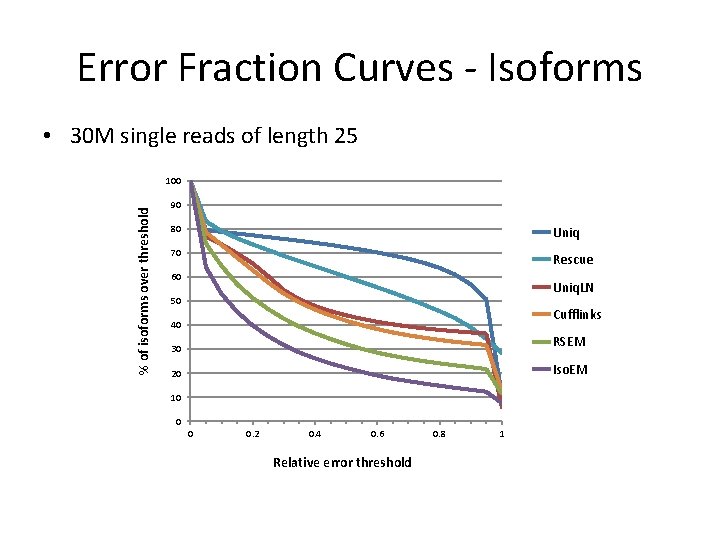
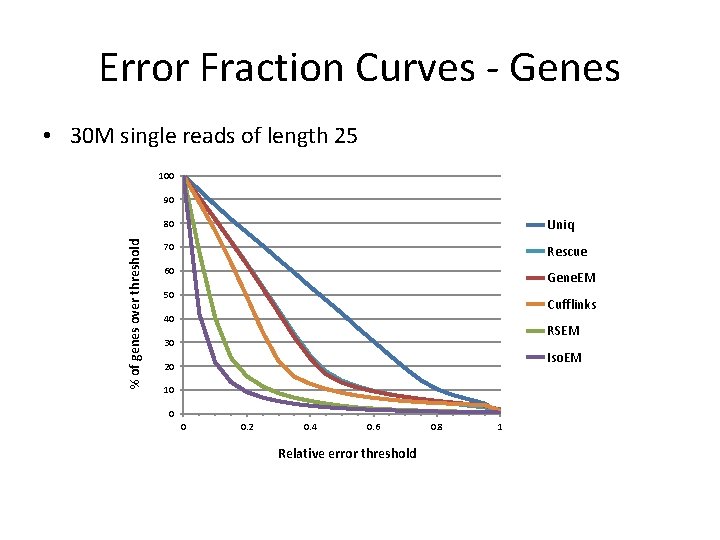
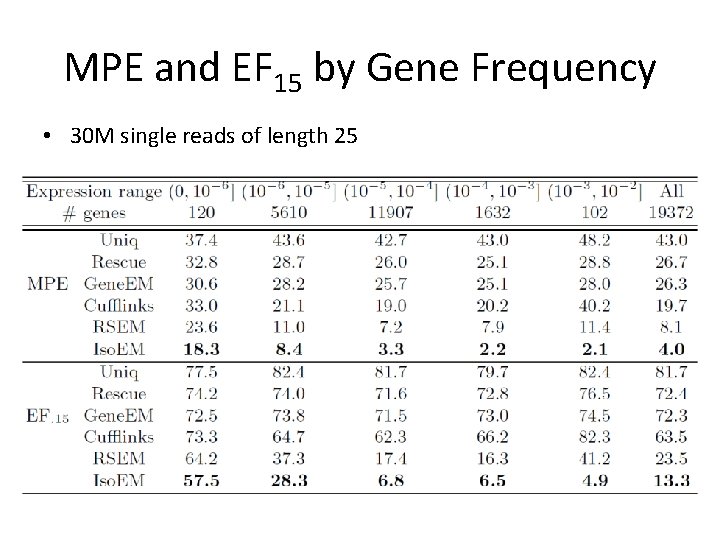
Accuracy measures • Error Fraction (EFt) – Percentage of isoforms (or genes) with relative error larger than given threshold t • Median Percent Error (MPE) – Threshold t for which EF is 50% • r 2
Error Fraction Curves - Isoforms • 30 M single reads of length 25 % of isoforms over threshold 100 90 80 Uniq 70 Rescue 60 Uniq. LN 50 Cufflinks 40 RSEM 30 Iso. EM 20 10 0 0 0. 2 0. 4 0. 6 Relative error threshold 0. 8 1
Error Fraction Curves - Genes • 30 M single reads of length 25 100 % of genes over threshold 90 80 Uniq 70 Rescue 60 Gene. EM 50 Cufflinks 40 RSEM 30 Iso. EM 20 10 0 0 0. 2 0. 4 0. 6 Relative error threshold 0. 8 1
MPE and EF 15 by Gene Frequency • 30 M single reads of length 25
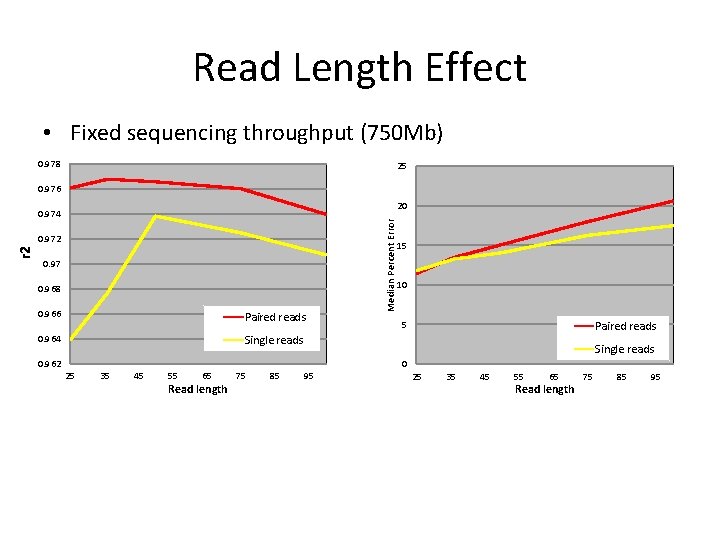
Read Length Effect • Fixed sequencing throughput (750 Mb) 0. 978 25 0. 976 r 2 0. 97 0. 968 0. 966 Paired reads 0. 964 Single reads 35 45 55 65 Read length 75 85 15 10 5 Paired reads Single reads 0. 962 25 Median Percent Error 20 0. 974 95 0 25 35 45 55 65 Read length 75 85 95
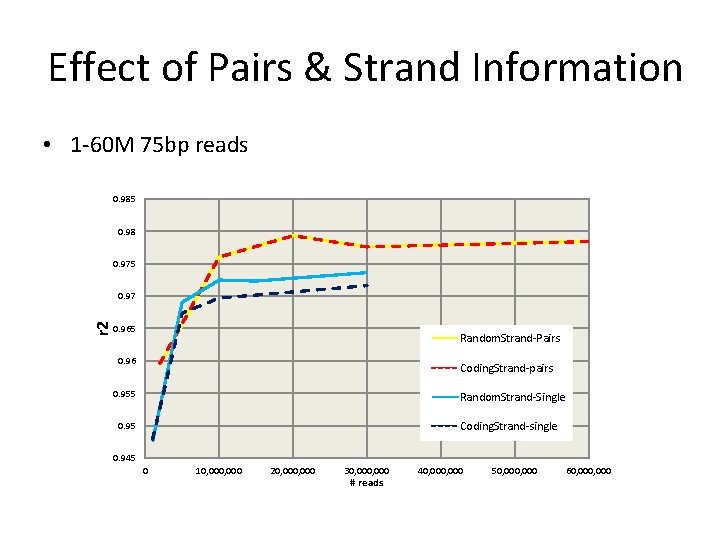
Effect of Pairs & Strand Information r 2 • 1 -60 M 75 bp reads # reads
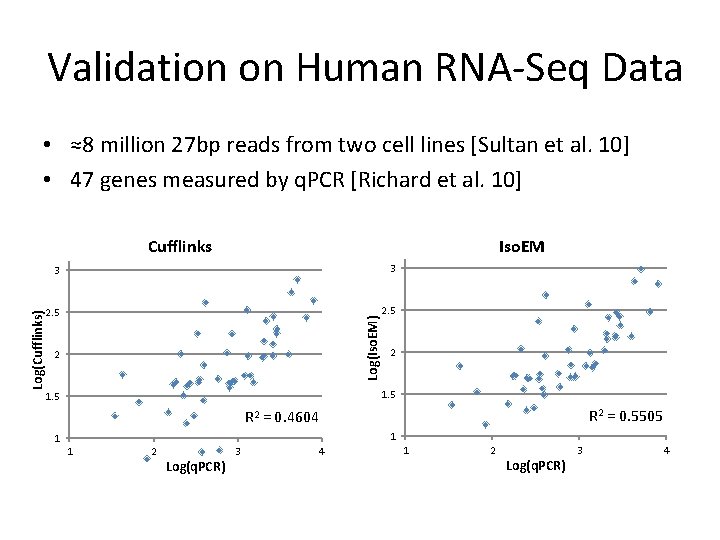
Validation on Human RNA-Seq Data • ≈8 million 27 bp reads from two cell lines [Sultan et al. 10] • 47 genes measured by q. PCR [Richard et al. 10] Iso. EM 3 3 2. 5 Log(Iso. EM) Log(Cufflinks) Cufflinks 2 2 1. 5 R 2 = 0. 5505 R 2 = 0. 4604 1 1 1 2 Log(q. PCR) 3 4
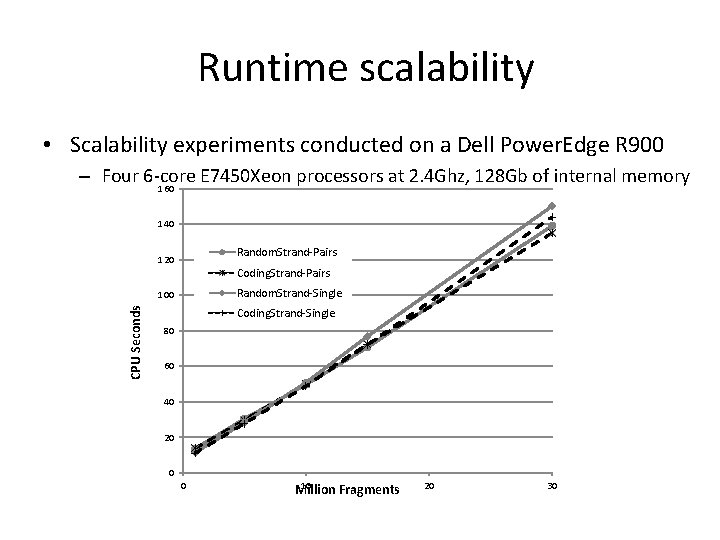
Runtime scalability • Scalability experiments conducted on a Dell Power. Edge R 900 – Four 6 -core E 7450 Xeon processors at 2. 4 Ghz, 128 Gb of internal memory 160 140 Random. Strand-Pairs 120 Coding. Strand-Pairs Random. Strand-Single CPU Seconds 100 Coding. Strand-Single 80 60 40 20 0 0 10 Million Fragments 20 30
Conclusions & Future Work • Presented EM algorithm for estimating isoform/gene expression levels – Integrates fragment length distribution, base qualities, pair and strand info – Java implementation available at http: //dna. engr. uconn. edu/software/Iso. EM/ • Ongoing work – Comparison of RNA-Seq with DGE – Isoform discovery – Reconstruction & frequency estimation for virus quasispecies
Acknowledgments n NSF awards 0546457 & 0916948 to IM and 0916401 to AZ