Demography Demography is the study of the dynamic


- Slides: 13
Demography
• Demography is the study of the dynamic changes that occur in populations. It is known as the statistical study of the processes which affect the density and size of a population over time. • Ecologists use demographic analysis to predict the growth of a population. Four things are used to determine the growth rate of the population: • Natality – birth rate • Mortality – death rate • Immigration – movement of individuals into a population • Emigration – movement of individuals out of the population
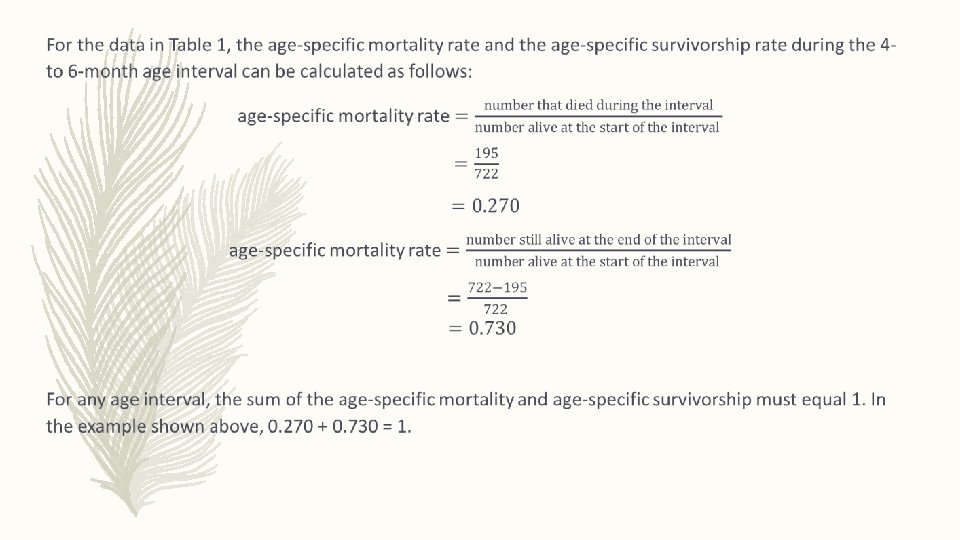
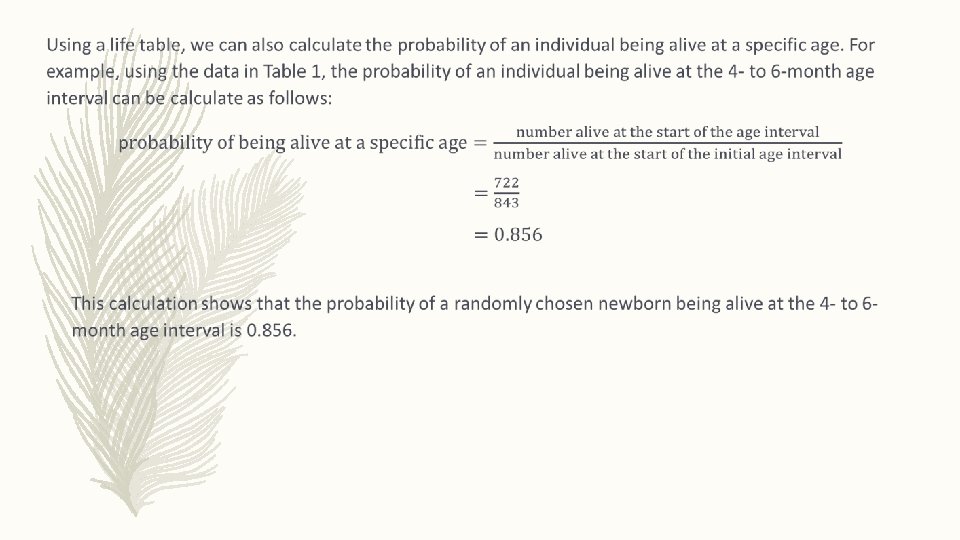
Life Tables • Life Tables are summaries of the demographic characteristics of a population. • Depending on the life span of the organism, different methods may be used in measuring the species’ lifespan. • Mortality rate is a measure of deaths in a population per unit of time. It can be viewed in two different ways: age-specific mortality (proportion of individuals that were alive at the start of an age interval but died during the age interval) and age-specific survivorship (proportion of individuals that were alive at the start of an age interval and survived until the start of the next age interval).
Table 1 Life Table for a Cohort of 843 individuals of Poa annua (annual bluegrass) Age interval (in months) Number alive at start of age interval Number dying during age interval Age-specific mortality rate Age-specific survivorship rate Proportion of original cohort alive at start of age interval Age-specific fecundity (seed production) 0 -3 843 121 0. 144 0. 856 1. 000 0 4 -6 722 195 0. 270 0. 730 0. 856 300 7 -9 527 211 0. 400 0. 625 620 10 -12 316 172 0. 544 0. 456 0. 375 430 13 -15 144 90 0. 625 0. 375 0. 171 210 16 -18 54 39 0. 722 0. 278 0. 064 60 19 -21 15 12 0. 800 0. 200 0. 018 31 22 -24 3 3 1. 000 0. 004 10 25+ 0 - - -
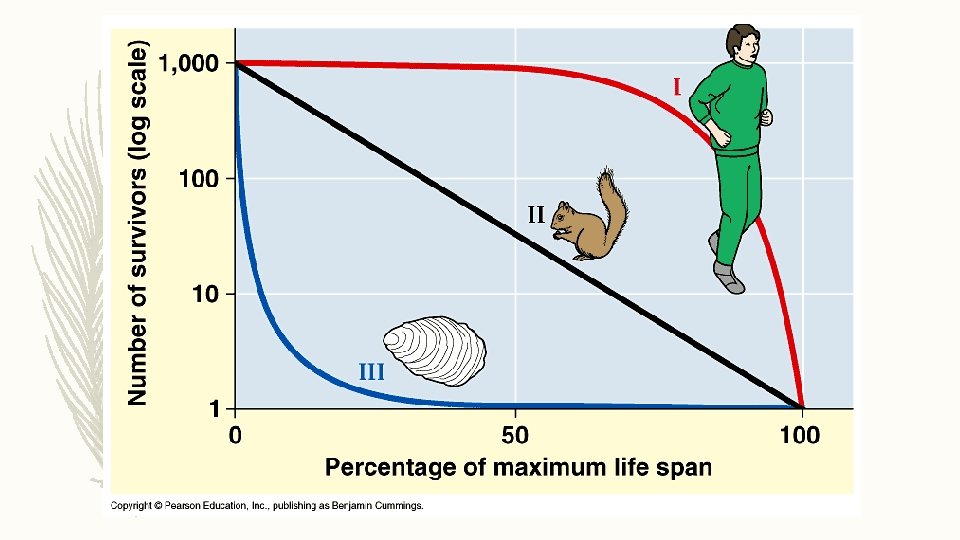
Survivorship Curves • Information collected about survival can be depicted graphically in a survivorship curve, which demonstrates the survival of individuals over the lifespan of the species • There are three general survivorship curves: Type I, Type II, and Type III
Type I Curves • Type I curves are relatively flat at the start, reflecting a low death rate in the early and middle years, and drop steeply as the death rate increases in the older age groups. • These curves are typical for large animals that produce few young and provide their young with extended care, reducing juvenile mortality Type II Curves • Type II curves reflect a relatively constant rate of mortality in all age groups. This produces a steadily declining survivorship. • Organisms that have type II curves generally feed on type III but are preyed on by type I organisms Type III Curves • Type III curves drop rapidly at the start, reflecting a very high death rate early in life, and then flatten out as the death rate declines for the few individuals that survive the critical stage. • This type of curve is characteristic of species that produce a large number of offspring. • Many plants, insects, marine invertebrates, and fish have type III survivorship curves.
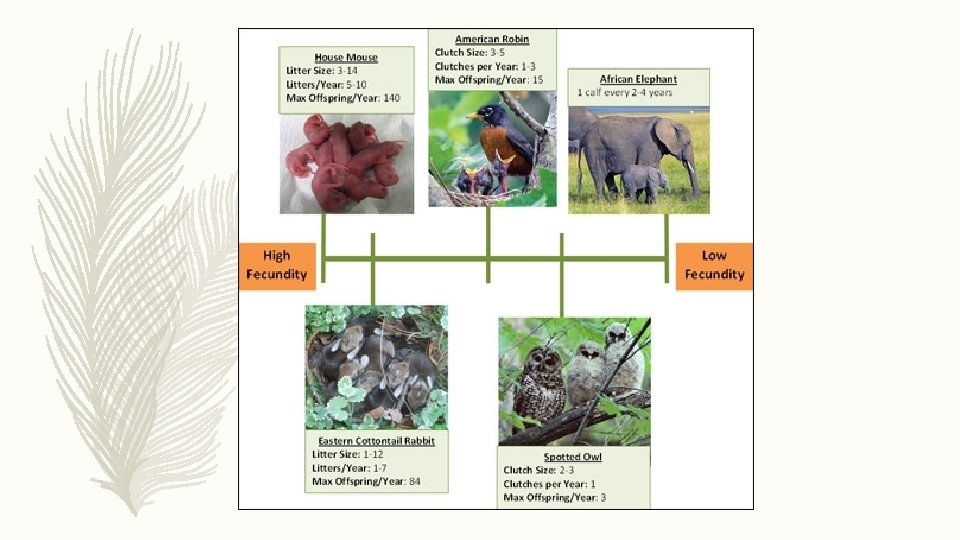
Fecundity • Fecundity is the potential reproductive capacity of an individual or population, varying from species to species. • Fecundity is very dependent on environmental conditions. In years when there is an abundance of resources and optimal climate, species will tend to have higher rates of reproduction. In contrast, in years where there is little food and precipitation, fecundity rates can dramatically drop.
• Fecundity is also influenced by several other characteristics: • The age structure of different populations • Age structure describes the number of individuals in one of three categories: • Individuals below the age of sexual maturity (pre-reproductive) • Individuals at the reproducing age (reproductive) • Individuals above the age of sexual maturity (post-reproductive) • Age structure represents its growth history and can predict its growth potential in the future • Generation time is the time, on average, a species takes to complete a generation • For example, a species • Sex ratio of populations