Population Demography What is Demography Demography is the


- Slides: 55
Population & Demography
What is Demography? Demography is the statistical study of the characteristics, trends, and issues of human populations. It helps us to understand the causes and consequences of population change.
Things to think about… 1. How many is too many? 2. What is the impact of global population growth?
Population Growth Projection
Our World in Data - Population World Population by Region & Natural Population Growth
Population Trends and Issues Why do you think we study population change? How does population connect to how people live? Why is population growth a problem? Discuss your ideas with a partner.
Why Studying Population is Important: • Population change will impact all of us one way or another because of the consequences of a growing population. • Population change is important to the government because they need to plan for the future (examples: number of schools and hospitals needed). • Businesses care about population change because they are interested in family size, incomes and consumer habits.
Why Population Growth is a Potential Problem: • Over 1 Billion people do not have enough food or safe drinking water. • Global warming is disrupting our ecosystem and is threatening billions of people with dislocation. • Energy sources are becoming scarce, and harder to reach (wood, oil, etc. ) • Due to population pressures, people are forced to live in unsafe places. Pakistan Flood Plains
Why Population Growth is a Potential Problem: • Population growth shares complex ties to poverty and inequality, increasing the gap between the wealthy and the poor. • Each year in the US new subdivisions destroy approximately 2. 2 million acres of farmland, ranches and forests. • Canadians spend an average of 77 hours stuck in traffic per year (and we’re lucky!)
How is Population Tracked? • The Census: collects, compiles and publishes demographic, economic and social data about all people living in a particular area. • Canada has a major census every 10 years, and a less detailed one every 5 years • A random selection of people are chosen to give more detailed information (housing, household contents, income and buying habits).
Population Inaccuracies • It is difficult to ensure that homeless people are accounted for. • In developing countries the census data is less accurate because the birth rate and death rate are not as complete as in developed countries. • Remote areas may be neglected by data collectors. • Shantytowns are not considered permanent residents. • Some people want to avoid census out of fear of authorities, the wish to avoid taxation or conflict with government.
Population Rates • Natural Increase = Birth Rate – Death Rate • Net Migration = Immigrants – Emigrants • Net Migration + Natural Increase = an increase or decrease in population • Canada, the US and Australia are some of the few countries where immigration is significant. • The result is a multicultural population.
Historic Immigration Levels
Agree / Disagree There will be a series of statements shown. It is your job to decide if you fully agree, somewhat disagree or fully disagree. When the statement is presented, walk to the sign that represents you. During this time, the room should be silent. When you arrive at your spot you will be given time to discuss
Because our population has reached seven billion people and continues to grow, we need to expand land area available for living and growing food by cutting down the rainforest.
Without reducing rapid population growth, it will be impossible to solve the world’s global challenges.
The Earth can support over 7 billion people now and will be able to support any number of humans in the future.
In an effort to feed a population of over 7 billion, people in developed countries should reduce the amount of meat they consume.
Science and technology will ensure that food production and energy supplies keep up with the demands of a growing population.
With human population over 7 billion, we must protect endangered species habitats by not developing on them for any reason.
There is nothing I can do to help alleviate population pressures.
Governments in countries with fastgrowing populations should make laws to limit the number of children that couples can have.
In a real crunch, jobs are more important than environmental quality.
With over 7 billion people on the planet, water pollution is inevitable and we should not waste money trying to prevent it
Automobile makers in this country should be required by law to make all their vehicles fuel efficient, even though the vehicles may become more expensive.
If China and India can each take care of over a billion people on relatively the same size land as the U. S. , then the U. S. and Canada should accept immigrants until each country reaches a billion people as well.
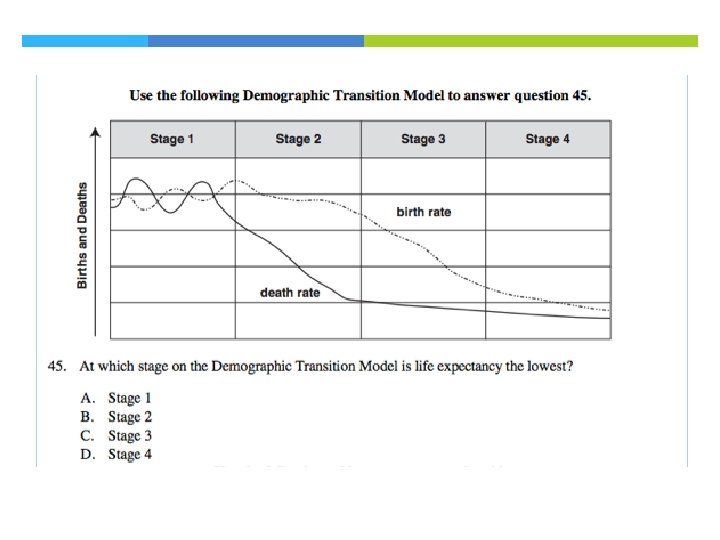
The Demographic Transition Model
Stage 1: Pre-Transition • Birth and Death rates are high • Low life expectancy because of disease, poor medical care, poor nutrition and unsanitary living conditions • According to population experts, these are predeveloped or massively under developed countries (it’s likely that there are no countries left in this stage)
Stage 2: Early Transition • Death rate falls due to agricultural revolution, improved hygiene, sanitation and medicine. • Birth rate remains high. • Results in rapid increase of population. • Developing Countries: Kenya, Chad, Haiti, Botswana, Burma
Stage 3: Late Transition: • Falling death rate, followed by a decline in birth rate (contraception and education). • Population growth increases rapidly due to large number of people reaching childbearing age. • Newly developed countries: Mexico, South Africa, Morocco
Stage 4: Post-Transition • Low birth and death rate • Small family size is normal • People live longer • Stable populations • Fully developed economies • Examples: Canada and the US
Impact of Stage 4 on Canada’s Population
Canada: The Sandwich Generation Children, and older people need medical, education, housing, and other services. They are supported by the ‘middle generation’ This is known as the dependency ratio
Stage 5: Declining Population • Low birth and death rates • Small family size makes deep impact • Increasing amount of elderly people • Declining population • Example: Austria
Quick Review 1. What improvements lead to population growth? 2. How do birth rates differ between the developed and the developing world? Why is this? 3. What do you think is the most important factor in starting a country to move from one stage of the Demographic Transition model to the next?
Quick Review What are characteristics of each stage of the Demographic Transition Model?
Watch: Overpopulation - The Human Explosion Explained
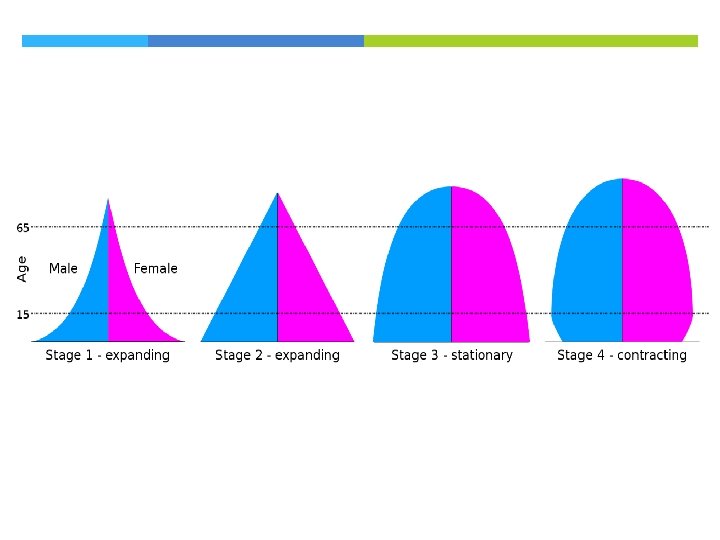
Stages of Population: Population Pyramids
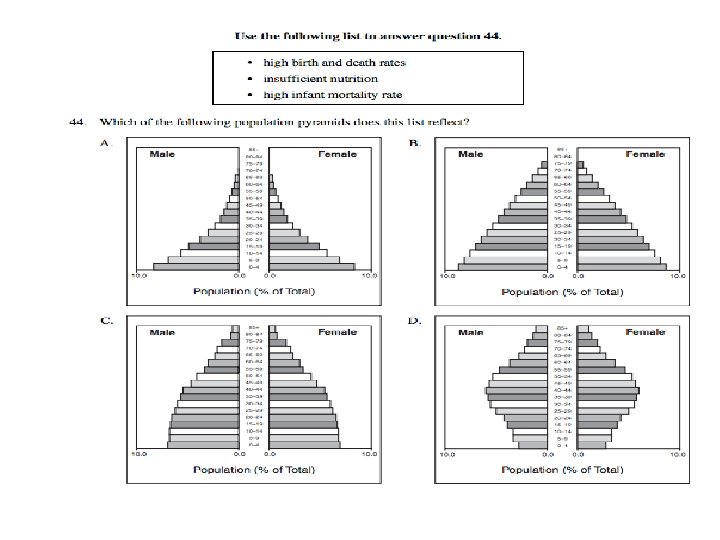
Population Pyramids • Population Pyramids are another way of interpreting population data. • Population Pyramids show the age and gender structure of a population. • Structure: A series of horizontal bar graphs for male and female population are placed back to back at age intervals of five years (known as age cohorts). • Population pyramids are useful in comparing the population structures of different countries.
Early Expanding • High birth and death rate • Short life expectancy (people die young) • Signs of a developing country
Expanding • Rapid increase in population • High birth rates • Lowering death rates • Longer life expectancy • More stable than early expanding because people are living longer.
Stable • Stable or slow population increase • Declining birth and death rates • More elderly people
Contracting • Extremely low birth rate and low death rate • Higher dependency ratio • Longer life expectancy • More middle aged people
What do you think Canada’s Population Pyramid looks like?
Canada in 1961
Canada in 1996
Canada in 2016 Canada's Population Pyramid Link
Canada in 2050 - Predictions
DISCUSS: What are the most likely consequences that Canada’s aging population will have for you? Justify your answers.
Quick Practice 1. What information does a population pyramid show? 1. What population pyramids are typical for developing countries? Which are typical for developed countries?
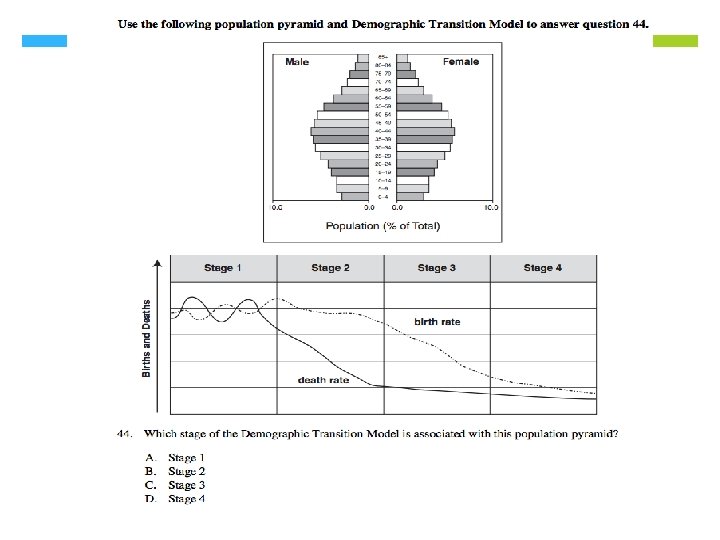
How do Demographic Transition Models work with Population Pyramids?