Data Analysis Unit Representing Data Goal I can

- Slides: 17
Data Analysis Unit Representing Data Goal: I can represent data with plots on the real number line (dot plots, histograms, and box plots). S-ID. 1
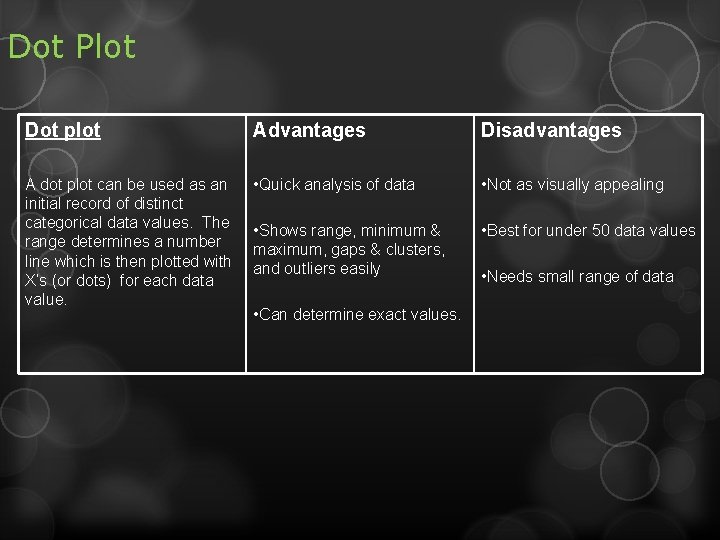
Dot Plot Dot plot Advantages Disadvantages A dot plot can be used as an initial record of distinct categorical data values. The range determines a number line which is then plotted with X’s (or dots) for each data value. • Quick analysis of data • Not as visually appealing • Shows range, minimum & maximum, gaps & clusters, and outliers easily • Best for under 50 data values • Can determine exact values. • Needs small range of data
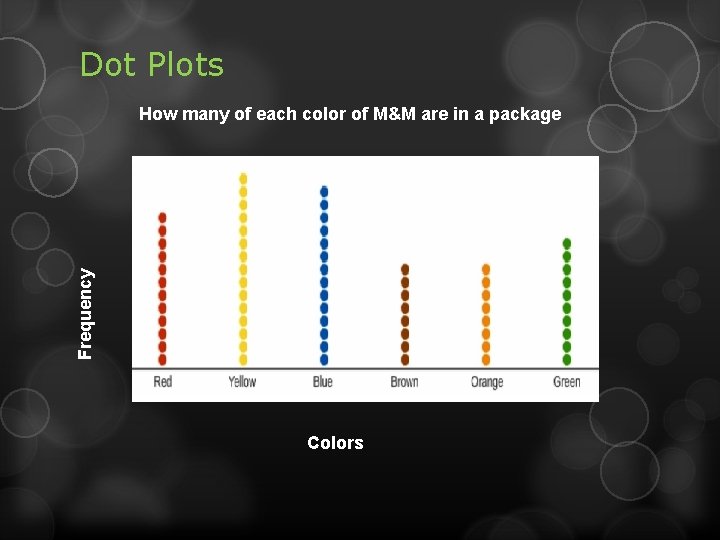
Dot Plots Frequency How many of each color of M&M are in a package Colors
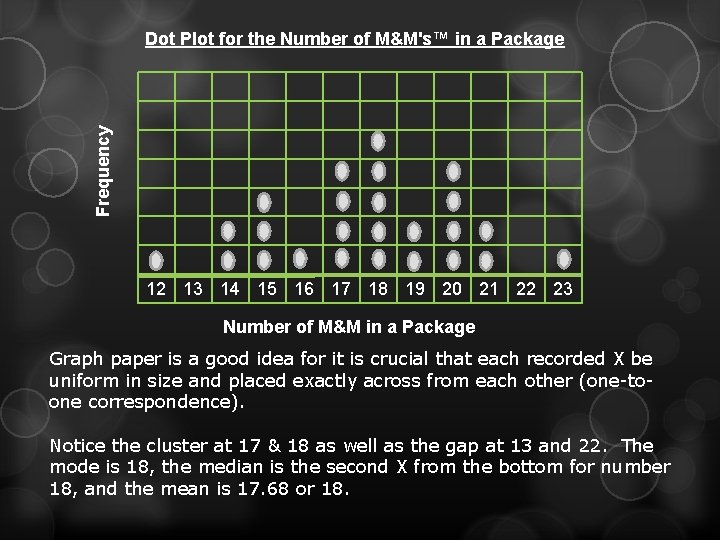
Frequency Dot Plot for the Number of M&M's™ in a Package 12 13 14 15 16 17 18 19 20 21 22 23 Number of M&M in a Package Graph paper is a good idea for it is crucial that each recorded X be uniform in size and placed exactly across from each other (one-toone correspondence). Notice the cluster at 17 & 18 as well as the gap at 13 and 22. The mode is 18, the median is the second X from the bottom for number 18, and the mean is 17. 68 or 18.
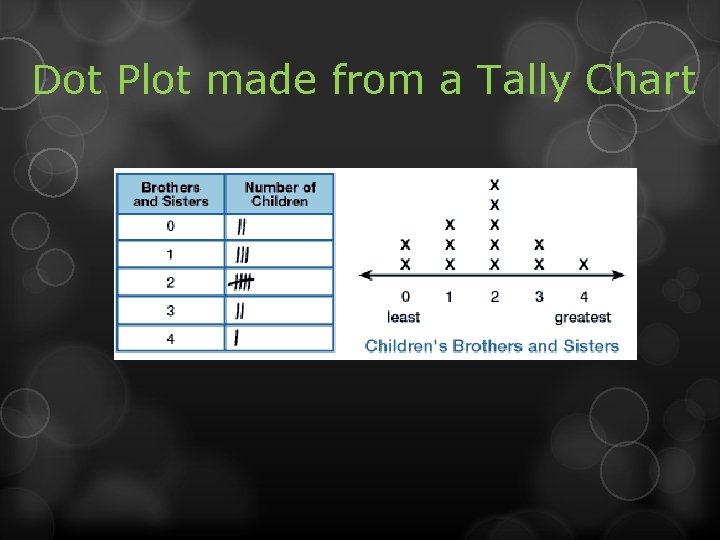
Dot Plot made from a Tally Chart
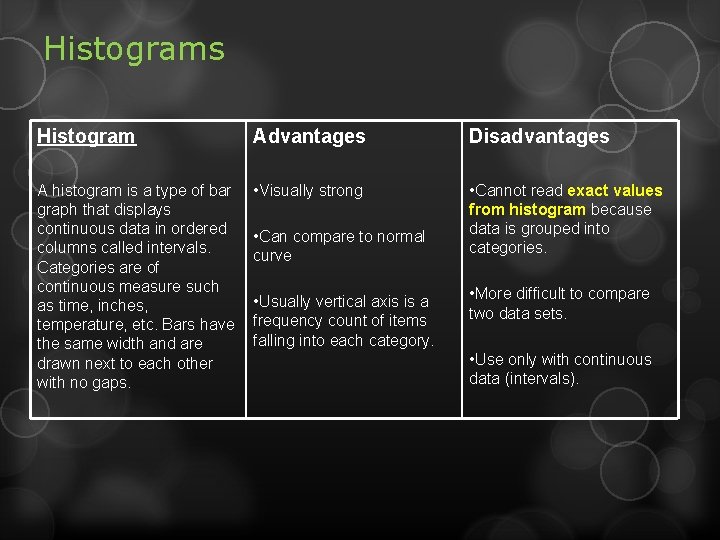
Histograms Histogram Advantages Disadvantages A histogram is a type of bar graph that displays continuous data in ordered columns called intervals. Categories are of continuous measure such as time, inches, temperature, etc. Bars have the same width and are drawn next to each other with no gaps. • Visually strong • Cannot read exact values from histogram because data is grouped into categories. • Can compare to normal curve • Usually vertical axis is a frequency count of items falling into each category. • More difficult to compare two data sets. • Use only with continuous data (intervals).
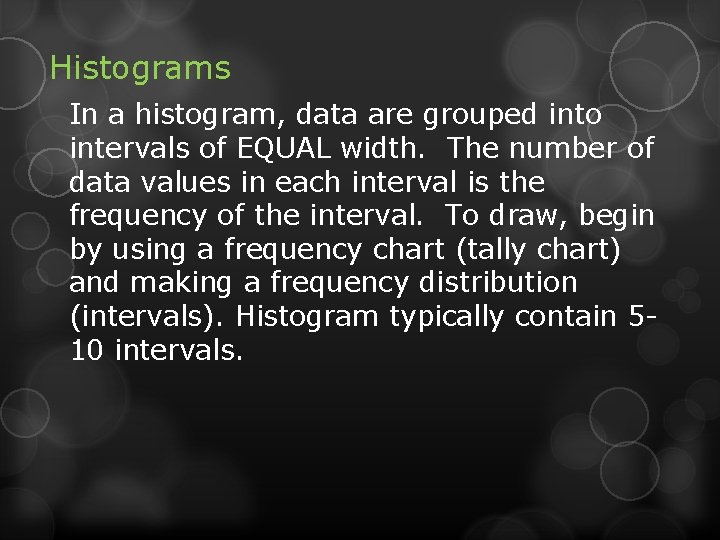
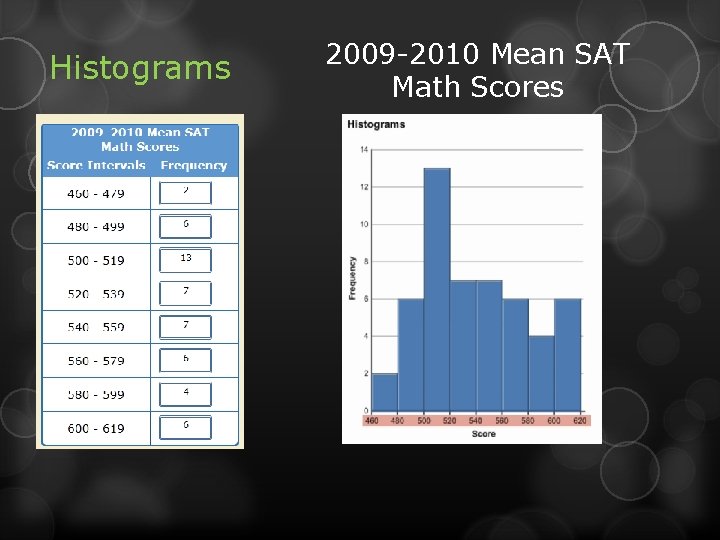
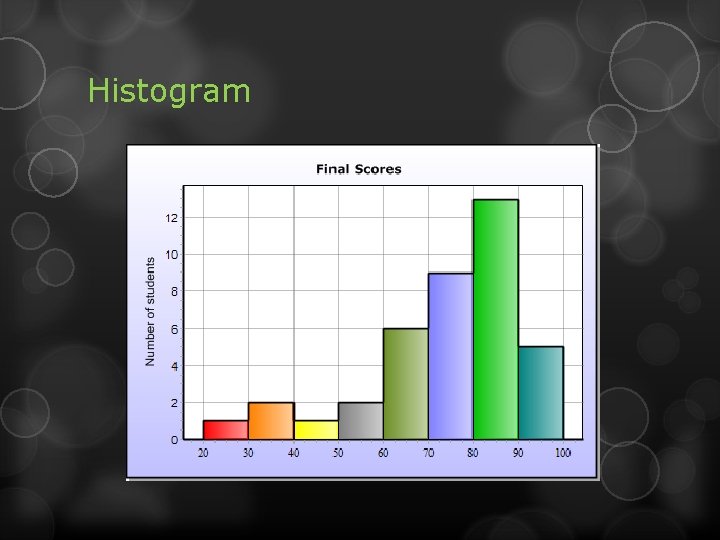
Histograms In a histogram, data are grouped into intervals of EQUAL width. The number of data values in each interval is the frequency of the interval. To draw, begin by using a frequency chart (tally chart) and making a frequency distribution (intervals). Histogram typically contain 510 intervals.
Histograms 2009 -2010 Mean SAT Math Scores
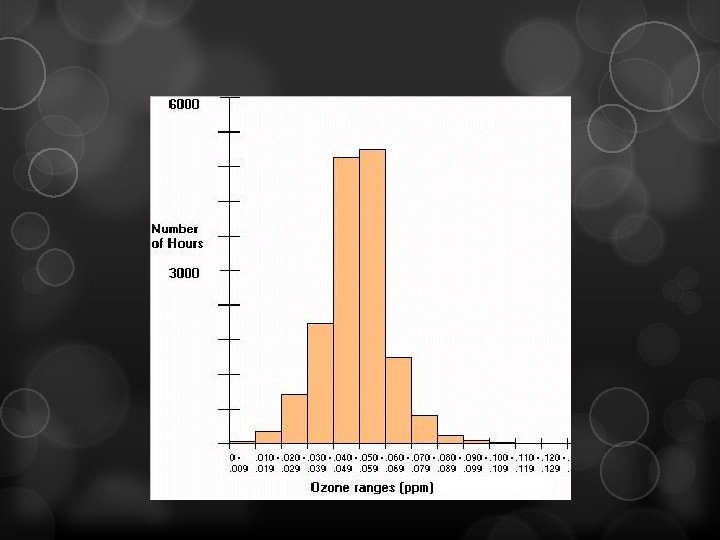
Histogram
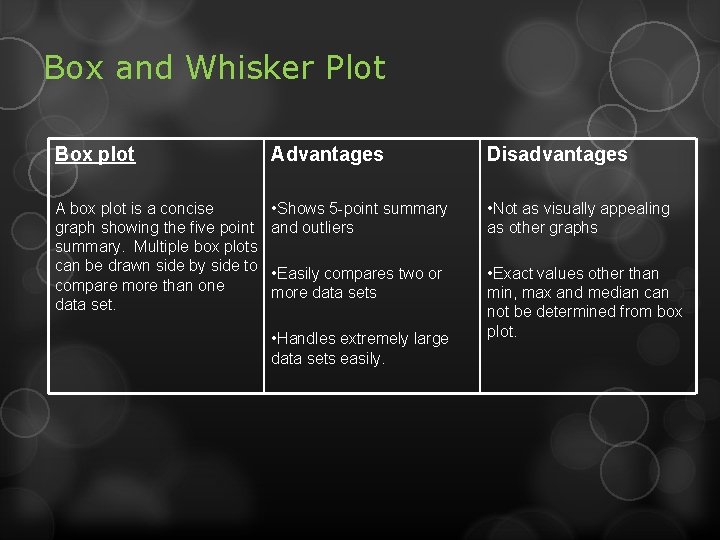
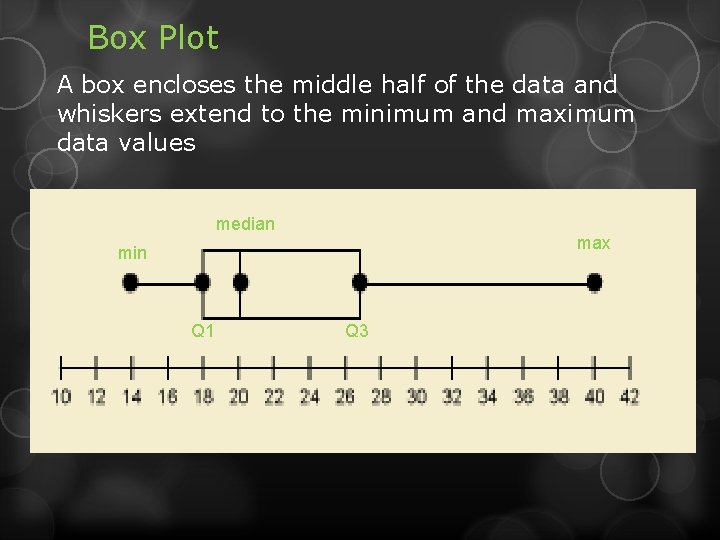
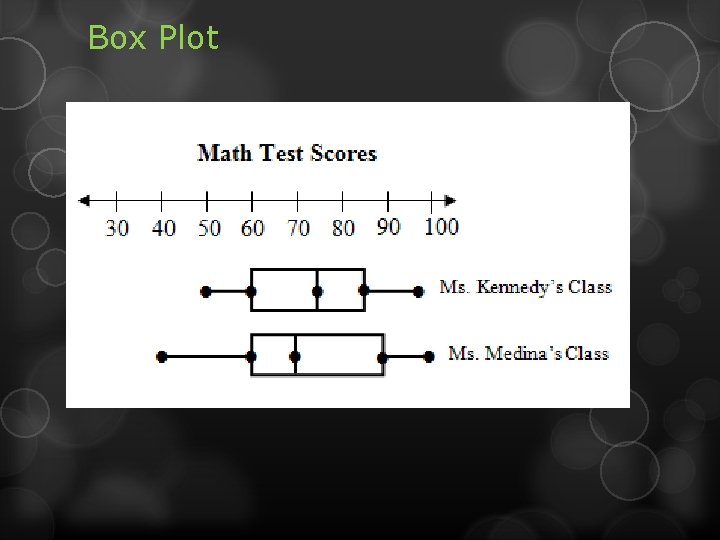
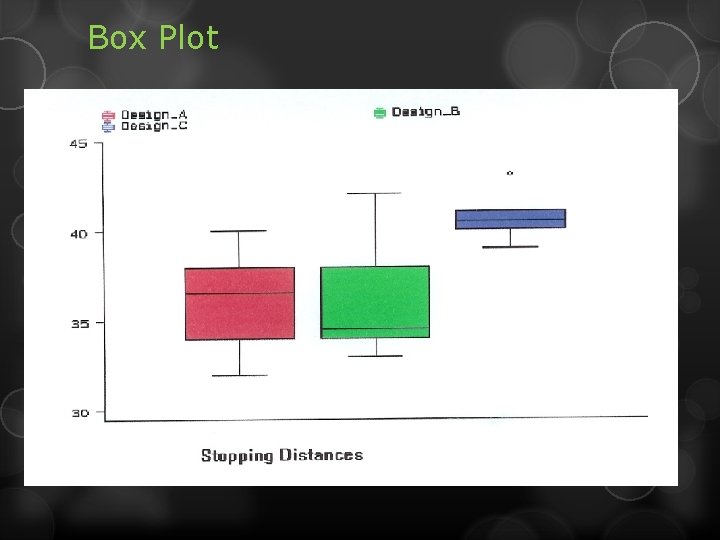
Box and Whisker Plot Box plot Advantages Disadvantages A box plot is a concise graph showing the five point summary. Multiple box plots can be drawn side by side to compare more than one data set. • Shows 5 -point summary and outliers • Not as visually appealing as other graphs • Easily compares two or more data sets • Exact values other than min, max and median can not be determined from box plot. • Handles extremely large data sets easily.
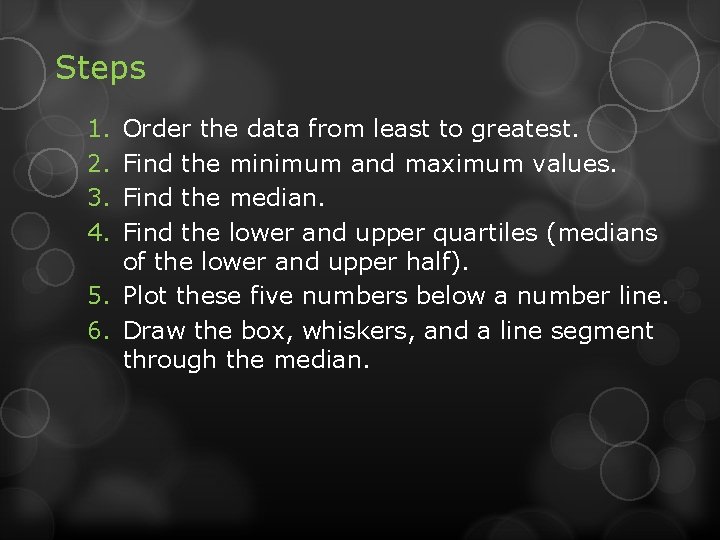
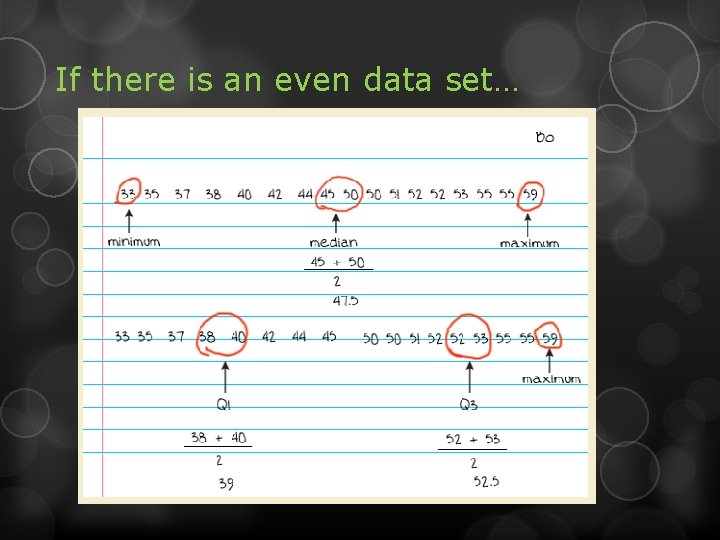
Steps 1. 2. 3. 4. Order the data from least to greatest. Find the minimum and maximum values. Find the median. Find the lower and upper quartiles (medians of the lower and upper half). 5. Plot these five numbers below a number line. 6. Draw the box, whiskers, and a line segment through the median.
If there is an even data set…
Box Plot A box encloses the middle half of the data and whiskers extend to the minimum and maximum data values median max min Q 1 Q 3
Box Plot
Box Plot
Relating Histograms to Box Plots http: //higheredbcs. wiley. com/legacy/college/mann /0470444665/applets/applet_01_v 4. html