Representing and Interpreting Data Module 11 Interpret a


- Slides: 20
Representing and Interpreting Data Module 11
Interpret a Line Plot What kind of graph is this? What do the numbers along the bottom represent? What do the numbers represent?
Interpret a Line Plot How many club members recorded how far they ran this week on the line plot? How do you know? What was the greatest number of miles that a member ran? Explain. How many people ran fewer than four miles? Explain. How many miles did the people in the club run all together? Explain.
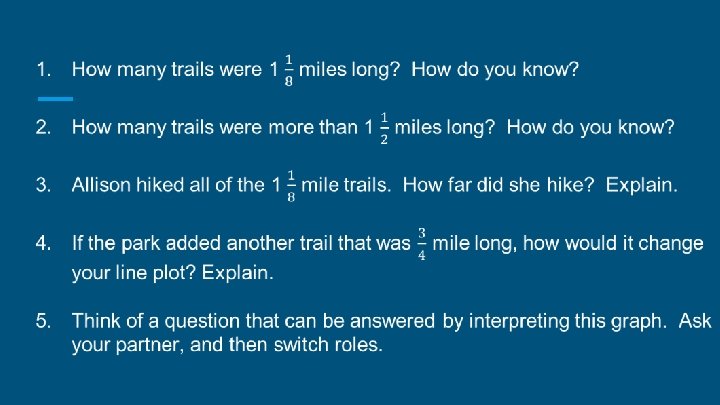
There were 10 nature trails at the national park. 1. What are the longest and shortest trails? 2. How did you figure out the longest and shortest trails? 3. There a lot of trails, so it’s hard to se the shortest and longest trails when the data is in this list. How else might we display this data so we could see it better?
There were 10 nature trails at the national park. 1. 2. 3. 4. We could show it on a bar graph. How many bars would we need? Is there a better way we could show it? How do we make a line plot? Why would that be an easier way to represent this data than a bar graph?
There were 10 nature trails at the national park. 1. Decide with a partner what we should use as the endpoints of our number line. Explain your thinking. 2. Turn to your partner, and decide how you will partition the number line. What fractional parts make sense for this data? Explain. Work with your partner to make a line plot to show the lengths of each trail.
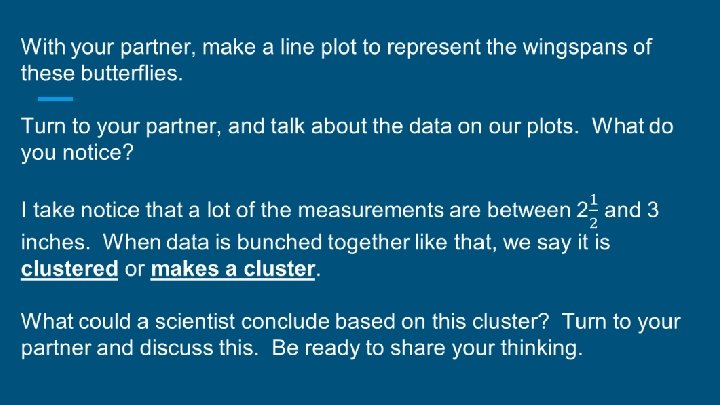
Butterfly Wingspan in Inches Butterfly A F B G C H D I E J Wingspan in Inches 2 What can you say about the length of wingspan for these 10 butterflies? Is there another way, other than the table, that we could represent the data? What type of graph would give us a quick picture of the lengths of these butterflies? Explain.
What is different about this line plot? Why might that be? With your partner, write three questions that can be answered by interpreting these line plots, then answer them based on each line plot. Are your answers the same or different for both plots? Explain.
Turn to your partner, and tell what kind of graph this is and how you know. What information is being shown in this graph? On the back of the card, write what you know about the term?
1. How do you figure out the scale for a graph? So what is the scale? 2. What do the tick marks between the 0 and 100 represent? 3. Suppose one of the bars falls between the 50 and 100. What number could this represent? 4. How many people attended the game during Week 1. How do you know?
1. How could you estimate the total number of tickets sold for the first 5 weeks? 2. With your partner, come up with an estimate. Be ready to explain how you figured it out?
Turn to your partner. The numbers you need to graph are 35, 50, 30, 74, 20, and 85. What would a good scale be? Why?
Using Data in a Bar Graph What data is represented in the graph? Turn to a partner, and share your ideas.
1. Which day had the greatest attendance? 2. Thursday’s attendance was about twice as much as which day? 3. If you combined Friday and Saturday’s attendance, would it be more or less than 10, 000? Explain how you know.
1. About how many more people came to the fair on Friday than Wednesday? 2. Suppose we added Monday’s data. It was Free T-shirt Day. 6, 321 people came. How would you graph that on the bar graph? 3. How would the graph look different if you made the scale 0, 2000, 4000, 6000? Would that be harder or easier to interpret? Explain.
1. 2. 3. 4. 5. What type of graph is this? Turn to a partner, and talk about this. Why is it called a pictograph? What does a circle represent? What does a half circle represent? How many tickets did the second-grade students sell? How did you figure that out?
1. How many more tickets did the fourth-grade students sell than the second grade students? 2. If the fifth-grade students sold 12 more tickets, how many circles would you need to add to the graph? 3. Suppose we changed the value of the circle to 4 tickets. How many circles would you need for third grade? 4. Why is it important to pay attention to the key?
Name Amount of Money Saved Carey $55 Lee $90 Keith $75 Henry $95 Pedro $70 Let’s use this data to make a pictograph. 1. What symbol should we use to show the data in the graph? 2. Turn to a partner, and talk about how much money the symbol should represent. 3. If you chose to have each symbol stand for $5, how many symbols would you have for $55? 4. If you chose $10, how would you determine the number of symbols?