Crosscortical Coherence during Decision Making Chess Stetson Andersen
- Slides: 39
Cross-cortical Coherence during Decision Making Chess Stetson, Andersen Lab Caltech 07/20/2008
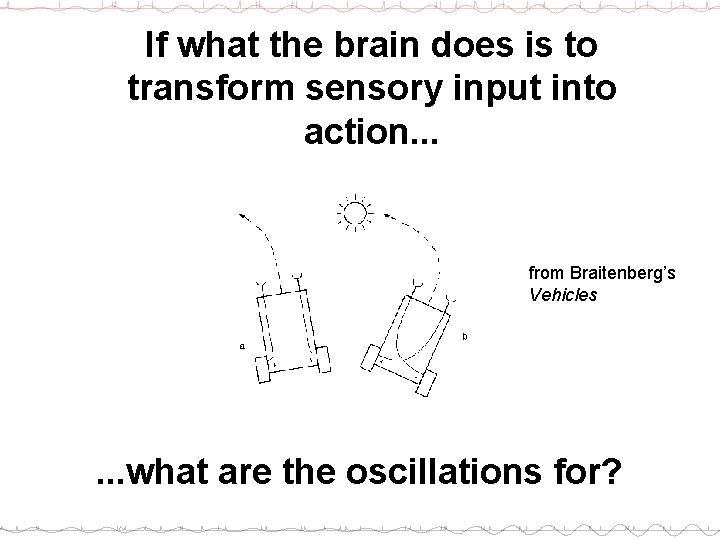
If what the brain does is to transform sensory input into action. . . from Braitenberg’s Vehicles . . . what are the oscillations for?
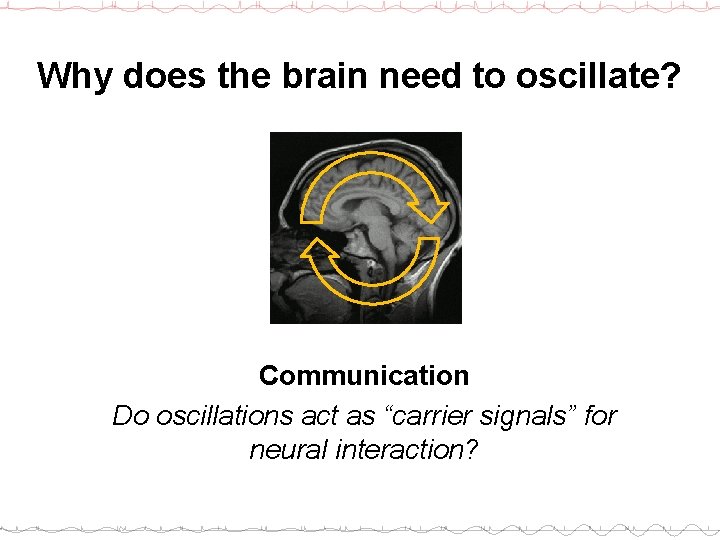
Why does the brain need to oscillate? Communication Do oscillations act as “carrier signals” for neural interaction?
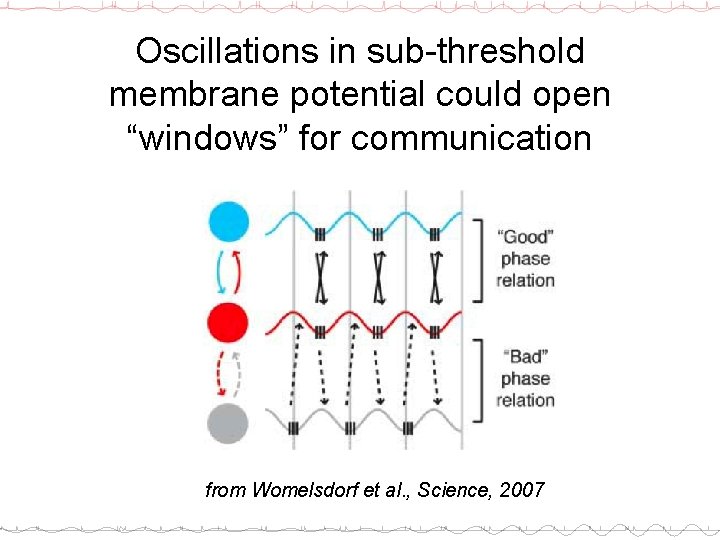
Oscillations in sub-threshold membrane potential could open “windows” for communication from Womelsdorf et al. , Science, 2007
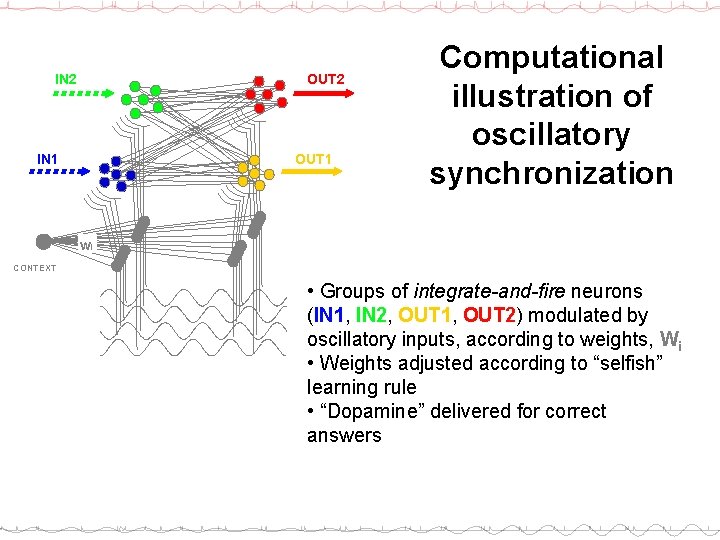
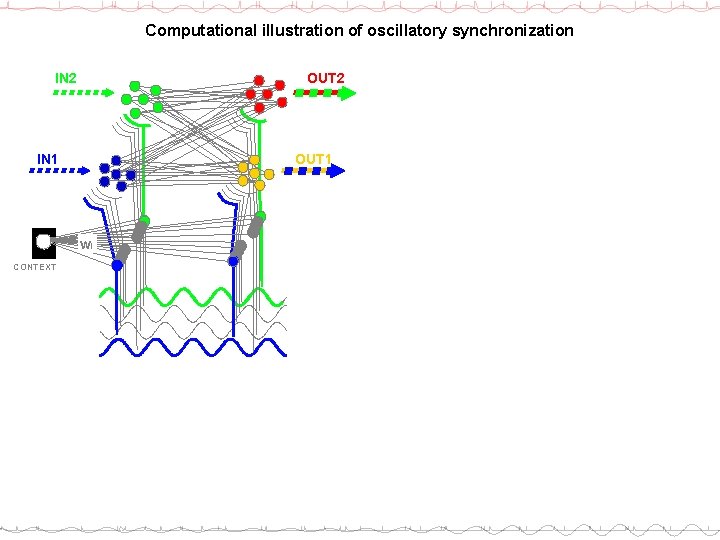
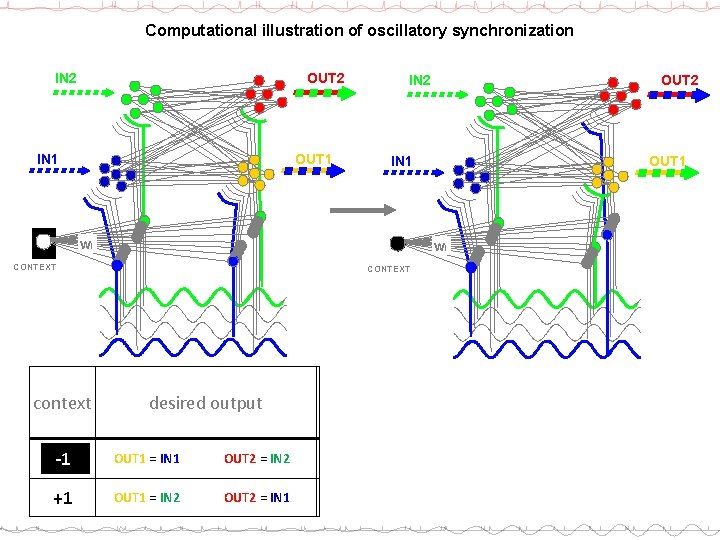
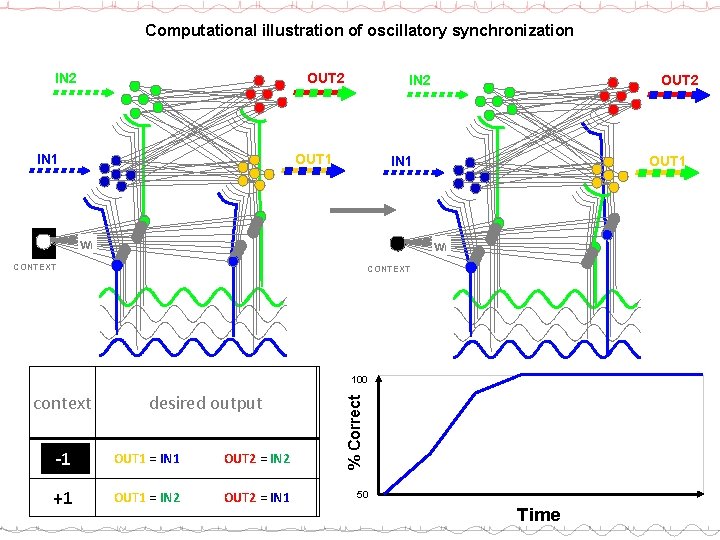
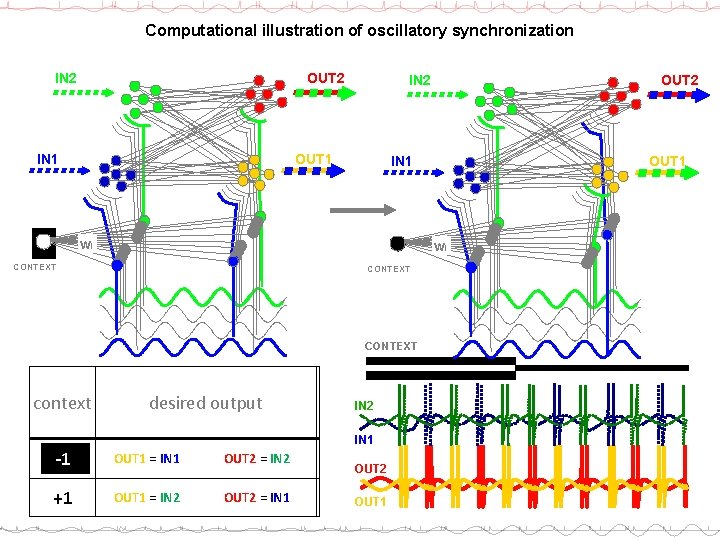
OUT 2 IN 2 OUT 1 IN 1 Computational illustration of oscillatory synchronization wi CONTEXT • Groups of integrate-and-fire neurons (IN 1, IN 2, OUT 1, OUT 2) modulated by oscillatory inputs, according to weights, Wi • Weights adjusted according to “selfish” learning rule • “Dopamine” delivered for correct answers
Computational illustration of oscillatory synchronization OUT 2 IN 2 OUT 1 IN 1 wi CONTEXT
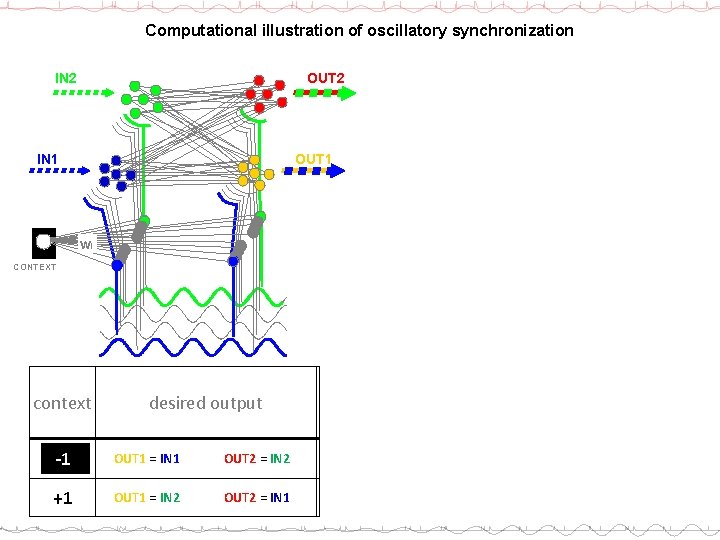
Computational illustration of oscillatory synchronization OUT 2 IN 2 OUT 1 IN 1 wi CONTEXT context desired output -1 OUT 1 = IN 1 OUT 2 = IN 2 +1 OUT 1 = IN 2 OUT 2 = IN 1
Computational illustration of oscillatory synchronization OUT 2 IN 2 OUT 1 IN 1 wi wi CONTEXT context OUT 2 IN 2 CONTEXT desired output -1 OUT 1 = IN 1 OUT 2 = IN 2 +1 OUT 1 = IN 2 OUT 2 = IN 1
Computational illustration of oscillatory synchronization OUT 2 IN 2 OUT 1 IN 1 wi wi CONTEXT context desired output -1 OUT 1 = IN 1 OUT 2 = IN 2 +1 OUT 1 = IN 2 OUT 2 = IN 1 % Correct 100 50 Time
Computational illustration of oscillatory synchronization OUT 2 IN 2 OUT 1 IN 1 wi wi CONTEXT context OUT 2 IN 2 desired output IN 2 IN 1 -1 OUT 1 = IN 1 OUT 2 = IN 2 +1 OUT 1 = IN 2 OUT 2 = IN 1 OUT 2 OUT 1
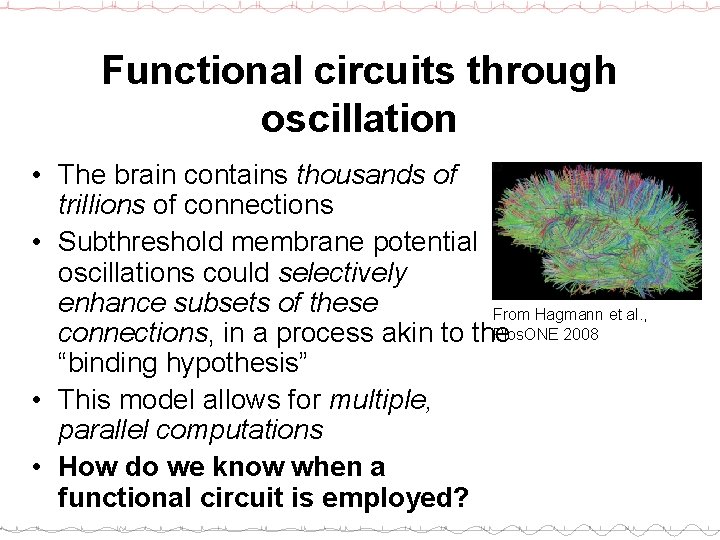
Functional circuits through oscillation • The brain contains thousands of trillions of connections • Subthreshold membrane potential oscillations could selectively enhance subsets of these From Hagmann et al. , Plos. ONE 2008 connections, in a process akin to the “binding hypothesis” • This model allows for multiple, parallel computations • How do we know when a functional circuit is employed?
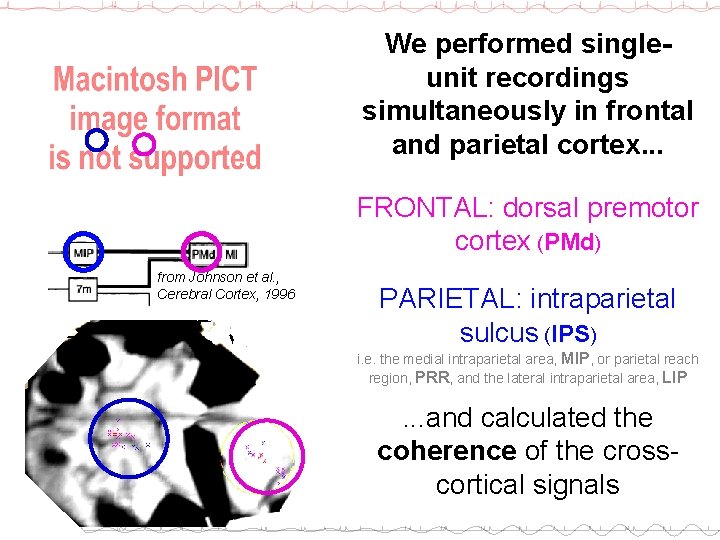
We performed singleunit recordings simultaneously in frontal and parietal cortex. . . FRONTAL: dorsal premotor cortex (PMd) from Johnson et al. , Cerebral Cortex, 1996 PARIETAL: intraparietal sulcus (IPS) i. e. the medial intraparietal area, MIP, or parietal reach region, PRR, and the lateral intraparietal area, LIP . . . and calculated the coherence of the crosscortical signals
Coherence • C(x, y) is a complex number representing the phase of the offset between signals x and y at every frequency • FT(x) is the Fourier transform of x, which can be computed using multiple tapers • We will focus on |<C(x, y)>|, the epoch-averaged coherence, expressing the consistency in phase-lag between signals, independent of signal power
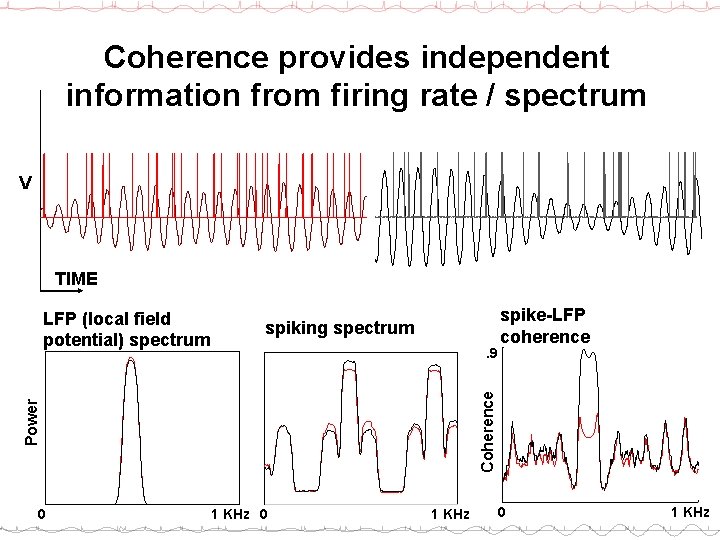
Coherence provides independent information from firing rate / spectrum V TIME spiking spectrum 0 spike-LFP coherence Coherence . 9 Power LFP (local field potential) spectrum 1 KHz 0 1 KHz
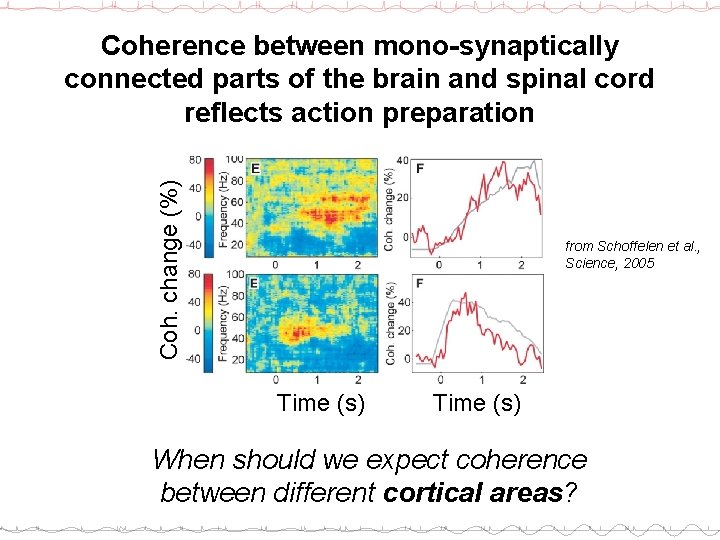
Coh. change (%) Coherence between mono-synaptically connected parts of the brain and spinal cord reflects action preparation from Schoffelen et al. , Science, 2005 Time (s) When should we expect coherence between different cortical areas?
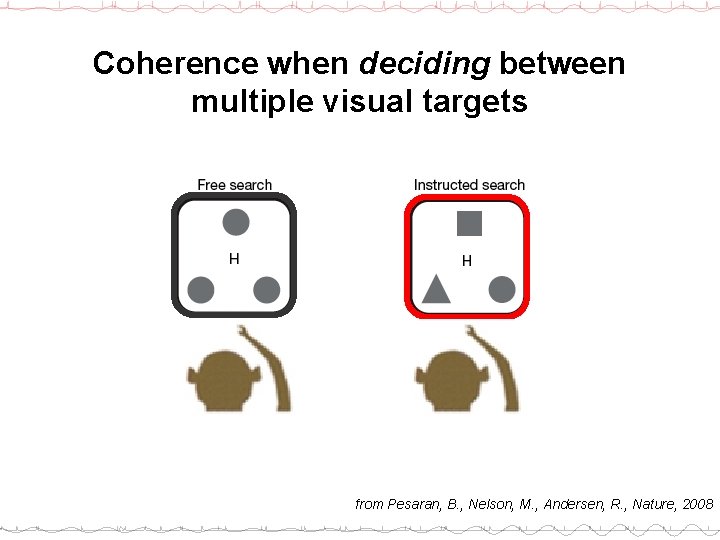
Coherence when deciding between multiple visual targets from Pesaran, B. , Nelson, M. , Andersen, R. , Nature, 2008
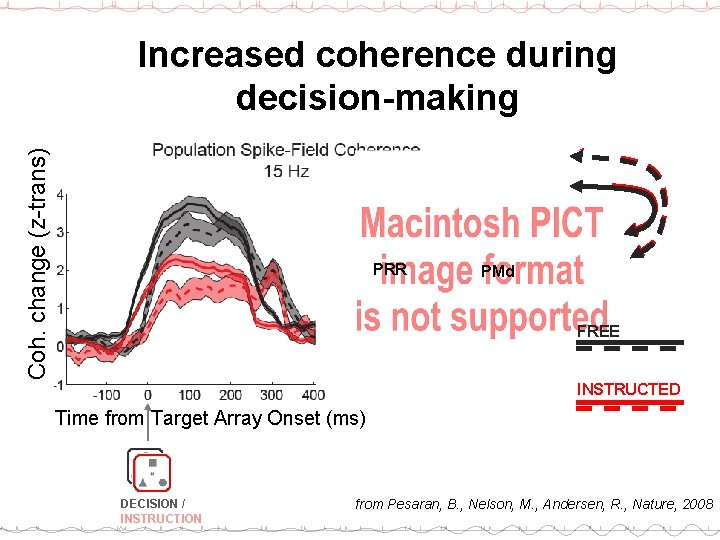
Coh. change (z-trans) Increased coherence during decision-making PRR PMd FREE INSTRUCTED Time from Target Array Onset (ms) DECISION / INSTRUCTION from Pesaran, B. , Nelson, M. , Andersen, R. , Nature, 2008
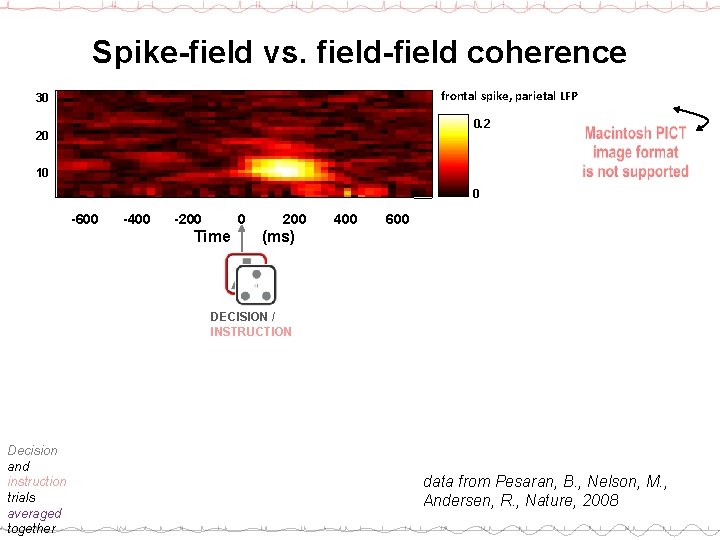
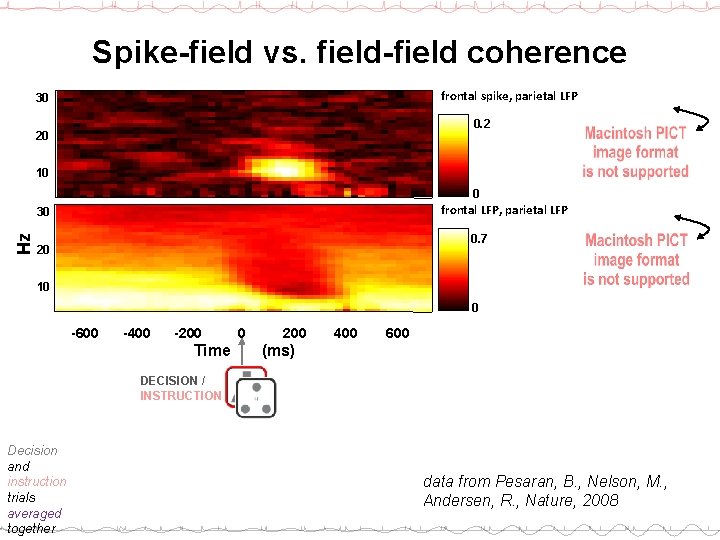
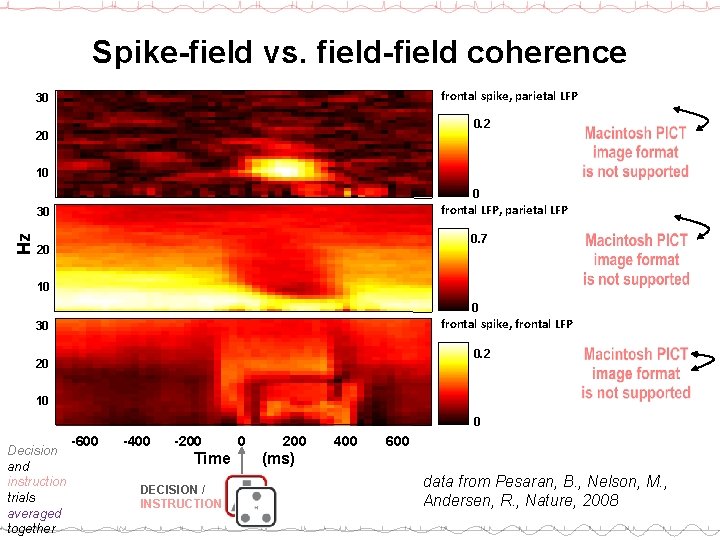
But, does cross-cortical spike-field coherence imply communication? • A generalized increase in oscillatory activity in the brain could produce the appearance of long-range spike-LFP coherence, even between unconnected brain areas • Partial coherence analysis shows that in the case of 74% of spikes (Pesaran et al. , 2008), long-range spikefield coherence can’t be explained exclusively by short-range spike-field coherence and long-range field-field coherence. Nevertheless, common input to both regions could be increasing • If two cortical areas were driven by a common source, one might expect their LFP-LFP coherence to increase -- the LFP-LFP coherence between lobes may shed more light on the nature of their coupling
Spike-field vs. field-field coherence frontal spike, parietal LFP 30 0. 2 20 10 0 -600 -400 -200 0 Time 200 400 600 (ms) DECISION / INSTRUCTION Decision and instruction trials averaged together data from Pesaran, B. , Nelson, M. , Andersen, R. , Nature, 2008
Spike-field vs. field-field coherence frontal spike, parietal LFP 30 0. 2 20 10 0 frontal LFP, parietal LFP Hz 30 0. 7 20 10 0 -600 -400 -200 Time 0 200 400 600 (ms) DECISION / INSTRUCTION Decision and instruction trials averaged together data from Pesaran, B. , Nelson, M. , Andersen, R. , Nature, 2008
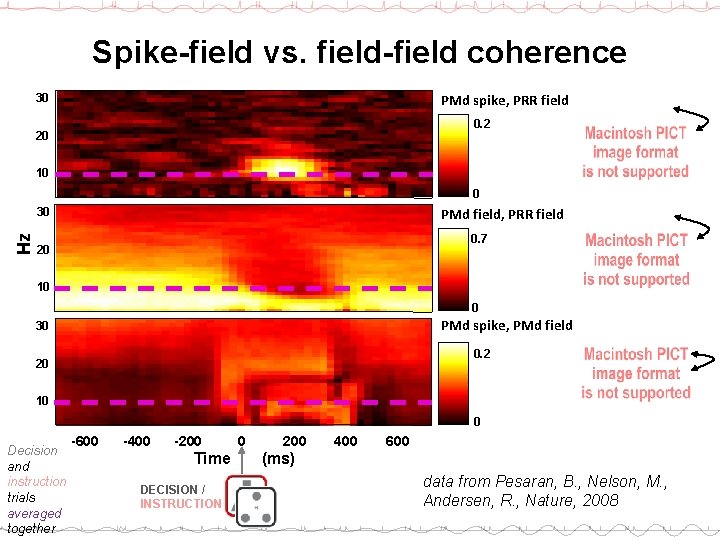
Spike-field vs. field-field coherence frontal spike, parietal LFP 30 0. 2 20 10 0 frontal LFP, parietal LFP Hz 30 0. 7 20 10 0 frontal spike, frontal LFP 30 0. 2 20 10 0 Decision and instruction trials averaged together -600 -400 -200 Time DECISION / INSTRUCTION 0 200 400 600 (ms) data from Pesaran, B. , Nelson, M. , Andersen, R. , Nature, 2008
Spike-field vs. field-field coherence PMd spike, PRR field 30 0. 2 20 10 0 PMd field, PRR field Hz 30 0. 7 20 10 0 PMd spike, PMd field 30 0. 2 20 10 0 Decision and instruction trials averaged together -600 -400 -200 Time DECISION / INSTRUCTION 0 200 400 600 (ms) data from Pesaran, B. , Nelson, M. , Andersen, R. , Nature, 2008
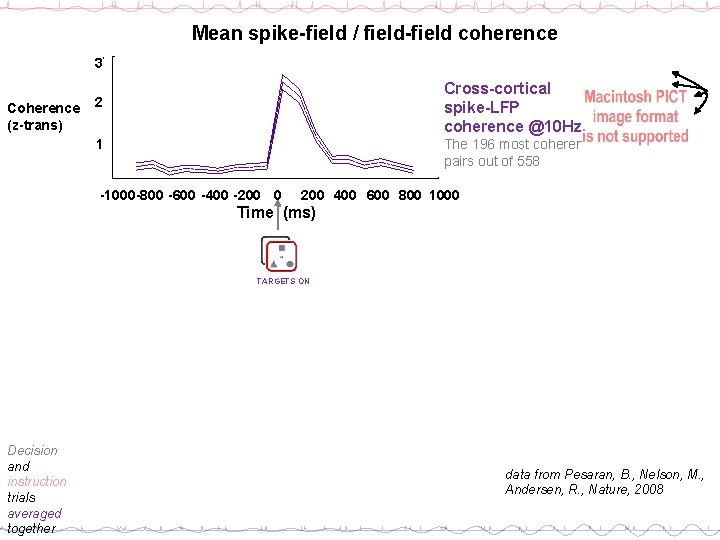
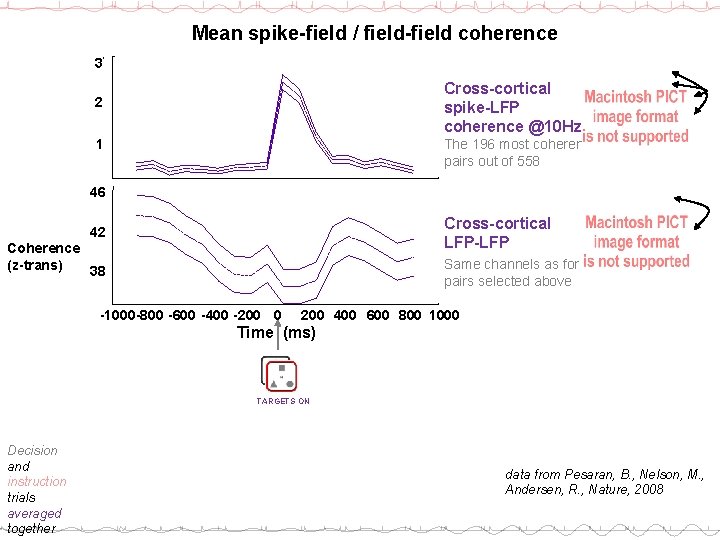
Mean spike-field / field-field coherence 3 Coherence (z-trans) Cross-cortical spike-LFP coherence @10 Hz 2 1 The 196 most coherent pairs out of 558 -1000 -800 -600 -400 -200 0 200 400 600 800 1000 Time (ms) TARGETS ON Decision and instruction trials averaged together data from Pesaran, B. , Nelson, M. , Andersen, R. , Nature, 2008
Mean spike-field / field-field coherence 3 Cross-cortical spike-LFP coherence @10 Hz 2 1 The 196 most coherent pairs out of 558 46 Cross-cortical LFP-LFP 42 Coherence (z-trans) 38 Same channels as for pairs selected above -1000 -800 -600 -400 -200 0 200 400 600 800 1000 Time (ms) TARGETS ON Decision and instruction trials averaged together data from Pesaran, B. , Nelson, M. , Andersen, R. , Nature, 2008
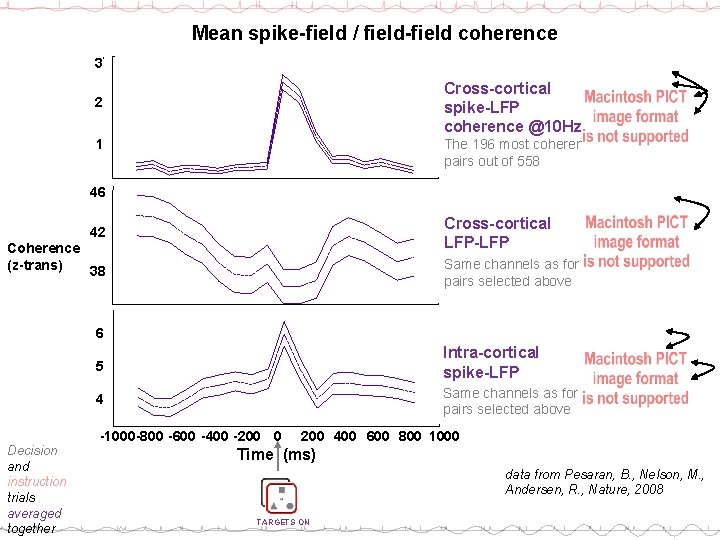
Mean spike-field / field-field coherence 3 Cross-cortical spike-LFP coherence @10 Hz 2 1 The 196 most coherent pairs out of 558 46 Cross-cortical LFP-LFP 42 Coherence (z-trans) 38 Same channels as for pairs selected above 6 Decision and instruction trials averaged together 5 Intra-cortical spike-LFP 4 Same channels as for pairs selected above -1000 -800 -600 -400 -200 0 200 400 600 800 1000 Time (ms) data from Pesaran, B. , Nelson, M. , Andersen, R. , Nature, 2008 TARGETS ON
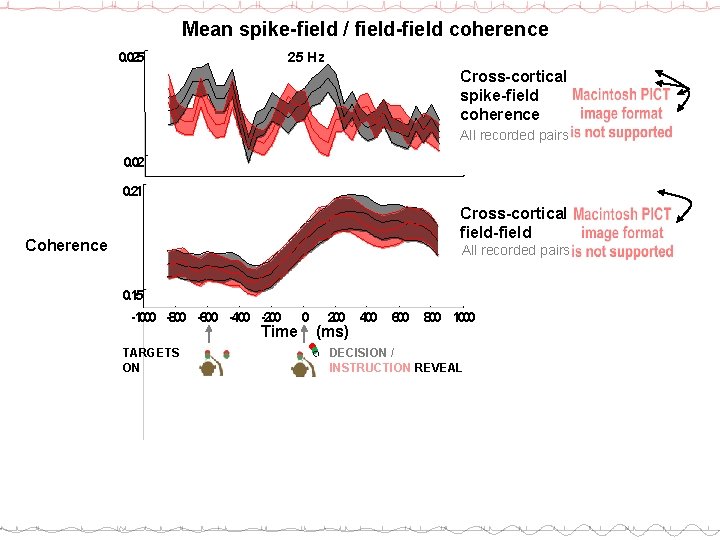
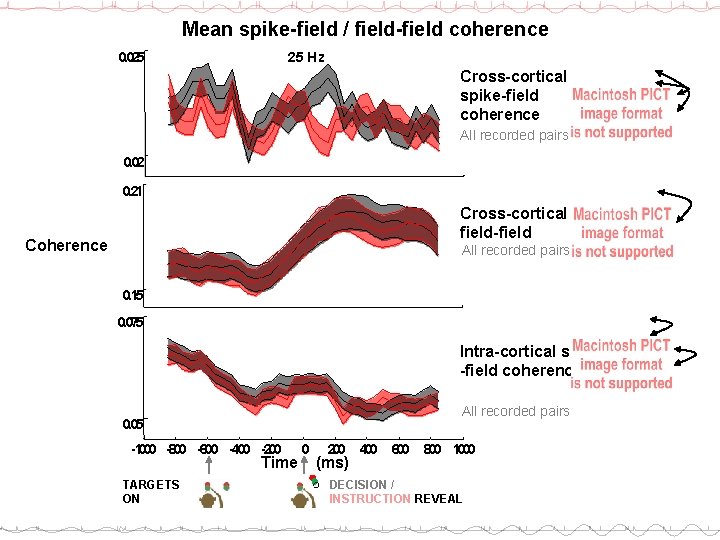
LFP-LFP vs. spike-LFP Coherence • The LFP is thought to represent a sum of synaptic activity in the region of the electrode tip (Mitzdorf, U. , 1985) • Yet, the cross-cortical LFP-LFP coherence shows a markedly different profile than the spike-LFP coherence
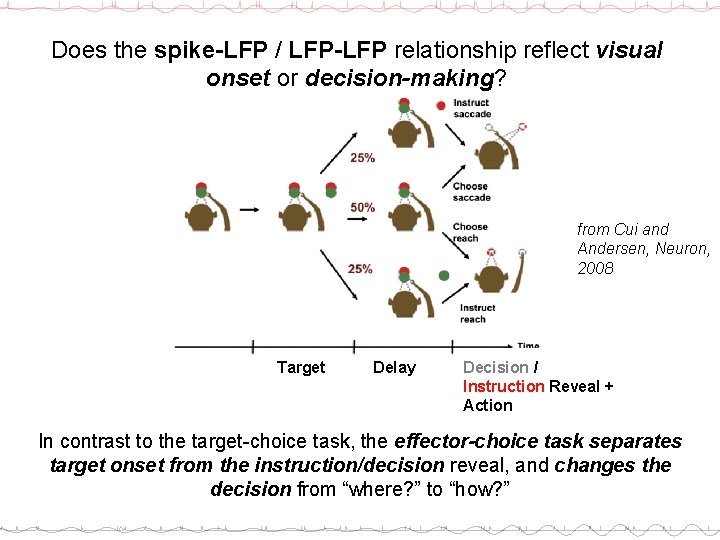
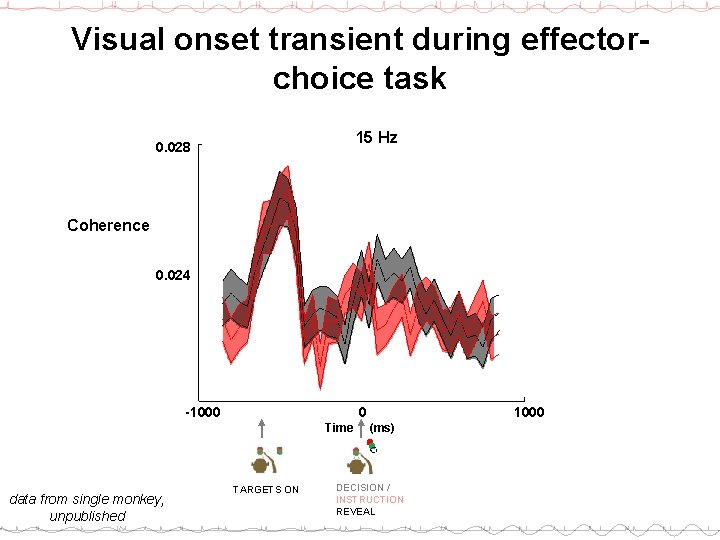
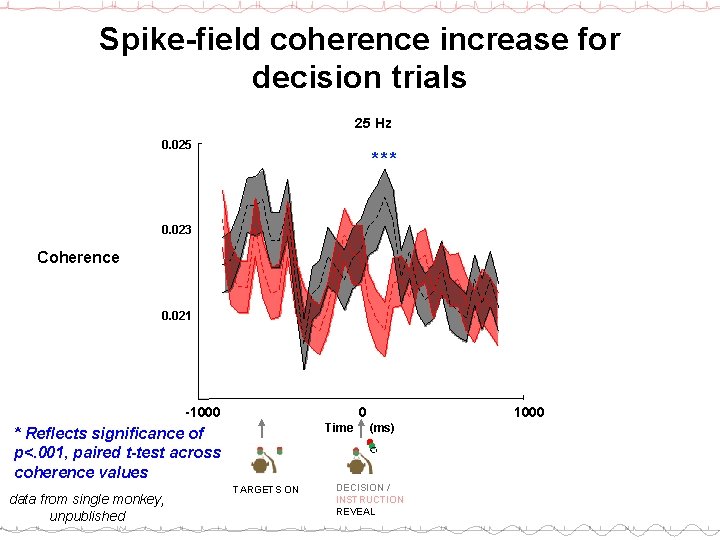
Does the spike-LFP / LFP-LFP relationship reflect visual onset or decision-making? from Cui and Andersen, Neuron, 2008 Target Delay Decision / Instruction Reveal + Action In contrast to the target-choice task, the effector-choice task separates target onset from the instruction/decision reveal, and changes the decision from “where? ” to “how? ”
Visual onset transient during effectorchoice task 15 Hz 0. 028 Coherence 0. 024 -1000 0 Time data from single monkey, unpublished TARGETS ON 1000 (ms) DECISION / INSTRUCTION REVEAL
Spike-field coherence increase for decision trials 25 Hz 0. 025 *** 0. 023 Coherence 0. 021 -1000 0 Time * Reflects significance of p<. 001, paired t-test across coherence values data from single monkey, unpublished TARGETS ON 1000 (ms) DECISION / INSTRUCTION REVEAL
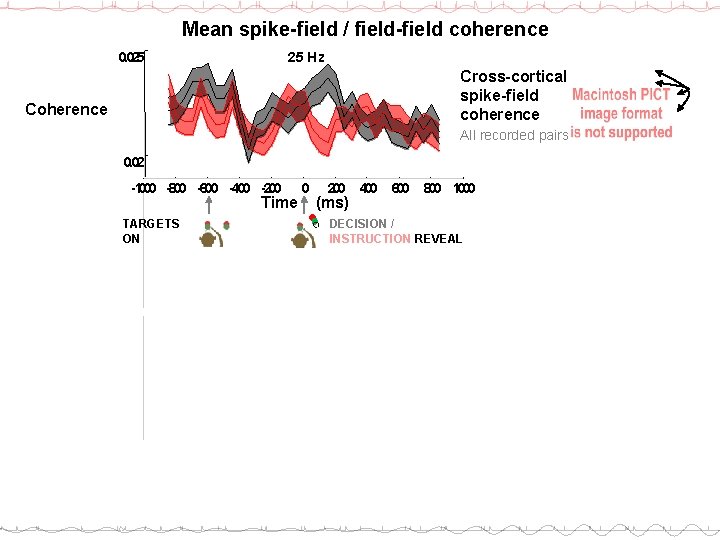
Mean spike-field / field-field coherence 0. 025 25 Hz Cross-cortical spike-field coherence Coherence All recorded pairs 0. 02 -1000 -800 -600 -400 -200 Time TARGETS ON 0 200 400 (ms) 600 800 1000 DECISION / INSTRUCTION REVEAL
Mean spike-field / field-field coherence 0. 025 25 Hz Cross-cortical spike-field coherence All recorded pairs 0. 02 0. 21 Cross-cortical field-field Coherence All recorded pairs 0. 15 -1000 -800 -600 -400 -200 Time TARGETS ON 0 200 400 (ms) 600 800 1000 DECISION / INSTRUCTION REVEAL
Mean spike-field / field-field coherence 0. 025 25 Hz Cross-cortical spike-field coherence All recorded pairs 0. 02 0. 21 Cross-cortical field-field Coherence All recorded pairs 0. 15 0. 075 Intra-cortical spike -field coherence All recorded pairs 0. 05 -1000 -800 -600 -400 -200 Time TARGETS ON 0 200 400 (ms) 600 800 1000 DECISION / INSTRUCTION REVEAL
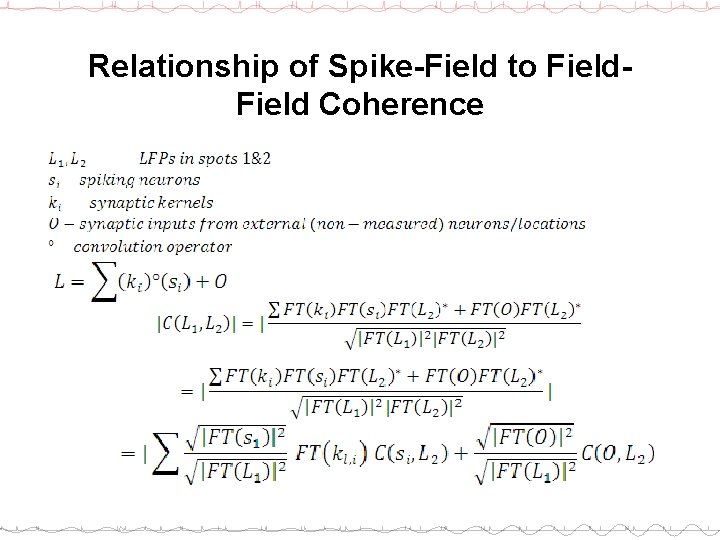
Relationship of Spike-Field to Field Coherence
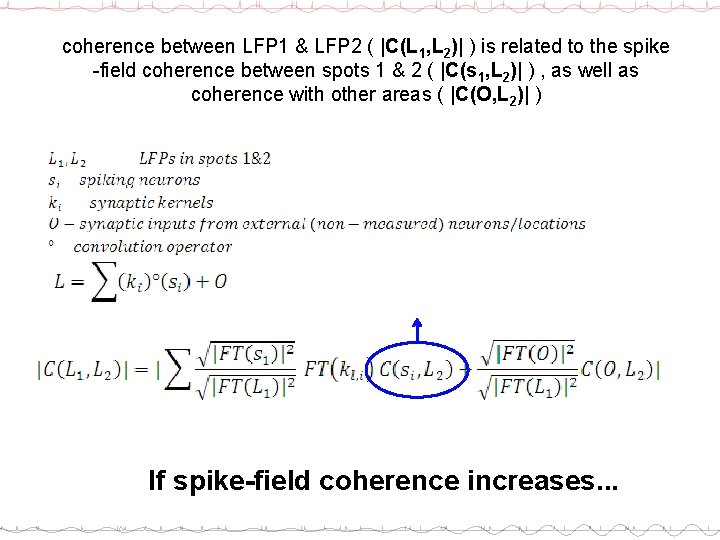
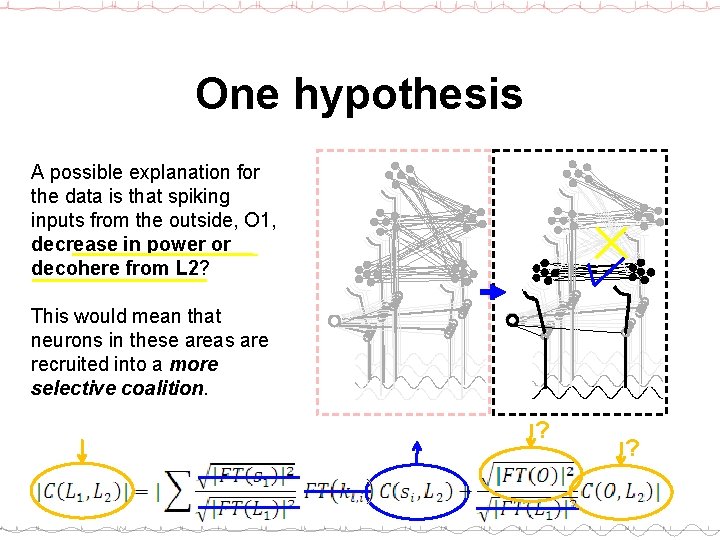
coherence between LFP 1 & LFP 2 ( |C(L 1, L 2)| ) is related to the spike -field coherence between spots 1 & 2 ( |C(s 1, L 2)| ) , as well as coherence with other areas ( |C(O, L 2)| ) If spike-field coherence increases. . .
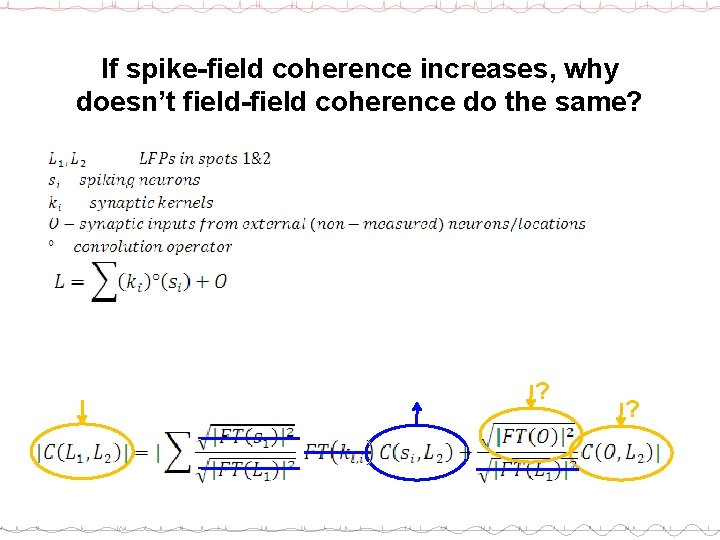
If spike-field coherence increases, why doesn’t field-field coherence do the same? ? ?
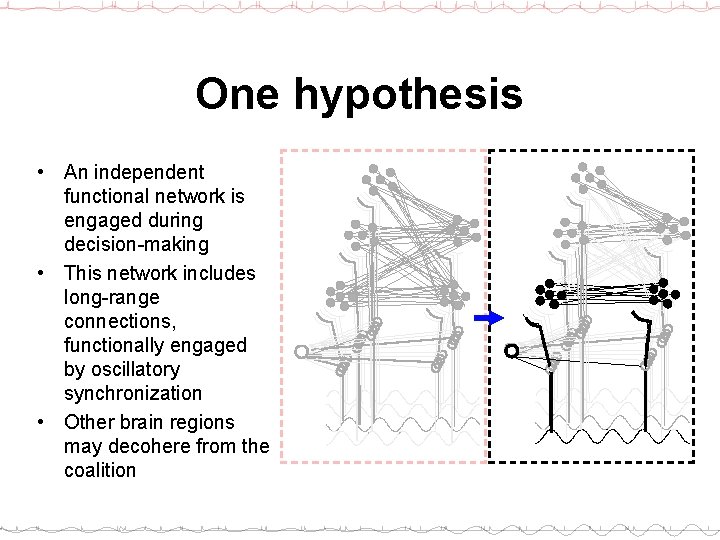
One hypothesis • An independent functional network is engaged during decision-making • This network includes long-range connections, functionally engaged by oscillatory synchronization • Other brain regions may decohere from the coalition
One hypothesis A possible explanation for the data is that spiking inputs from the outside, O 1, decrease in power or decohere from L 2? This would mean that neurons in these areas are recruited into a more selective coalition. ? ?
Conclusions • Spike-lfp coherence increases during decisionmaking • Decisions between motor outputs induce coherence increases, as do decisions between visual targets • Differences in the spike-field and field-field coherence profiles suggest that the field-field coherence differs from a simple average of the measured spike-field coherences, and may indicate the formation of a functional network for decisionmaking, between parts of parietal and frontal cortex
Thank you • The Sloan-Swartz foundation • Richard Andersen, and the Andersen laboratory • Bijan Pesaran & Matthew Nelson • My non-human primate collaborators