Corporate Financial Measures of Risk Chapter 3 Risk
- Slides: 12
Corporate Financial Measures of Risk Chapter 3
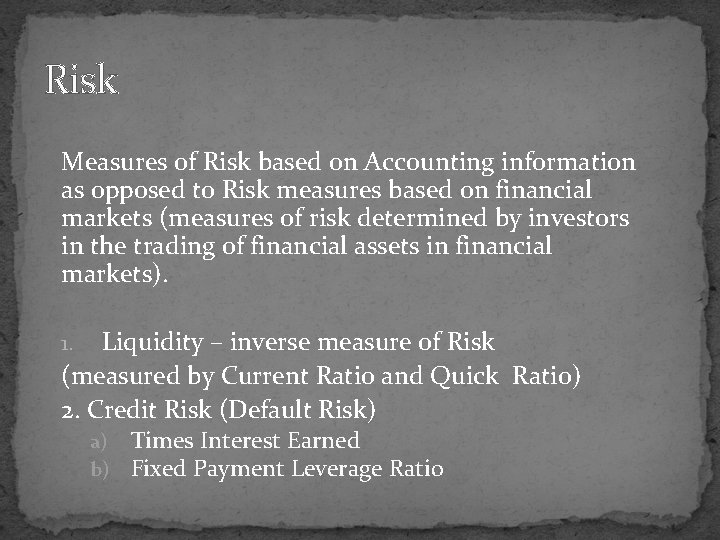
Risk Measures of Risk based on Accounting information as opposed to Risk measures based on financial markets (measures of risk determined by investors in the trading of financial assets in financial markets). Liquidity – inverse measure of Risk (measured by Current Ratio and Quick Ratio) 2. Credit Risk (Default Risk) 1. a) b) Times Interest Earned Fixed Payment Leverage Ratio
Risk 3. Operating Risk, operating leverage, business risk 4. Financial leverage
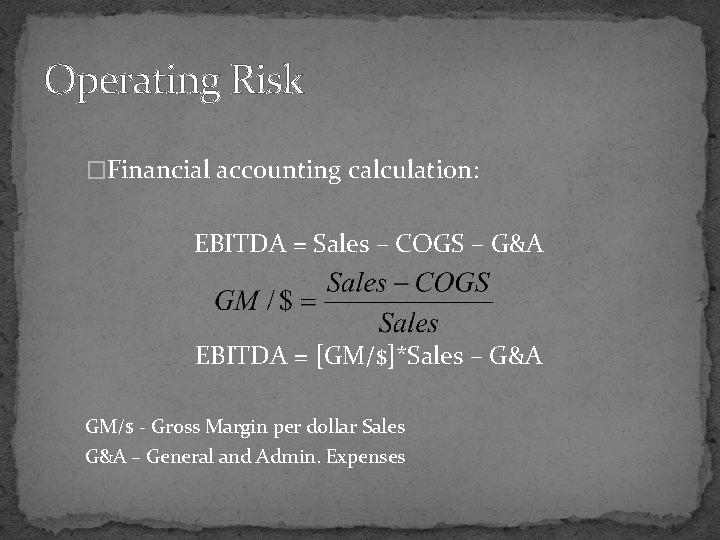
Operating Risk �Financial accounting calculation: EBITDA = Sales – COGS – G&A EBITDA = [GM/$]*Sales – G&A GM/$ - Gross Margin per dollar Sales G&A – General and Admin. Expenses
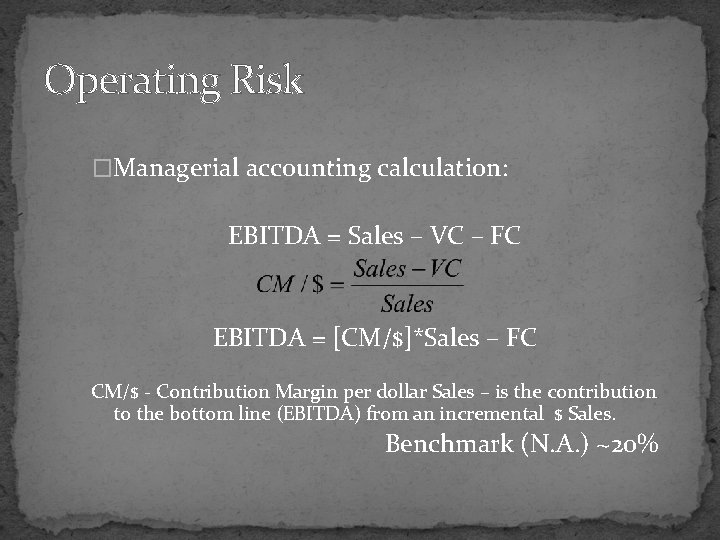
Operating Risk �Managerial accounting calculation: EBITDA = Sales – VC – FC EBITDA = [CM/$]*Sales – FC CM/$ - Contribution Margin per dollar Sales – is the contribution to the bottom line (EBITDA) from an incremental $ Sales. Benchmark (N. A. ) ~20%
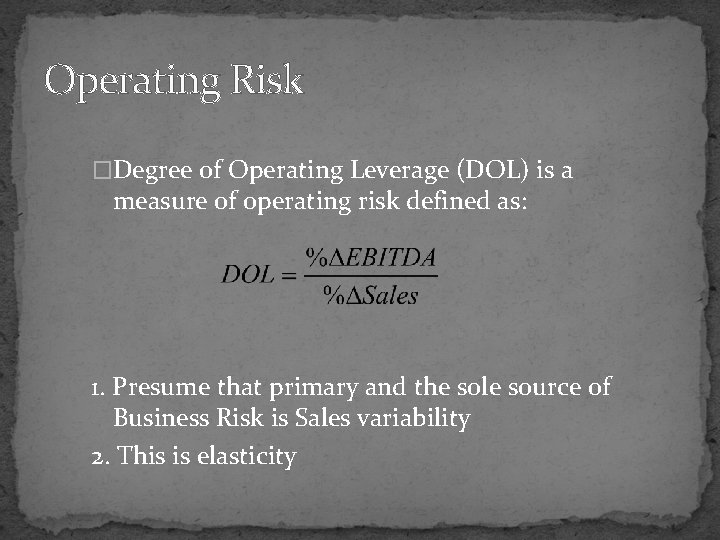
Operating Risk �Degree of Operating Leverage (DOL) is a measure of operating risk defined as: 1. Presume that primary and the sole source of Business Risk is Sales variability 2. This is elasticity
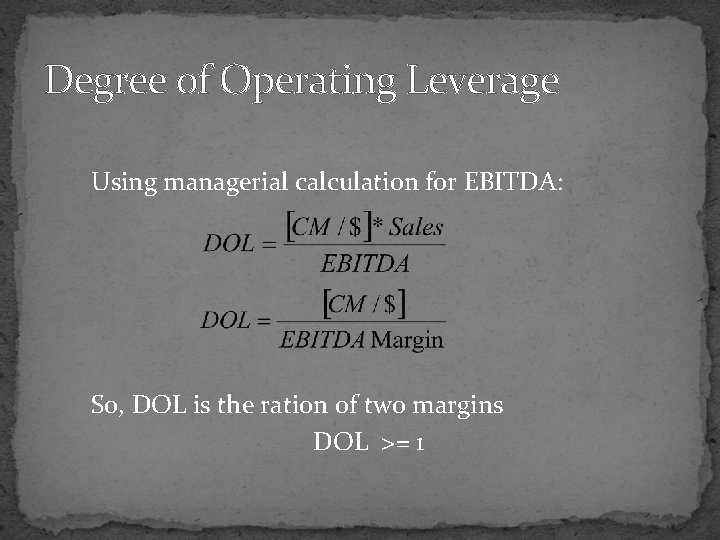
Degree of Operating Leverage Using managerial calculation for EBITDA: So, DOL is the ration of two margins DOL >= 1
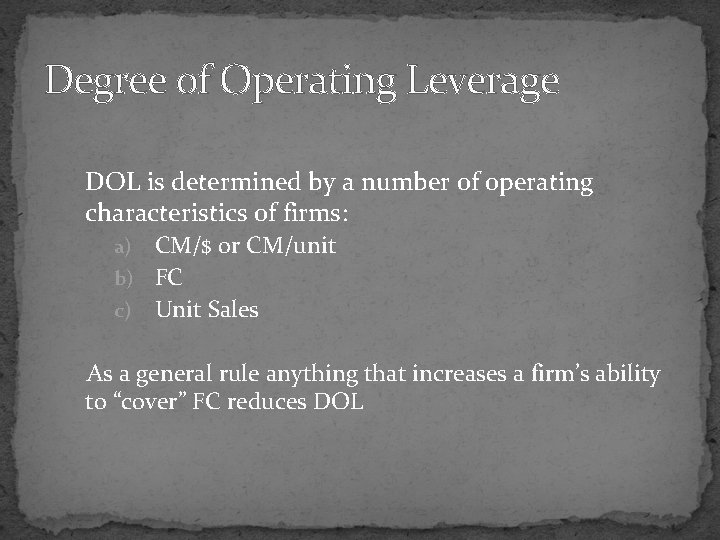
Degree of Operating Leverage DOL is determined by a number of operating characteristics of firms: CM/$ or CM/unit b) FC c) Unit Sales a) As a general rule anything that increases a firm’s ability to “cover” FC reduces DOL
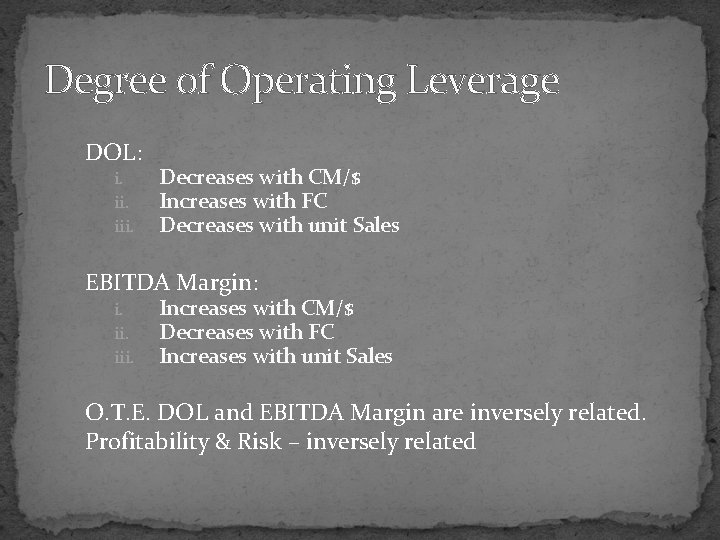
Degree of Operating Leverage DOL: i. iii. Decreases with CM/$ Increases with FC Decreases with unit Sales EBITDA Margin: i. iii. Increases with CM/$ Decreases with FC Increases with unit Sales O. T. E. DOL and EBITDA Margin are inversely related. Profitability & Risk – inversely related
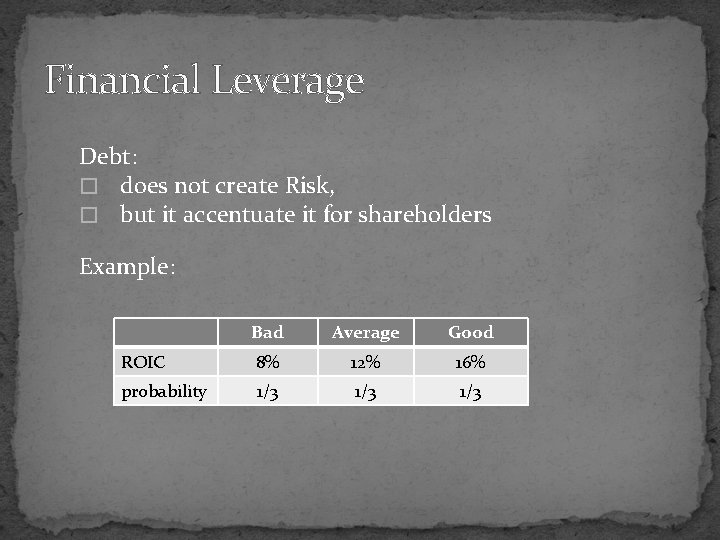
Financial Leverage Debt: � does not create Risk, � but it accentuate it for shareholders Example: Bad Average Good ROIC 8% 12% 16% probability 1/3 1/3
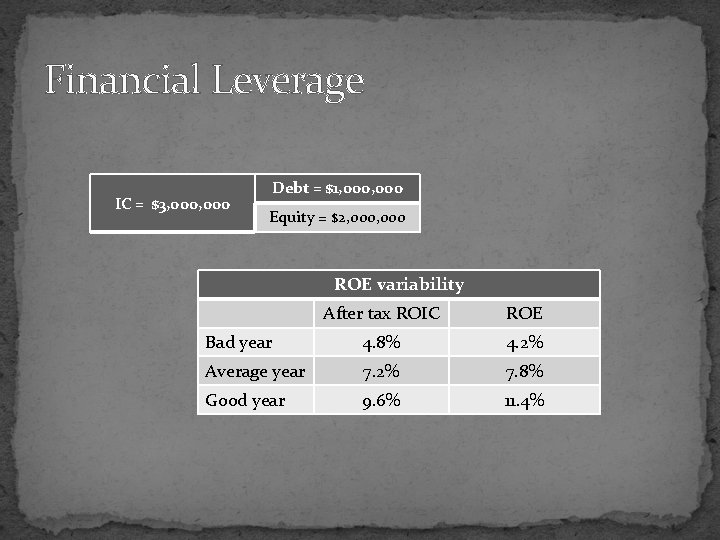
Financial Leverage IC = $3, 000 Debt = $1, 000 Equity = $2, 000 ROE variability After tax ROIC ROE Bad year 4. 8% 4. 2% Average year 7. 2% 7. 8% Good year 9. 6% 11. 4%
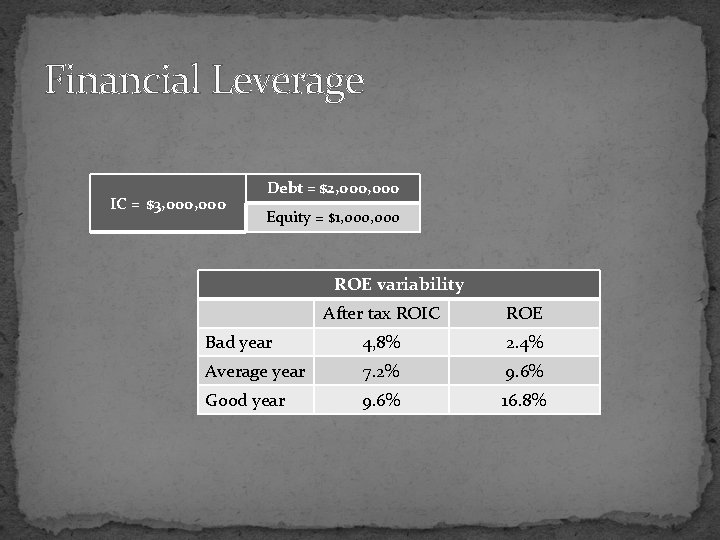
Financial Leverage IC = $3, 000 Debt = $2, 000 Equity = $1, 000 ROE variability After tax ROIC ROE Bad year 4, 8% 2. 4% Average year 7. 2% 9. 6% Good year 9. 6% 16. 8%