Confirmatory Factor Analysis SAS Calis Download the Data


- Slides: 20
Confirmatory Factor Analysis SAS Calis
Download the Data • CFA-Wisc. xls on my Stat. Data page
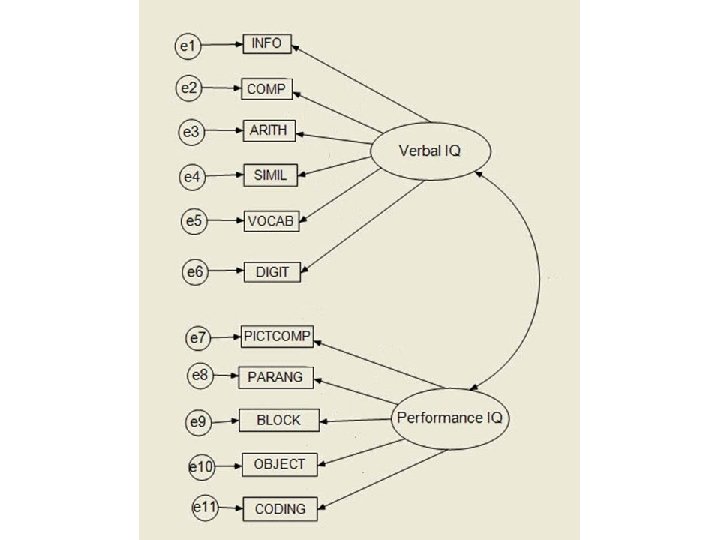
The WISC, Verbal IQ • INFOrmation – general knowledge questions • COMPrehension – of social situations and common concepts • ARITHmetic • SIMILarities – how are two words similar • VOCABulary • DIGITspan – repeating strings of digits after hearing them
The WISC, Performance IQ • PICTure. COMPletion – identify the missing part • PICTure. ARr. ANGement – arrange pictures to tell a story. • BLOCK design – arrange blocks to match model. • OBJECT assembly – puzzles involving arrangement of parts into a whole • CODING – associate simple shapes with symbols coding them
More on the WISC-R • http: //core. ecu. edu/psyc/wuenschk/MV/SE M/Wisc. pdf
Verbal IQ Proc Calis cov p. All; var Info Comp Arith Simil Vocab Digit Pict. Comp Pict. Arang Block Object Coding; LINEQS Info = v 1 F_Verbal + e 1, Comp = v 2 F_Verbal + e 2, Arith = v 3 F_Verbal + e 3, Simil = v 4 F_Verbal + e 4, Vocab = v 5 F_Verbal + e 5, Digit = v 6 F_Verbal + e 6,
Performance IQ Pict. Comp = p 1 F_Perform + e 7, Pict. Arang = p 2 F_Perform + e 8, Block = p 3 F_Perform + e 9, Object = p 4 F_Perform + e 10, Coding = p 5 F_Perform + e 11;
Variances & Covariances STD F_Verbal F_Perform = 1. 0, e 1 -e 11 = e_var 1 -e_var 11; • Factor variances fixed at 1 COV F_Verbal F_Perform = phi; run; • phi is the covariance between factors, to be estimated.
Squared Multiple Correlations Variable Error Variance Info 3. 58625 Comp 4. 59852 Arith 3. 62255 Simil 5. 12480 Vocab 3. 50724 Digit 6. 19784 Pict. Comp 5. 55762 Pict. Arang 5. 49428 Block 3. 91618 Object 5. 49876 Coding 8. 20597 Total Variance 8. 48131 8. 79310 5. 32184 10. 13550 8. 60085 7. 31251 8. 60966 7. 07389 7. 34319 8. 08821 8. 24906 R-Square 0. 5772 0. 4770 0. 3193 0. 4944 0. 5922 0. 1524 0. 3545 0. 2233 0. 4667 0. 3202 0. 00522
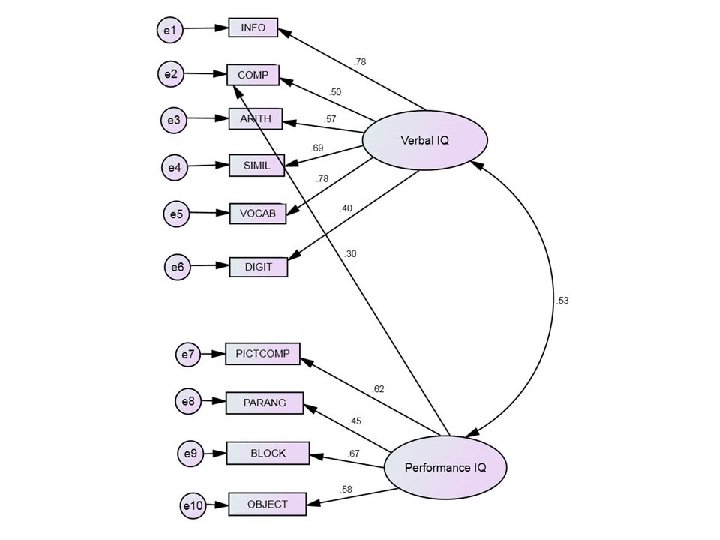
Standardized Results for Linear Equations Info = 0. 7597 * F_Verbal Comp = 0. 6907 * F_Verbal Arith = 0. 5651 * F_Verbal Simil = 0. 7031 * F_Verbal Vocab = 0. 7696 * F_Verbal Digit = 0. 3904 * F_Verbal Pict. Comp = 0. 5954 * F_Perform Pict. Arang = 0. 4725 * F_Perform Block = 0. 6831 * F_Perform Object = 0. 5658 * F_Perform Coding = 0. 0723 * F_Perform
Coding Performance Factor Linear Equations Coding = 0. 2076 Std Err 0. 2559 t Value 0. 8113 * F_Perform p 5 Not Significant
Correlation Between the Factors Standardized Results for Covariances Among Exogenous Variables Var 1 Var 2 Parameter F_Verbal F_Perform phi Estimate Standard Error 0. 58884 0. 07557 t Value 7. 79214
Chi-Square Fit Summary 70. 2359 Chi-Square DF Pr > Chi-Square 43 0. 0054 poor fit Standardized RMSR (SRMSR) 0. 0585 below. 08 is good RMSEA Estimate 0. 0603. 05 = good, . 08 = mediocre RMSEA Lower 90% Confidence Limit 0. 0330 RMSEA Upper 90% Confidence Limit 0. 0851 Probability of Close Fit 0. 2391 OK, not significant Bentler Comparative Fit Index 0. 9410 . 90 to. 95 is marginal Bentler-Bonett NFI 0. 8639 below. 90 is poor fit Bentler-Bonett Non-normed Index 0. 9245 90 to. 95 is marginal
Lagrange Modifier Tests Rank Order of the 10 Largest LM Stat for Paths from Exogenous Variables To From LM Stat Pr > Chi. Sq Parm Change Comp F_Perform 9. 76682 0. 0018 0. 93990 Info F_Perform 4. 45100 0. 0349 -0. 59724 I am going to add a path from the Performance Factor to Comprehension. Comp = v 2 F_Verbal + vadd F_Perform + e 2,
Fit Summary, Model 2 Chi-Square 60. 2951 dropped from 70. 2 Chi-Square DF 42 Pr > Chi-Square 0. 0334 increased from. 005 Standardized RMSR (SRMSR) 0. 0538 dropped, still good RMSEA Estimate 0. 0500 dropped, now good fit RMSEA Lower 90% Confidence Limit 0. 0147 RMSEA Upper 90% Confidence Limit 0. 0767 Probability of Close Fit 0. 4730 good fit Bentler Comparative Fit Index 0. 9603 up, now good fit Bentler-Bonett NFI 0. 8832 up, still poor fit Bentler-Bonett Non-normed Index 0. 9481 up, still marginal
Performance to Coding Linear Equations Coding = 0. 2010 * Std Err 0. 2542 t Value 0. 7909 F_Perform p 5 This path is not significant. I am going to drop Coding from the model.
Fit Summary Chi-Square 45. 0176 down from 60. 3 Chi-Square DF 33 Pr > Chi-Square 0. 0792 Now OK, not sig. Standardized RMSR (SRMSR) 0. 0492 dropped, still good RMSEA Estimate 0. 0457 dropped from. 05 RMSEA Lower 90% Confidence Limit 0. 0000 RMSEA Upper 90% Confidence Limit 0. 0766 Probability of Close Fit 0. 5553 still good fit Bentler Comparative Fit Index 0. 9736 up from. 96 Bentler-Bonett NFI 0. 9100 up from poor to marginal Bentler-Bonett Non-normed Index 0. 9640 up, now good fit
Complete Output for All Three Models