Chapter 9 Key Performance Indicators Plan Evaluation Modification


- Slides: 24
Chapter 9: Key Performance Indicators, Plan Evaluation, & Modification LORI MURPHY 2 -16 -15
Chapter Overview Review + expansion of familiar concepts Data-Informed Key Approach Accountability Performance Indicators (KPIs) Performance Indicators (PIs) All-Encompassing/Campus-Wide Efforts
Chapter Overview Introduction Data of new concepts Dashboards Strategic Communications (Marketing) Shift to Strategic Enrollment Management SEM Council Reporting to Governing Boards
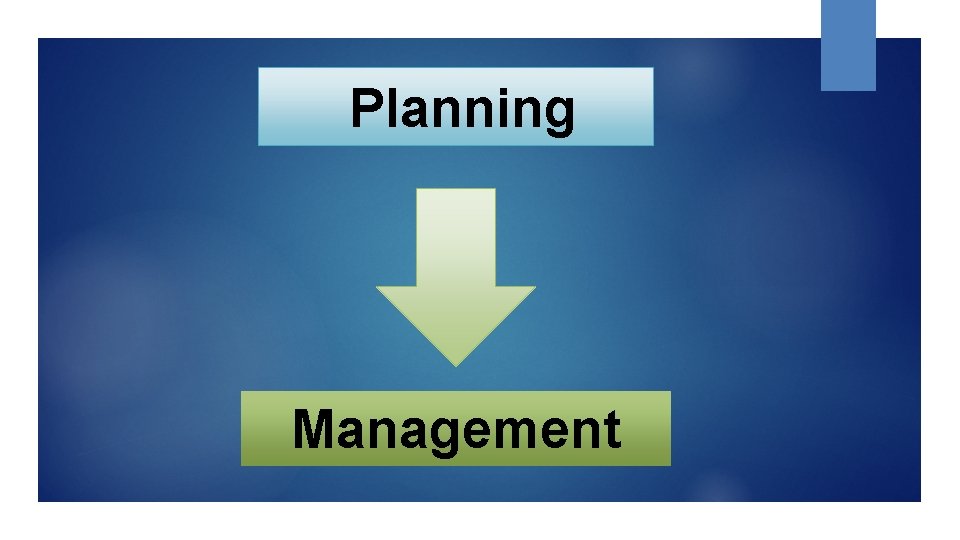
Planning Management
Shift to Strategic Enrollment Management When: Once the strategic plan has been created Who: High-level SEM Council Why: Implementation & Oversight Ensure plan is implemented Continue to scan environment & SEP datasets for emerging opportunities Making additions/revisions to the plan in future years
Role of SEM Council Monitor implementation including tracking of KPIs and PIs Quarterly meetings to assess progress and recommend changes Share progress reports Sponsor campus-wide events—ex. Best practice sharing, meetings to discuss impact of research findings, professional development Recognize campus contributions & celebrating accomplishments Develop revised strategic enrollment plan
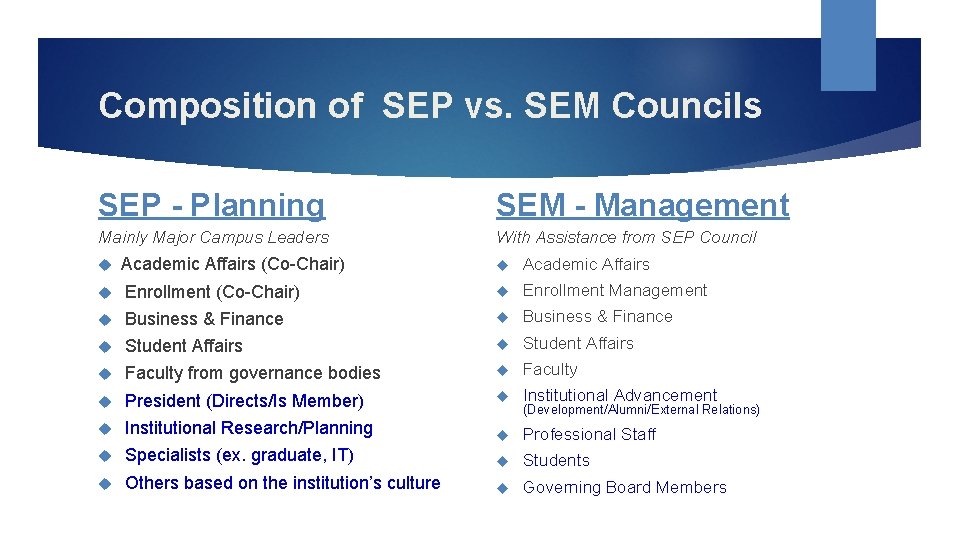
Composition of SEP vs. SEM Councils SEP - Planning SEM - Management Mainly Major Campus Leaders With Assistance from SEP Council Academic Affairs (Co-Chair) Academic Affairs Enrollment (Co-Chair) Enrollment Management Business & Finance Student Affairs Faculty from governance bodies Faculty President (Directs/Is Member) Institutional Advancement Institutional Research/Planning Professional Staff Specialists (ex. graduate, IT) Students Others based on the institution’s culture Governing Board Members (Development/Alumni/External Relations)
SEM Steering/Working Group Subcommittee Meet monthly to evaluate plan progress Track KPIs Track measures of effectiveness of each strategy & action plan Track updated information for new internal & external assessments and projections Update broader SEM Council & make recommendations for changes Who should be a part of this group?
Additional SEM Subcommittee - Budget Optional depending on institution size/needs Meet twice annually Review census data from fall & spring terms; evaluate implications for enrollment projections Inform SEM council about necessary changes
“Research unequivocally confirms that ongoing measurement is critical to longterm success” ROWLEY, LUJAN, AND DOLENCE (1997)
Key Performance Indicators (KPIs) Institution-specific, commonly acknowledged, data-derived measurements critical to the mission & fiscal health of the institution Enable historical comparisons & SWOT analysis Reflect impact of cross-departmental cooperation Points of differentiation for institutional comparisons Complex, improve over long time periods Ex. 3 -5 years before ROI
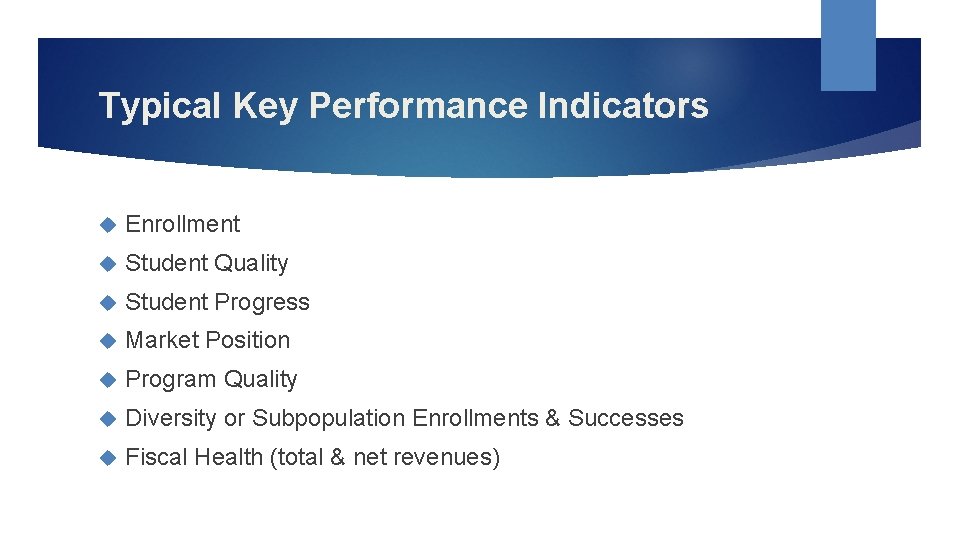
Typical Key Performance Indicators Enrollment Student Quality Student Progress Market Position Program Quality Diversity or Subpopulation Enrollments & Successes Fiscal Health (total & net revenues)
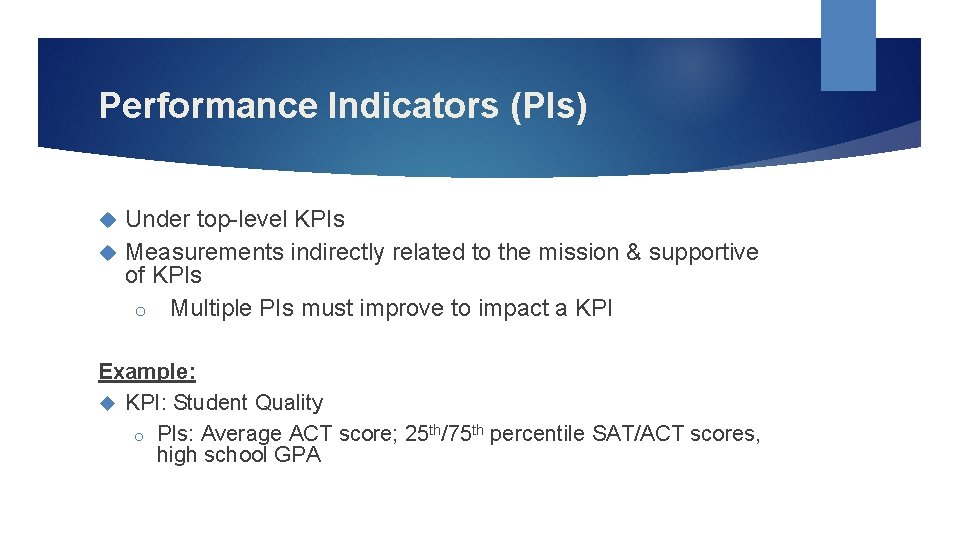
Performance Indicators (PIs) Under top-level KPIs Measurements indirectly related to the mission & supportive of KPIs o Multiple PIs must improve to impact a KPI Example: KPI: Student Quality o PIs: Average ACT score; 25 th/75 th percentile SAT/ACT scores, high school GPA
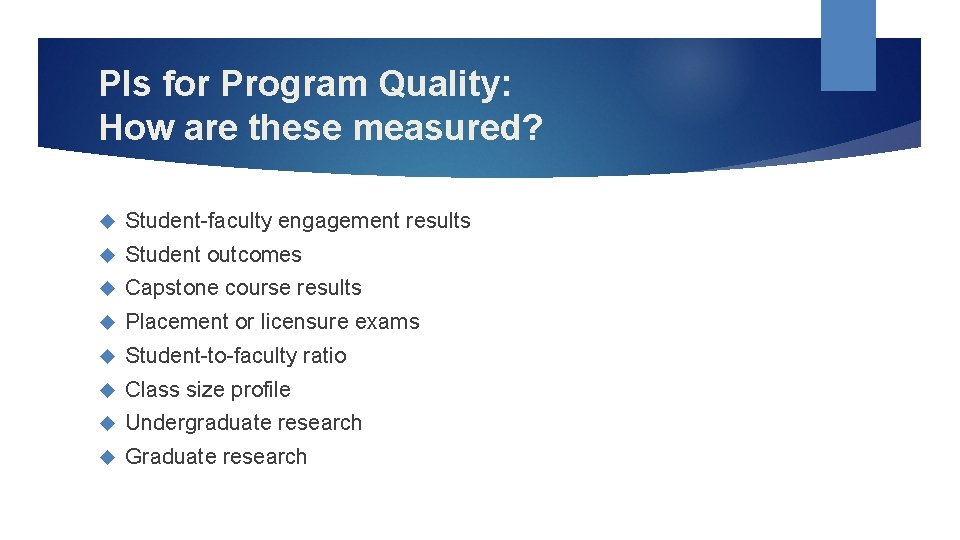
PIs for Program Quality: How are these measured? Student-faculty engagement results Student outcomes Capstone course results Placement or licensure exams Student-to-faculty ratio Class size profile Undergraduate research Graduate research
“Measure what you value, and value what you measure”
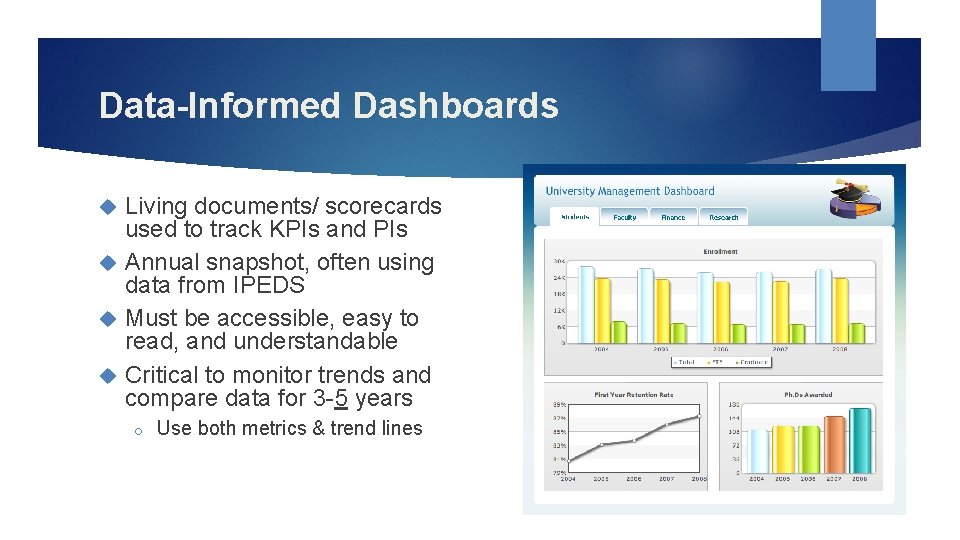
Data-Informed Dashboards Living documents/ scorecards used to track KPIs and PIs Annual snapshot, often using data from IPEDS Must be accessible, easy to read, and understandable Critical to monitor trends and compare data for 3 -5 years o Use both metrics & trend lines
No Institution Is an Island
Peers Aspirants Competitors
Providing Dashboards More Context Environmental & political climate factors to consider: Employment Enrollment trends patterns Demographic Price shifts (WICHE data) sensitivity Federal and state funding formulas
Multi-Level Dashboards Institutional Dashboards Unit- or Program-Specific Dashboards Essential Includes for data-informed decision making sub-level PIs Need to include most essential metrics for measuring institutional progress Importance of ensuring that unit-level goals tie into overarching institutional goals during the SEP process
An All-Encompassing Effort: Challenge for SEM Councils SEM Council cannot measure all aspects of the institution but entire institutional experience impacts: New student enrollment o Student persistence & completion o Learning outcomes o Need to effectively communicate to entire campus the impact their work on institutional enrollment efforts Use the term “Strategic Communications” instead of “Marketing” to get buy-in from academic sectors o Emphasize importance of communicating values, vision, ideals, and outcomes o
Challenges of Connecting Program-Level Assessments to Top-Level KPI Share perspectives from your personal work experiences Capturing the data… Is your office intentional about capturing program-level data? Are learning outcomes and assessment measures are created before programs are created/executed? o Are outcomes/measures developed in consistent manner within your division? o Do staff conducting assessments have adequate knowledge/training?
Challenges of Connecting Program-Level Assessments to Top-Level KPI Share perspectives from your personal work experiences Communicating the data… Is data communicated up to leadership in your division? the data communicated from your division to institutional leadership and other areas across campus?