CHAPTER 5 Exponential and Logarithmic Functions 5 1

- Slides: 24
CHAPTER 5: Exponential and Logarithmic Functions 5. 1 5. 2 5. 3 5. 4 5. 5 Inverse Functions Exponential Functions and Graphs Logarithmic Functions and Graphs Properties of Logarithmic Functions Solving Exponential and Logarithmic Equations 5. 6 Applications and Models: Growth and Decay; and Compound Interest Copyright © 2012 Pearson Education, Inc. Publishing as Addison Wesley
5. 2 Exponential Functions and Graphs · · Graph exponential equations and exponential functions. Solve applied problems involving exponential functions and their graphs. Copyright © 2012 Pearson Education, Inc. Publishing as Addison Wesley
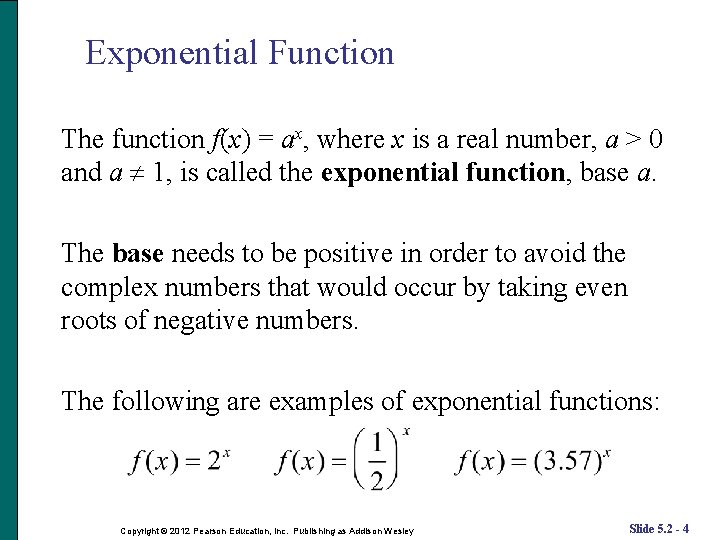
Exponential Function The function f(x) = ax, where x is a real number, a > 0 and a 1, is called the exponential function, base a. The base needs to be positive in order to avoid the complex numbers that would occur by taking even roots of negative numbers. The following are examples of exponential functions: Copyright © 2012 Pearson Education, Inc. Publishing as Addison Wesley Slide 5. 2 - 4
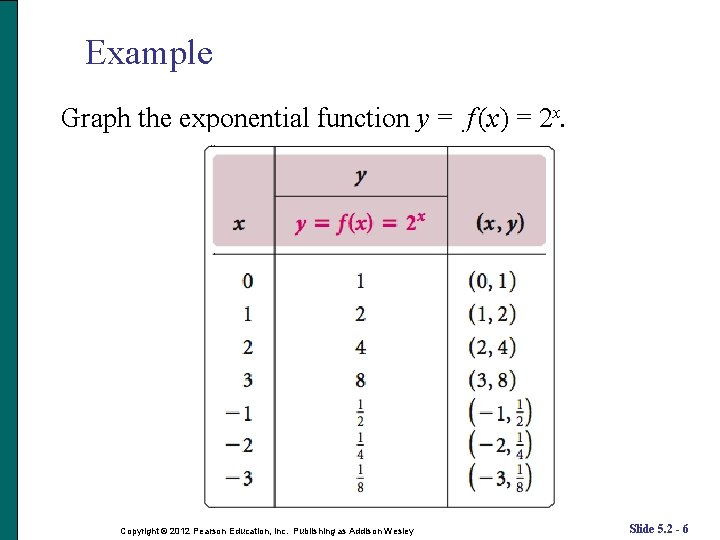
Graphing Exponential Functions To graph an exponential function, follow the steps listed: 1. Compute some function values and list the results in a table. 2. Plot the points and connect them with a smooth curve. Be sure to plot enough points to determine how steeply the curve rises. Copyright © 2012 Pearson Education, Inc. Publishing as Addison Wesley Slide 5. 2 - 5
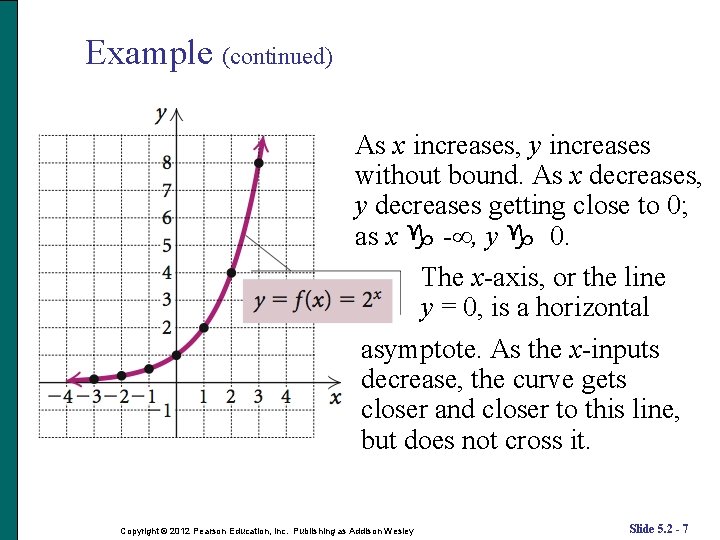
Example Graph the exponential function y = f (x) = 2 x. Copyright © 2012 Pearson Education, Inc. Publishing as Addison Wesley Slide 5. 2 - 6
Example (continued) As x increases, y increases without bound. As x decreases, y decreases getting close to 0; as x g -∞, y g 0. The x-axis, or the line y = 0, is a horizontal asymptote. As the x-inputs decrease, the curve gets closer and closer to this line, but does not cross it. Copyright © 2012 Pearson Education, Inc. Publishing as Addison Wesley Slide 5. 2 - 7
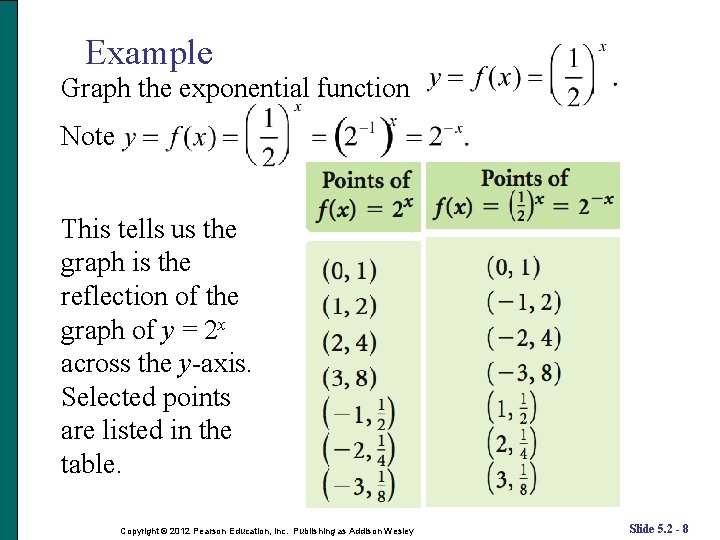
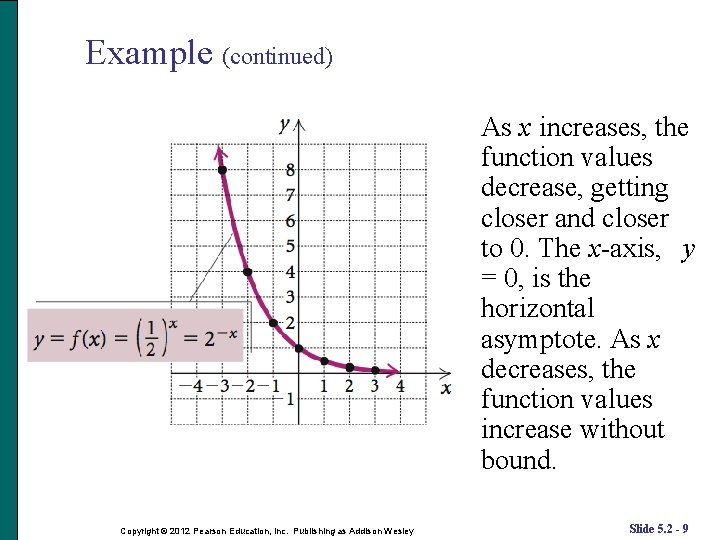
Example Graph the exponential function Note This tells us the graph is the reflection of the graph of y = 2 x across the y-axis. Selected points are listed in the table. Copyright © 2012 Pearson Education, Inc. Publishing as Addison Wesley Slide 5. 2 - 8
Example (continued) As x increases, the function values decrease, getting closer and closer to 0. The x-axis, y = 0, is the horizontal asymptote. As x decreases, the function values increase without bound. Copyright © 2012 Pearson Education, Inc. Publishing as Addison Wesley Slide 5. 2 - 9
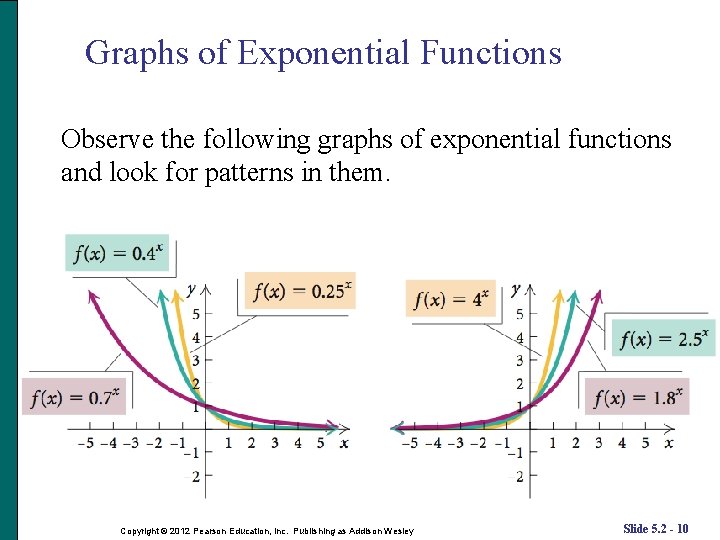
Graphs of Exponential Functions Observe the following graphs of exponential functions and look for patterns in them. Copyright © 2012 Pearson Education, Inc. Publishing as Addison Wesley Slide 5. 2 - 10
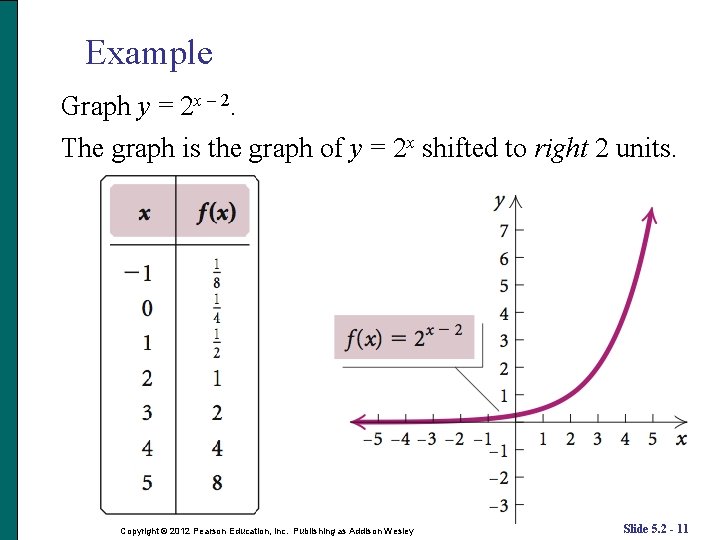
Example Graph y = 2 x – 2. The graph is the graph of y = 2 x shifted to right 2 units. Copyright © 2012 Pearson Education, Inc. Publishing as Addison Wesley Slide 5. 2 - 11
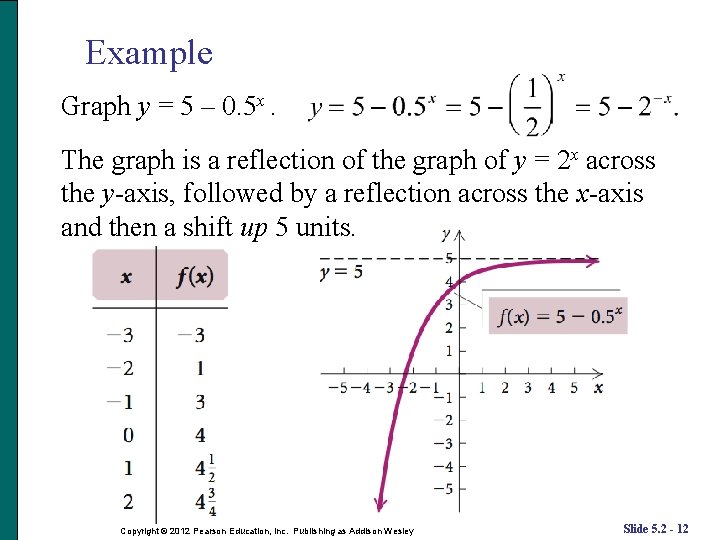
Example Graph y = 5 – 0. 5 x. The graph is a reflection of the graph of y = 2 x across the y-axis, followed by a reflection across the x-axis and then a shift up 5 units. Copyright © 2012 Pearson Education, Inc. Publishing as Addison Wesley Slide 5. 2 - 12
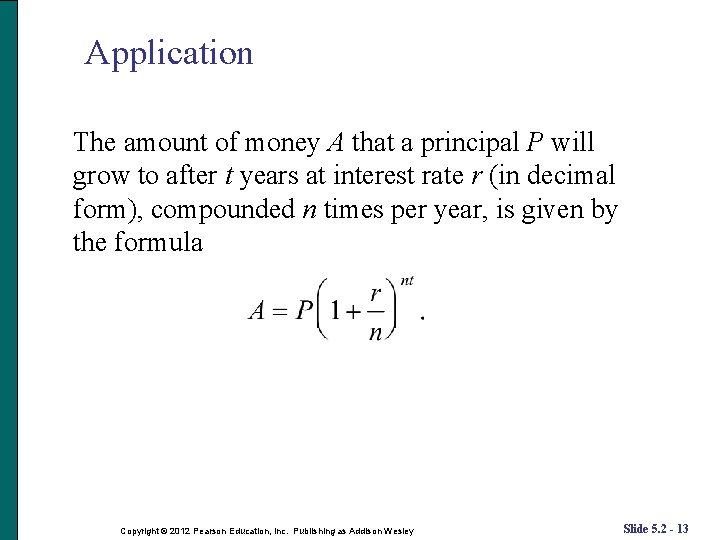
Application The amount of money A that a principal P will grow to after t years at interest rate r (in decimal form), compounded n times per year, is given by the formula Copyright © 2012 Pearson Education, Inc. Publishing as Addison Wesley Slide 5. 2 - 13
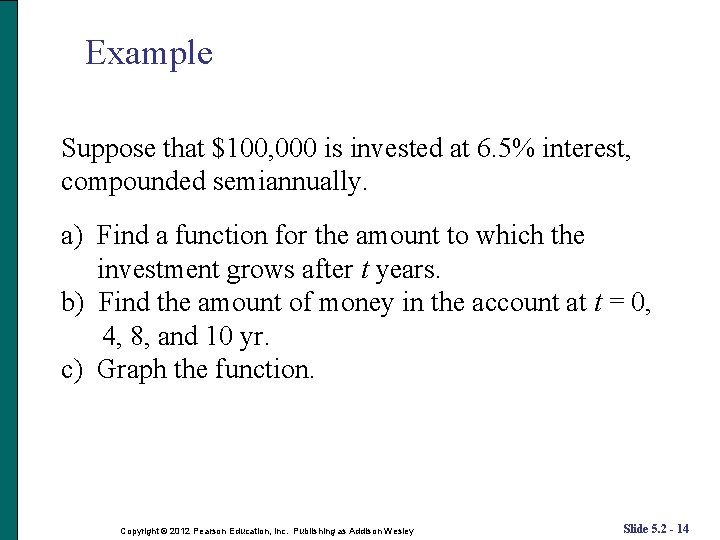
Example Suppose that $100, 000 is invested at 6. 5% interest, compounded semiannually. a) Find a function for the amount to which the investment grows after t years. b) Find the amount of money in the account at t = 0, 4, 8, and 10 yr. c) Graph the function. Copyright © 2012 Pearson Education, Inc. Publishing as Addison Wesley Slide 5. 2 - 14
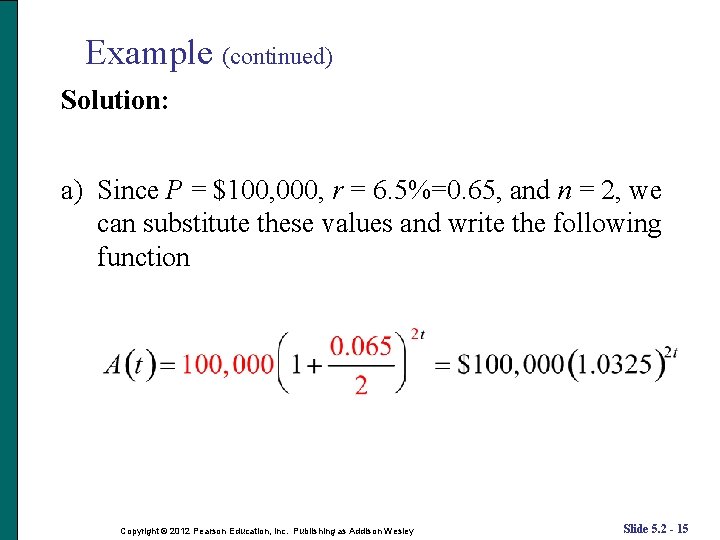
Example (continued) Solution: a) Since P = $100, 000, r = 6. 5%=0. 65, and n = 2, we can substitute these values and write the following function Copyright © 2012 Pearson Education, Inc. Publishing as Addison Wesley Slide 5. 2 - 15
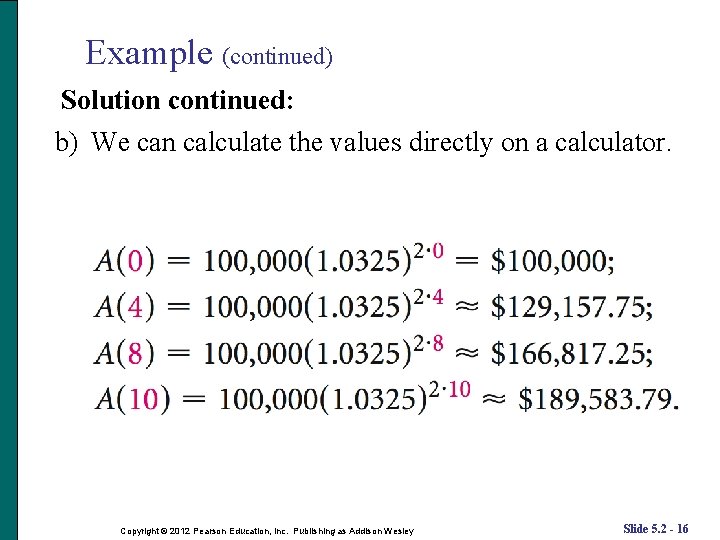
Example (continued) Solution continued: b) We can calculate the values directly on a calculator. Copyright © 2012 Pearson Education, Inc. Publishing as Addison Wesley Slide 5. 2 - 16
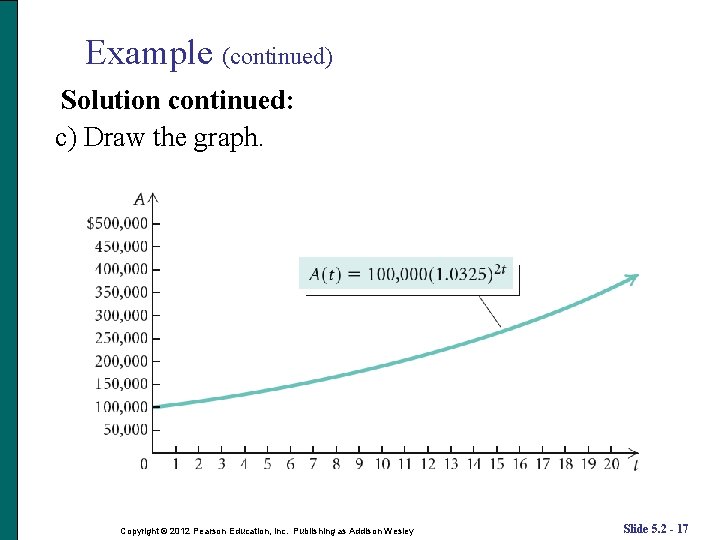
Example (continued) Solution continued: c) Draw the graph. Copyright © 2012 Pearson Education, Inc. Publishing as Addison Wesley Slide 5. 2 - 17
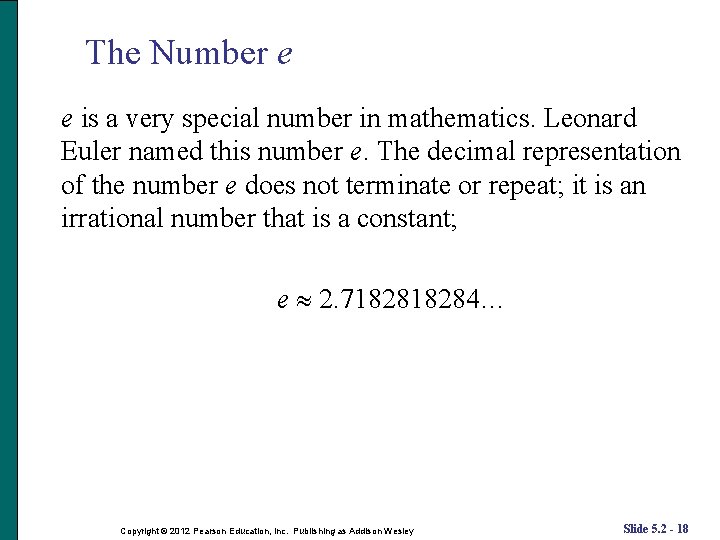
The Number e e is a very special number in mathematics. Leonard Euler named this number e. The decimal representation of the number e does not terminate or repeat; it is an irrational number that is a constant; e 2. 718284… Copyright © 2012 Pearson Education, Inc. Publishing as Addison Wesley Slide 5. 2 - 18
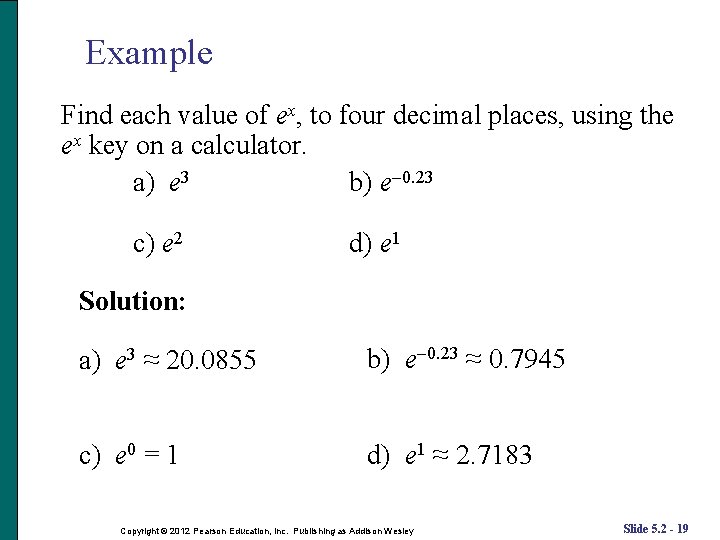
Example Find each value of ex, to four decimal places, using the ex key on a calculator. a) e 3 b) e 0. 23 c) e 2 d) e 1 Solution: a) e 3 ≈ 20. 0855 b) e 0. 23 ≈ 0. 7945 c) e 0 = 1 d) e 1 ≈ 2. 7183 Copyright © 2012 Pearson Education, Inc. Publishing as Addison Wesley Slide 5. 2 - 19
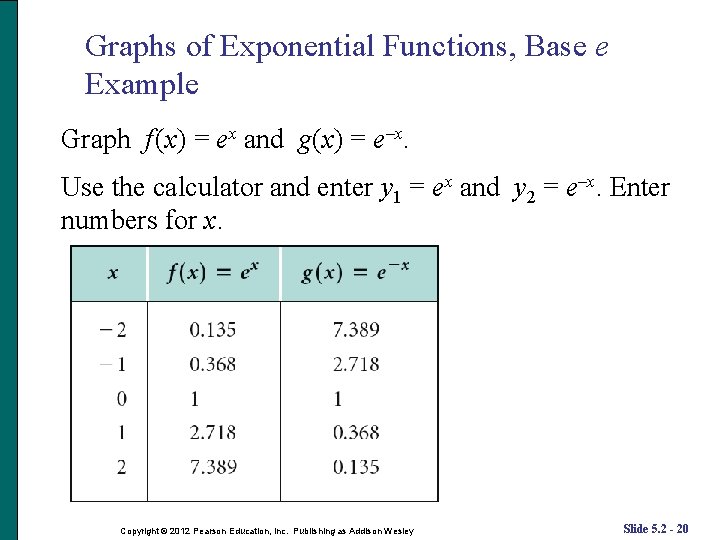
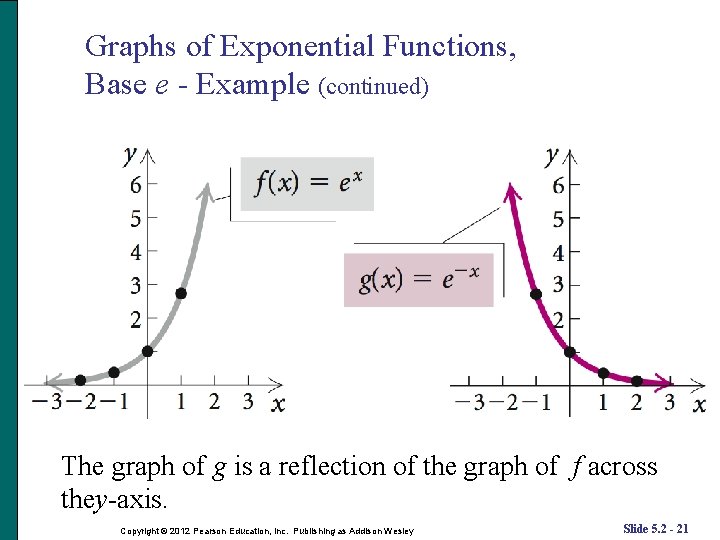
Graphs of Exponential Functions, Base e Example Graph f (x) = ex and g(x) = e–x. Use the calculator and enter y 1 = ex and y 2 = e–x. Enter numbers for x. Copyright © 2012 Pearson Education, Inc. Publishing as Addison Wesley Slide 5. 2 - 20
Graphs of Exponential Functions, Base e - Example (continued) The graph of g is a reflection of the graph of f across they-axis. Copyright © 2012 Pearson Education, Inc. Publishing as Addison Wesley Slide 5. 2 - 21
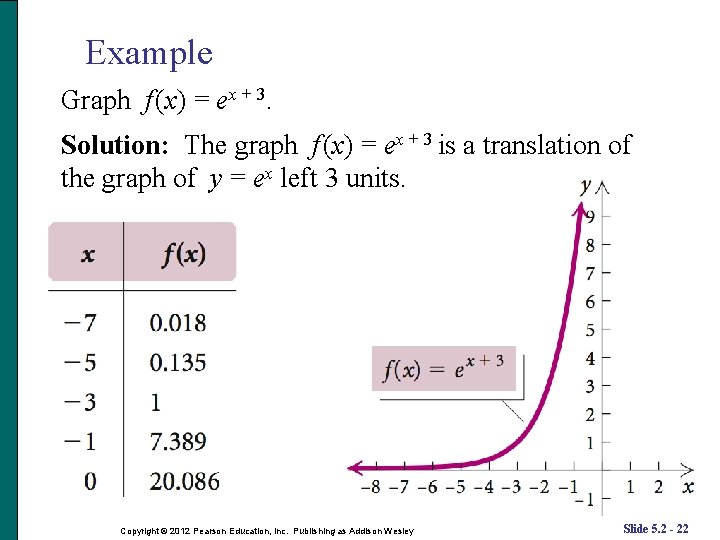
Example Graph f (x) = ex + 3. Solution: The graph f (x) = ex + 3 is a translation of the graph of y = ex left 3 units. Copyright © 2012 Pearson Education, Inc. Publishing as Addison Wesley Slide 5. 2 - 22
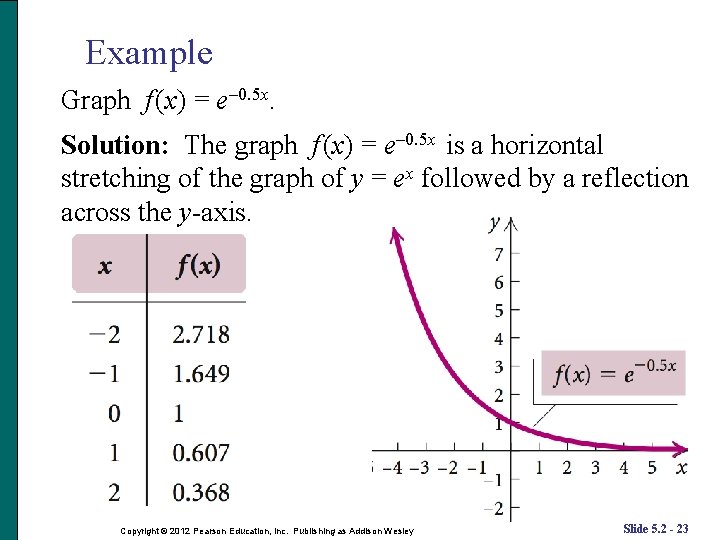
Example Graph f (x) = e– 0. 5 x. Solution: The graph f (x) = e– 0. 5 x is a horizontal stretching of the graph of y = ex followed by a reflection across the y-axis. Copyright © 2012 Pearson Education, Inc. Publishing as Addison Wesley Slide 5. 2 - 23
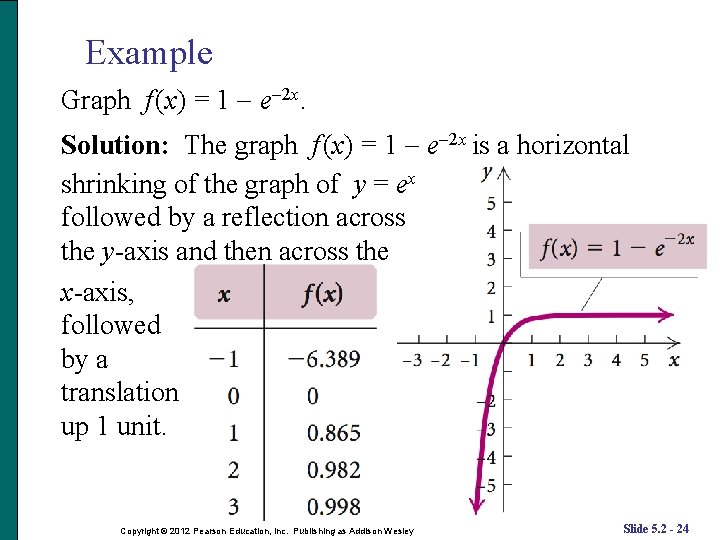
Example Graph f (x) = 1 e 2 x. Solution: The graph f (x) = 1 e 2 x is a horizontal shrinking of the graph of y = ex followed by a reflection across the y-axis and then across the x-axis, followed by a translation up 1 unit. Copyright © 2012 Pearson Education, Inc. Publishing as Addison Wesley Slide 5. 2 - 24