Chapter 11 Cost of Capital PPT 11 1

- Slides: 23
Chapter 11 Cost of Capital
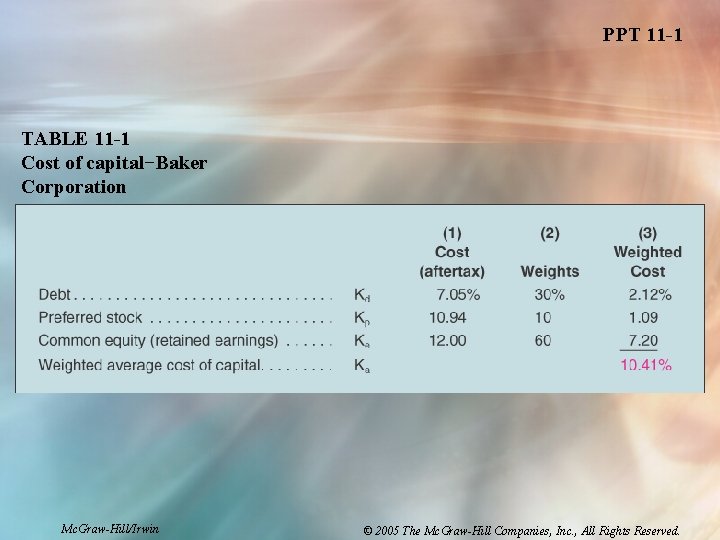
PPT 11 -1 TABLE 11 -1 Cost of capital−Baker Corporation Mc. Graw-Hill/Irwin © 2005 The Mc. Graw-Hill Companies, Inc. , All Rights Reserved.
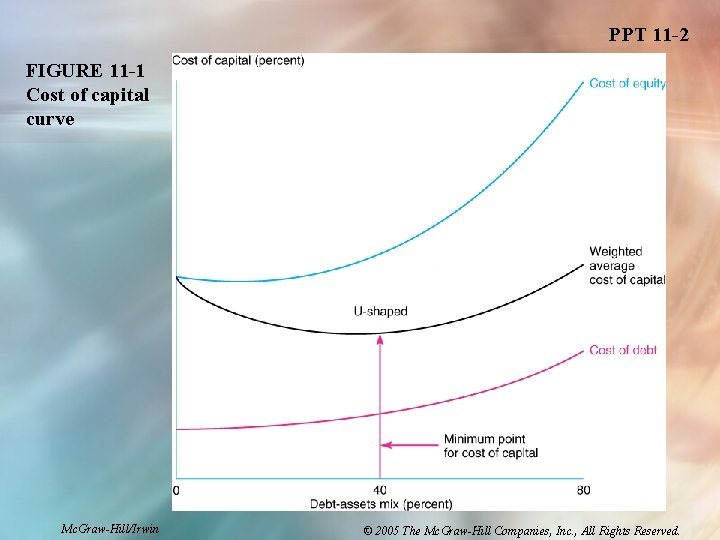
PPT 11 -2 FIGURE 11 -1 Cost of capital curve Mc. Graw-Hill/Irwin © 2005 The Mc. Graw-Hill Companies, Inc. , All Rights Reserved.
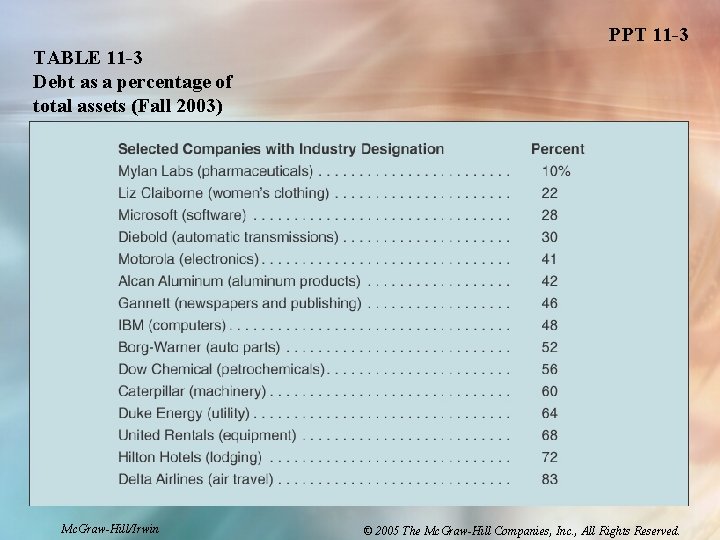
PPT 11 -3 TABLE 11 -3 Debt as a percentage of total assets (Fall 2003) Mc. Graw-Hill/Irwin © 2005 The Mc. Graw-Hill Companies, Inc. , All Rights Reserved.
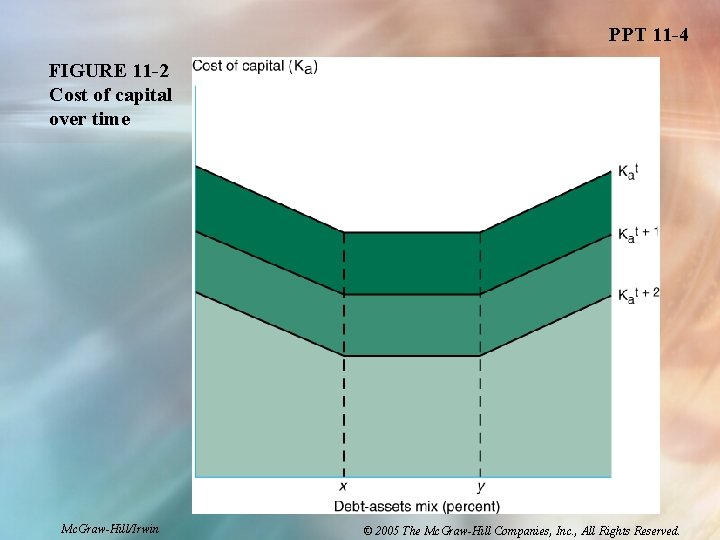
PPT 11 -4 FIGURE 11 -2 Cost of capital over time Mc. Graw-Hill/Irwin © 2005 The Mc. Graw-Hill Companies, Inc. , All Rights Reserved.
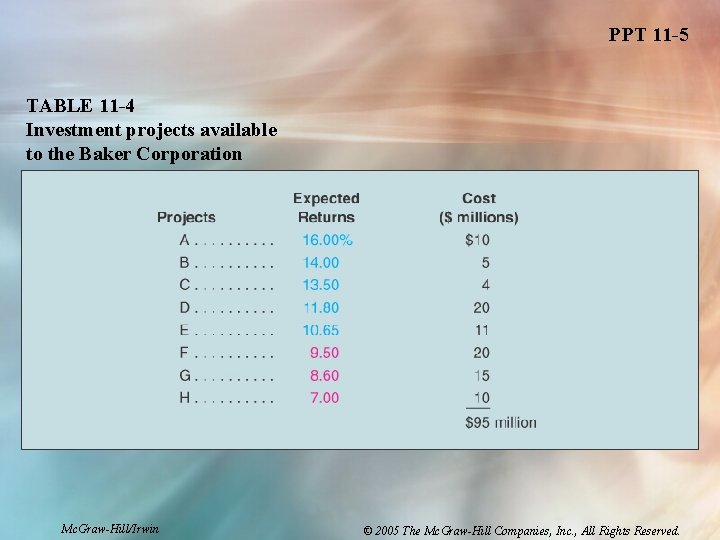
PPT 11 -5 TABLE 11 -4 Investment projects available to the Baker Corporation Mc. Graw-Hill/Irwin © 2005 The Mc. Graw-Hill Companies, Inc. , All Rights Reserved.
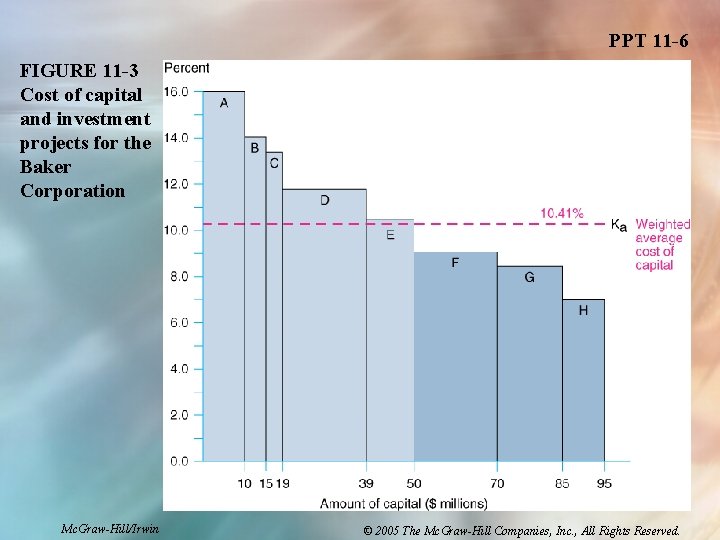
PPT 11 -6 FIGURE 11 -3 Cost of capital and investment projects for the Baker Corporation Mc. Graw-Hill/Irwin © 2005 The Mc. Graw-Hill Companies, Inc. , All Rights Reserved.
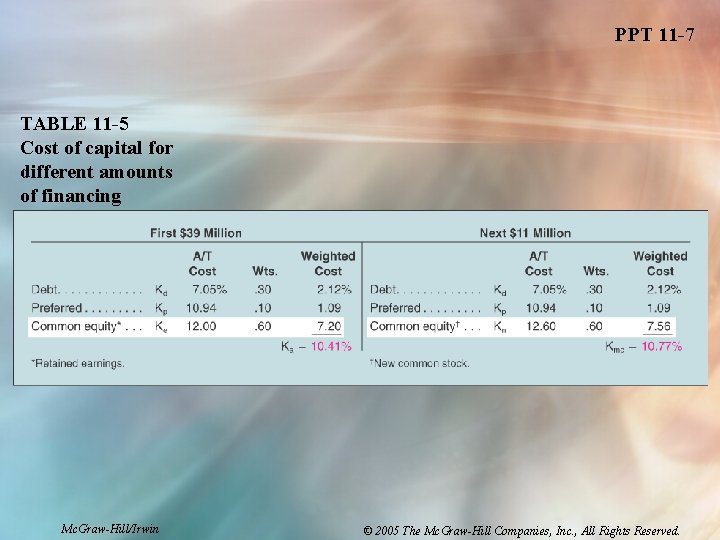
PPT 11 -7 TABLE 11 -5 Cost of capital for different amounts of financing Mc. Graw-Hill/Irwin © 2005 The Mc. Graw-Hill Companies, Inc. , All Rights Reserved.
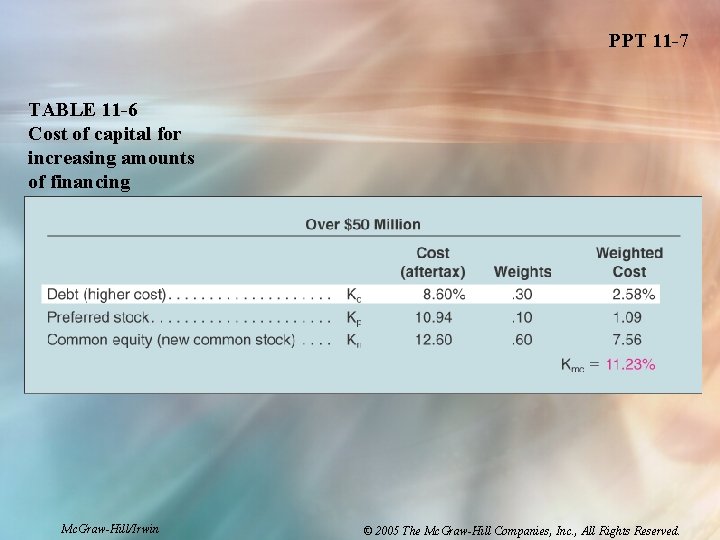
PPT 11 -7 TABLE 11 -6 Cost of capital for increasing amounts of financing Mc. Graw-Hill/Irwin © 2005 The Mc. Graw-Hill Companies, Inc. , All Rights Reserved.
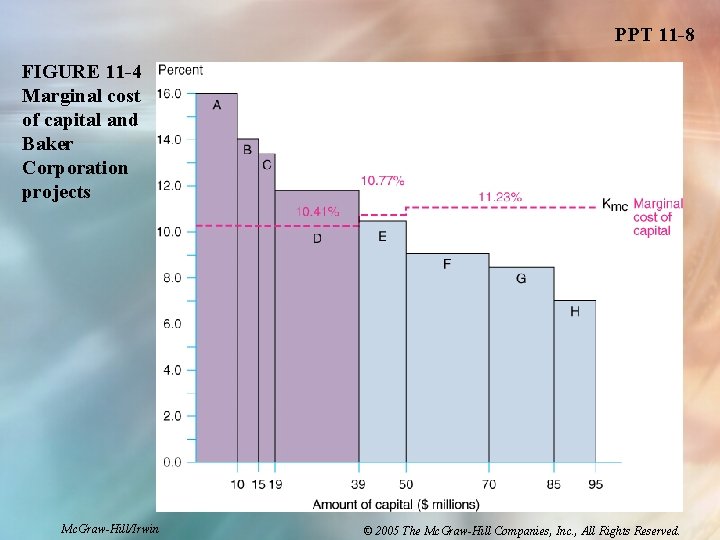
PPT 11 -8 FIGURE 11 -4 Marginal cost of capital and Baker Corporation projects Mc. Graw-Hill/Irwin © 2005 The Mc. Graw-Hill Companies, Inc. , All Rights Reserved.
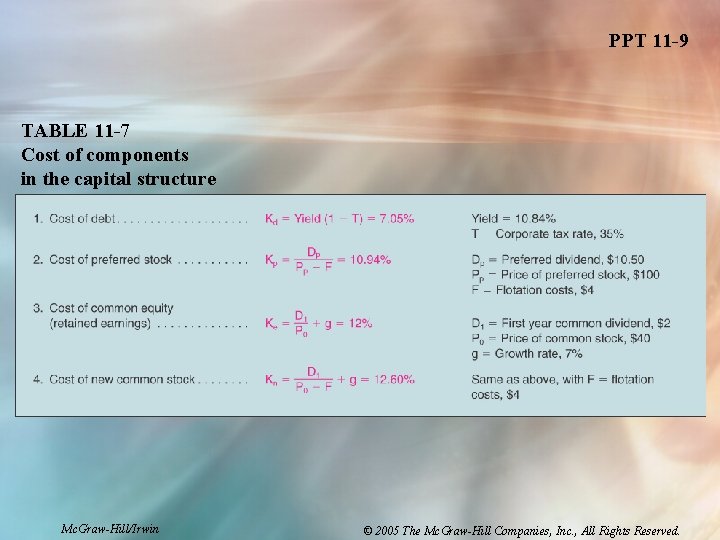
PPT 11 -9 TABLE 11 -7 Cost of components in the capital structure Mc. Graw-Hill/Irwin © 2005 The Mc. Graw-Hill Companies, Inc. , All Rights Reserved.
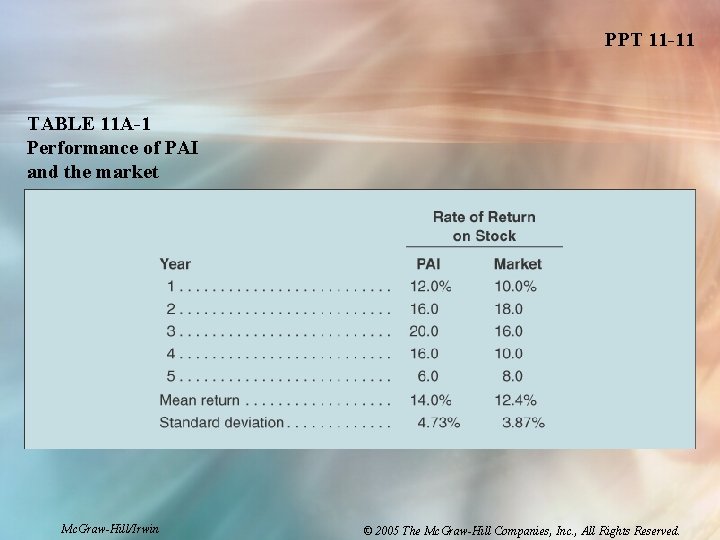
PPT 11 -11 TABLE 11 A-1 Performance of PAI and the market Mc. Graw-Hill/Irwin © 2005 The Mc. Graw-Hill Companies, Inc. , All Rights Reserved.
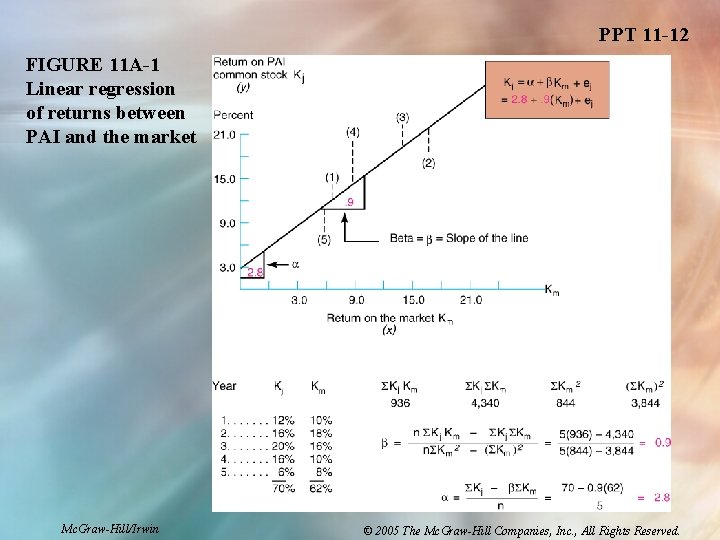
PPT 11 -12 FIGURE 11 A-1 Linear regression of returns between PAI and the market Mc. Graw-Hill/Irwin © 2005 The Mc. Graw-Hill Companies, Inc. , All Rights Reserved.
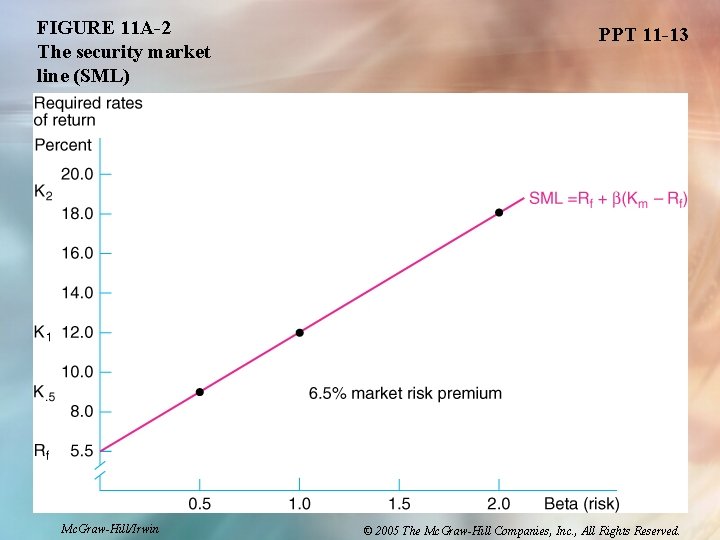
FIGURE 11 A-2 The security market line (SML) Mc. Graw-Hill/Irwin PPT 11 -13 © 2005 The Mc. Graw-Hill Companies, Inc. , All Rights Reserved.
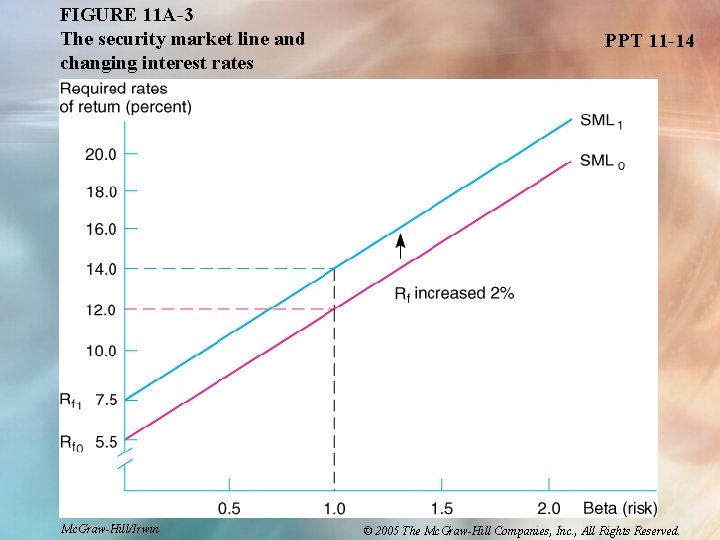
FIGURE 11 A-3 The security market line and changing interest rates Mc. Graw-Hill/Irwin PPT 11 -14 © 2005 The Mc. Graw-Hill Companies, Inc. , All Rights Reserved.
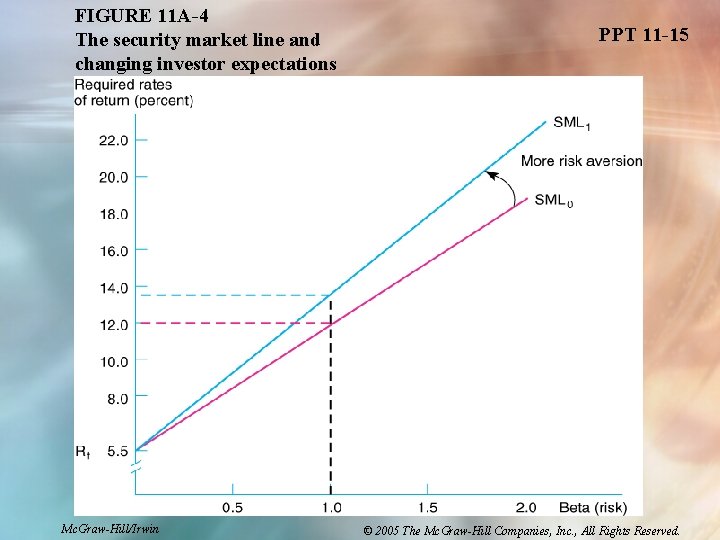
FIGURE 11 A-4 The security market line and changing investor expectations Mc. Graw-Hill/Irwin PPT 11 -15 © 2005 The Mc. Graw-Hill Companies, Inc. , All Rights Reserved.
Chapter 11 - Outline LT 11 -1 n Cost of Capital n Cost of Debt n Cost of Preferred Stock n Cost of Common Equity: – Retained Earnings – New Common Stock n Optimum Mc. Graw-Hill/Irwin Capital Structure © 2005 The Mc. Graw-Hill Companies, Inc. , All Rights Reserved.
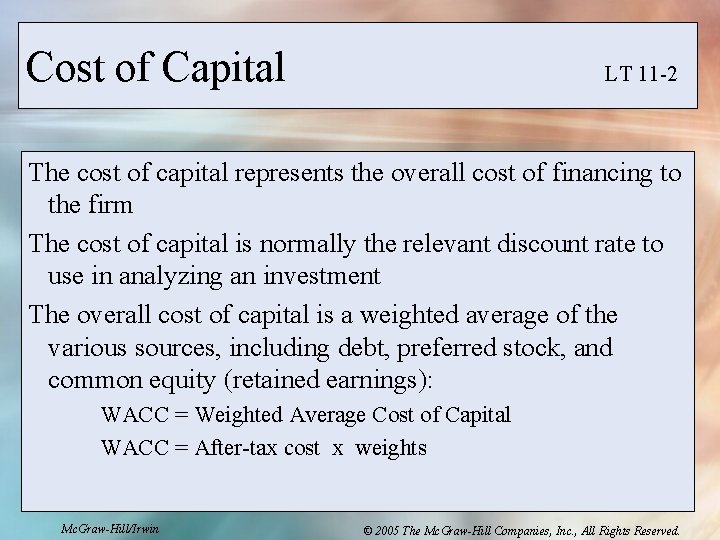
Cost of Capital LT 11 -2 The cost of capital represents the overall cost of financing to the firm The cost of capital is normally the relevant discount rate to use in analyzing an investment The overall cost of capital is a weighted average of the various sources, including debt, preferred stock, and common equity (retained earnings): WACC = Weighted Average Cost of Capital WACC = After-tax cost x weights Mc. Graw-Hill/Irwin © 2005 The Mc. Graw-Hill Companies, Inc. , All Rights Reserved.
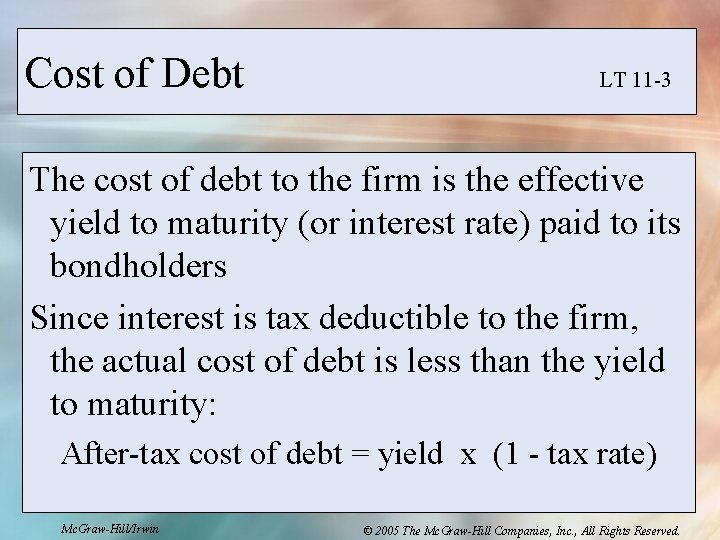
Cost of Debt LT 11 -3 The cost of debt to the firm is the effective yield to maturity (or interest rate) paid to its bondholders Since interest is tax deductible to the firm, the actual cost of debt is less than the yield to maturity: After-tax cost of debt = yield x (1 - tax rate) Mc. Graw-Hill/Irwin © 2005 The Mc. Graw-Hill Companies, Inc. , All Rights Reserved.
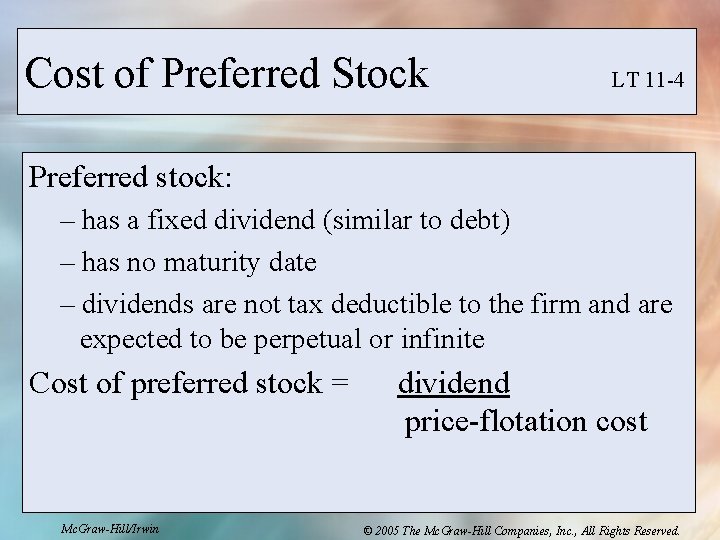
Cost of Preferred Stock LT 11 -4 Preferred stock: – has a fixed dividend (similar to debt) – has no maturity date – dividends are not tax deductible to the firm and are expected to be perpetual or infinite Cost of preferred stock = Mc. Graw-Hill/Irwin dividend price-flotation cost © 2005 The Mc. Graw-Hill Companies, Inc. , All Rights Reserved.
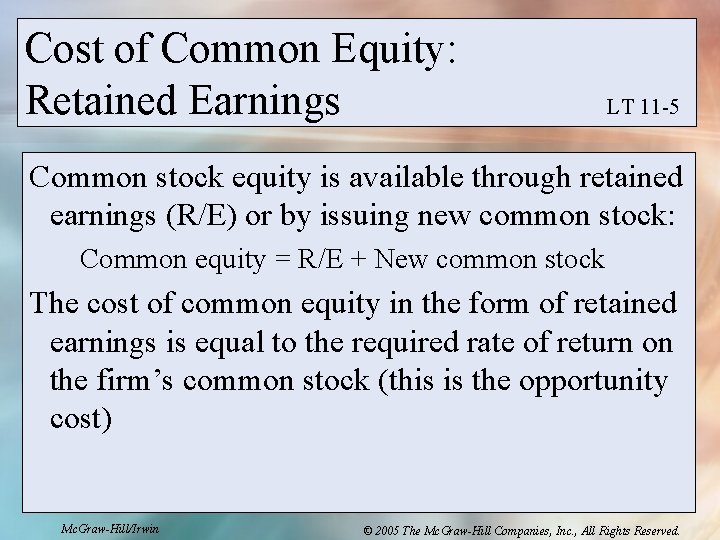
Cost of Common Equity: Retained Earnings LT 11 -5 Common stock equity is available through retained earnings (R/E) or by issuing new common stock: Common equity = R/E + New common stock The cost of common equity in the form of retained earnings is equal to the required rate of return on the firm’s common stock (this is the opportunity cost) Mc. Graw-Hill/Irwin © 2005 The Mc. Graw-Hill Companies, Inc. , All Rights Reserved.
Cost of Common Equity: New Common Stock LT 11 -6 The cost of new common stock is higher than the cost of retained earnings because of flotation costs Flotation costs: selling and distribution costs (such as sales commissions) for the new securities Mc. Graw-Hill/Irwin © 2005 The Mc. Graw-Hill Companies, Inc. , All Rights Reserved.
Optimum Capital Structure LT 11 -7 The optimal (best) situation is associated with the minimum overall cost of capital: Optimum capital structure means the lowest WACC Usually occurs with 30 -50% debt in a firm’s capital structure WACC is also referred to as the required rate of return or the discount rate Mc. Graw-Hill/Irwin © 2005 The Mc. Graw-Hill Companies, Inc. , All Rights Reserved.