Atmospheric Overturning of Indian Summer Monsoon as seen
")
 is one of the most")
 Reduce the 4 -D dataset into a 2 -D coordinate")

 and coastlines (red")
 convective-scale, (b) large-scale and")
 averaged over")


")


- Slides: 18
Atmospheric Overturning of Indian Summer Monsoon: as seen through the Isentropic Analysis Xingchao (XC) Chen 1, Olivier Pauluis 2 , Fuqing Zhang 1 1 Department of Meteorology, The Pennsylvania State University, and Center for Advanced Data Assimilation and Predictability Techniques, University Park, Pennsylvania, USA 2 Courant Institute of Mathematical Sciences. New York University, New York, USA
Indian Summer Monsoon 1. The Indian summer monsoon (ISM) is one of the most vigorous weather phenomena 2. It affecting the Indian subcontinent every year from June through September (JJAS). 3. It contributes about 80% of the total annual precipitation over the region and has substantial influences to the agricultural and industrial productions in India 4. The ISM exhibits strong low frequency variability in the form of “active” and “break” spells of monsoon rainfall, with two dominant modes on timescales of 30 -60 days and 10 -20 days. 5. The dynamics of ISM involves planetary-scale overturning and its interaction with mesoscale and convective-scale activities
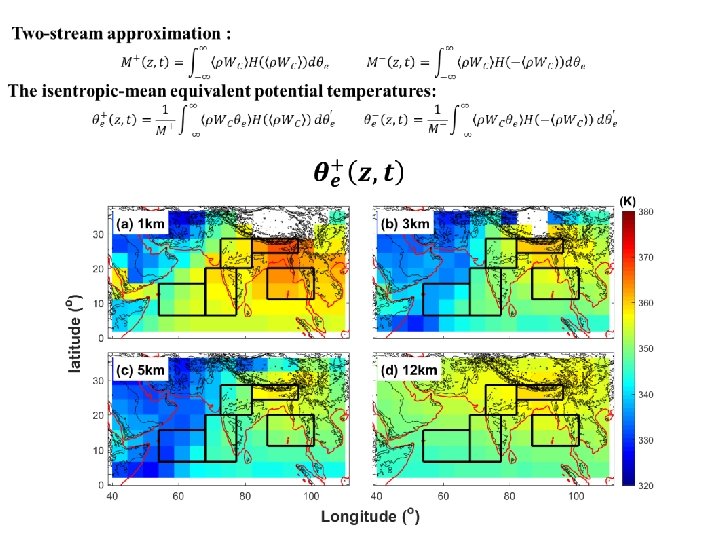
Isentropic Analysis Advantages: (1) Reduce the 4 -D dataset into a 2 -D coordinate (2) Identifying the atmospheric overturning associated with upward transport of warm moist air and downward transport of colder dryer air. (3) Systematically filtering gravity waves. (4) Vertical mass transport contributed by different scales of motions can thus be more easily identified. Pauluis and Mrowiec (2015)
MJO Study
Model domain used in the WRF simulations with topography (gray scales) and coastlines (red lines). Different subregions are shown by different color shadings (Blue: Arabian Sea; Green: Western Ghats; Yellow: North India; Red: Himalaya; Magenta: Bay of Bengal). The black polygon shows the Indian subcontinent.
Convective -scale Regionalscale Basinwide Isentropic streamfuctions associated with the (a) convective-scale, (b) large-scale and (c) basinscale averaged over whole WRF domain during JJAS (color shading, kg m− 2 s− 1).
Isentropic streamfuctions associated with convective-scale (color shading, kg m− 2 s− 1) averaged over (a) whole WRF domain; (b) Arabian Sea; (c) Western Ghats; (d) North India; (e) Himalaya and (f) Bay of Bengal during JJAS.
rain total Convective regional Basin-wide
Intraseasonal variability: Precipitation
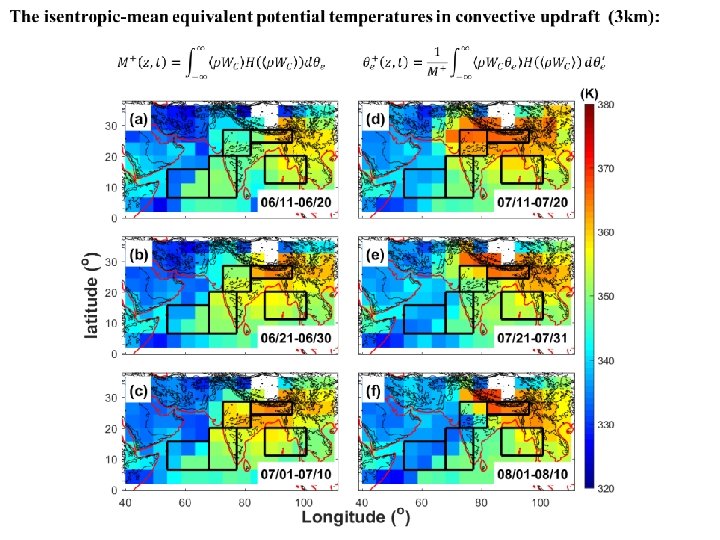
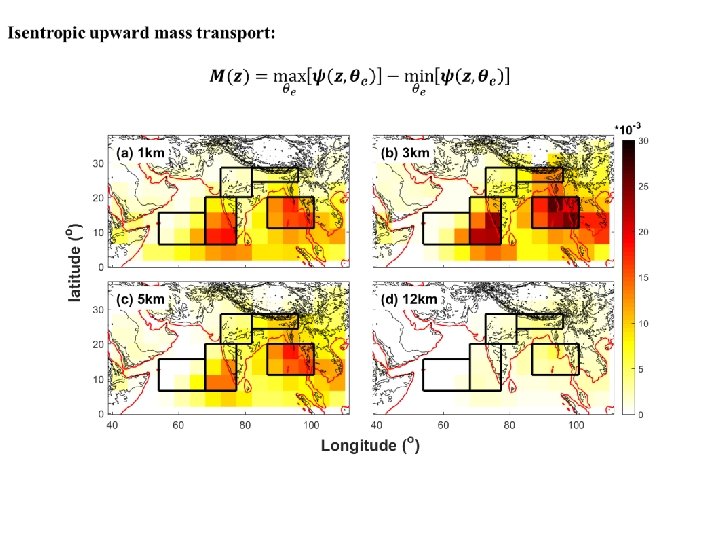
Intraseasonal variability: Upward mass transportation ( 3 km)
Intraseasonal variability:
Conclusion:
Regional simulation at gray zone resolution Spatial spacing: 9 km Integration: April 20 th to October 30 th The black box shows the climatic zone used for the calculation of KELLF index The blue polygon shows the Indian subcontinent
Regional simulation at gray zone resolution Time evolution of Somali Jet Time evolution of monsoon precipitation
Regional simulation at gray zone resolution Spatial distributions of 10 -day averaged daily surface rainfall anomalies in (a, e) 1 -10 July, (d, f) 11 -20 July, (c, g) 21 -31 July and (d, h) 01 -10 August, 2009 derived from TRMM (left panels) and WRF-gray (right panels).