Assessment of Southeast Florida Road User Costs presented


- Slides: 29
Assessment of Southeast Florida Road User Costs presented to Southeast Florida FSUTMS Users Group presented by Don Vary Cambridge Systematics, Inc. November 2, 2007
Agenda Project Overview Review of Methodologies Values Developed 2
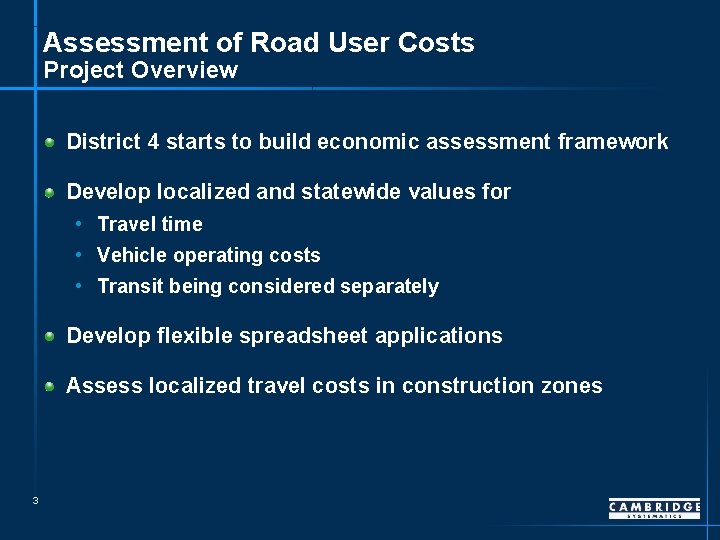
Assessment of Road User Costs Project Overview District 4 starts to build economic assessment framework Develop localized and statewide values for • Travel time • Vehicle operating costs • Transit being considered separately Develop flexible spreadsheet applications Assess localized travel costs in construction zones 3
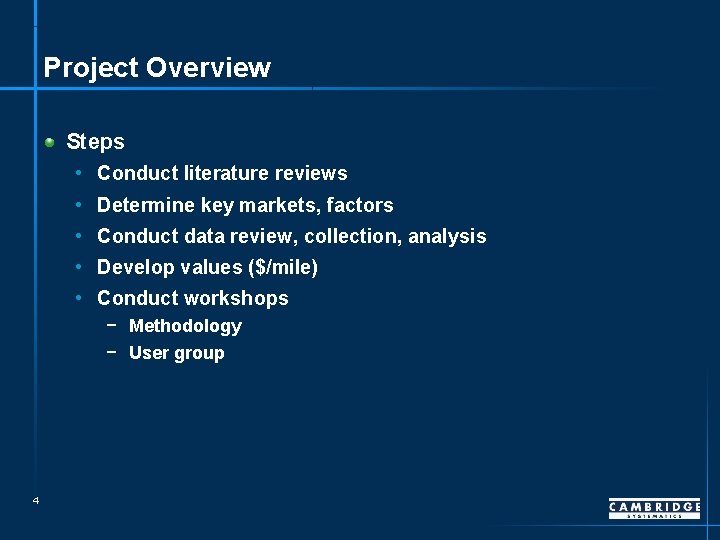
Project Overview Steps • Conduct literature reviews • Determine key markets, factors • Conduct data review, collection, analysis • Develop values ($/mile) • Conduct workshops − Methodology − User group 4
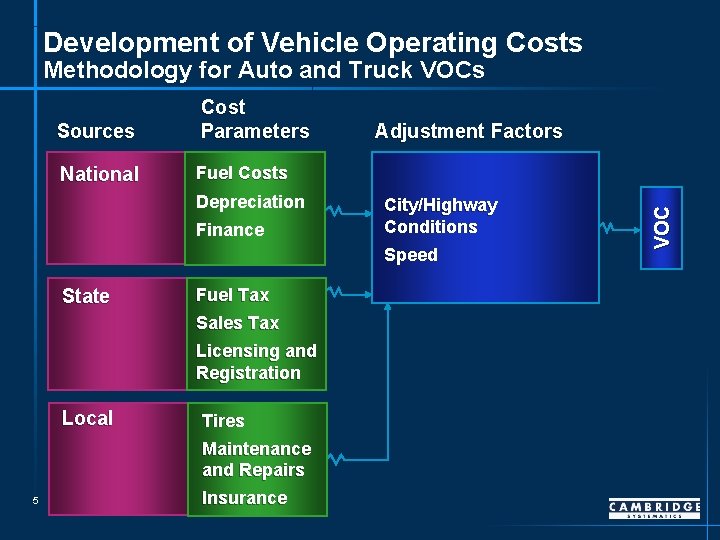
Development of Vehicle Operating Costs Methodology for Auto and Truck VOCs National Fuel Costs Depreciation Finance Adjustment Factors City/Highway Conditions Speed State Fuel Tax Sales Tax Licensing and Registration Local Tires Maintenance and Repairs 5 Insurance VOC Sources Cost Parameters
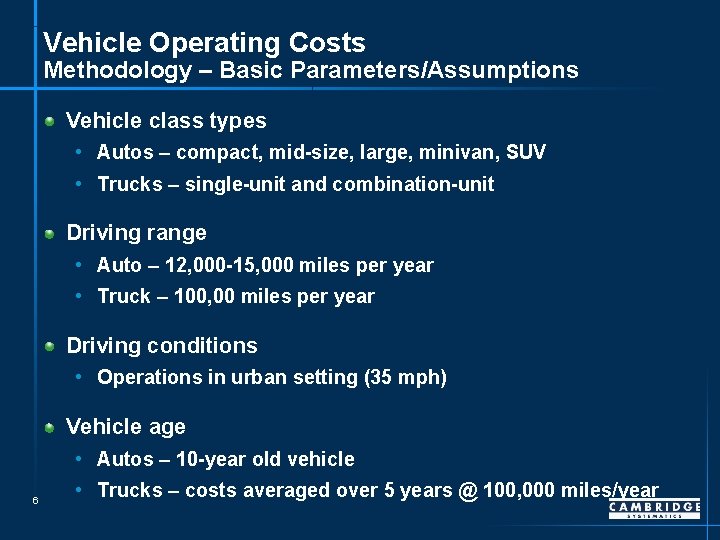
Vehicle Operating Costs Methodology – Basic Parameters/Assumptions Vehicle class types • Autos – compact, mid-size, large, minivan, SUV • Trucks – single-unit and combination-unit Driving range • Auto – 12, 000 -15, 000 miles per year • Truck – 100, 00 miles per year Driving conditions • Operations in urban setting (35 mph) Vehicle age • Autos – 10 -year old vehicle 6 • Trucks – costs averaged over 5 years @ 100, 000 miles/year
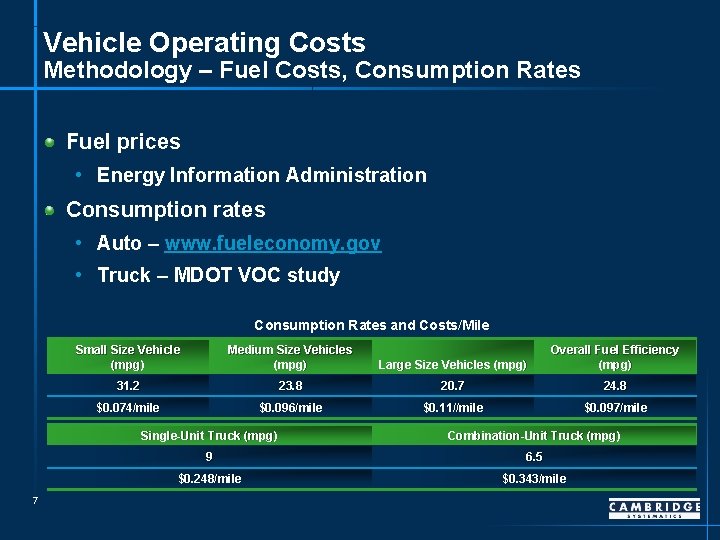
Vehicle Operating Costs Methodology – Fuel Costs, Consumption Rates Fuel prices • Energy Information Administration Consumption rates • Auto – www. fueleconomy. gov • Truck – MDOT VOC study Consumption Rates and Costs/Mile 7 Small Size Vehicle (mpg) Medium Size Vehicles (mpg) Large Size Vehicles (mpg) Overall Fuel Efficiency (mpg) 31. 2 23. 8 20. 7 24. 8 $0. 074/mile $0. 096/mile $0. 11//mile $0. 097/mile Single-Unit Truck (mpg) Combination-Unit Truck (mpg) 9 6. 5 $0. 248/mile $0. 343/mile
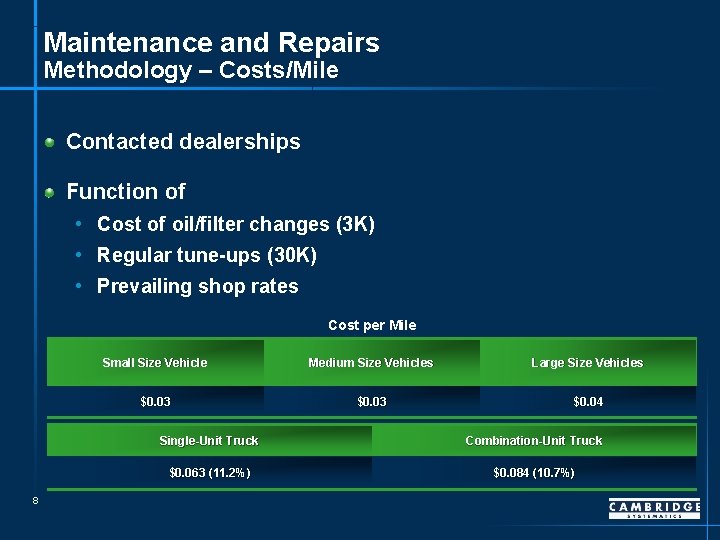
Maintenance and Repairs Methodology – Costs/Mile Contacted dealerships Function of • Cost of oil/filter changes (3 K) • Regular tune-ups (30 K) • Prevailing shop rates Cost per Mile 8 Small Size Vehicle Medium Size Vehicles Large Size Vehicles $0. 03 $0. 04 Single-Unit Truck Combination-Unit Truck $0. 063 (11. 2%) $0. 084 (10. 7%)
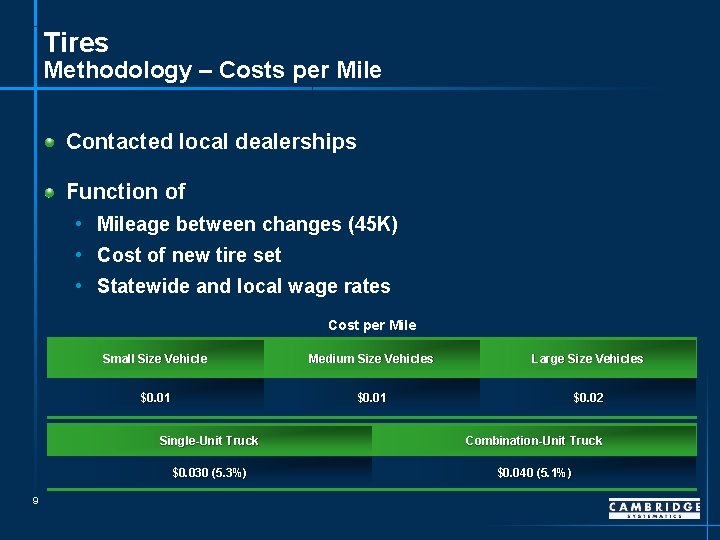
Tires Methodology – Costs per Mile Contacted local dealerships Function of • Mileage between changes (45 K) • Cost of new tire set • Statewide and local wage rates Cost per Mile 9 Small Size Vehicle Medium Size Vehicles Large Size Vehicles $0. 01 $0. 02 Single-Unit Truck Combination-Unit Truck $0. 030 (5. 3%) $0. 040 (5. 1%)
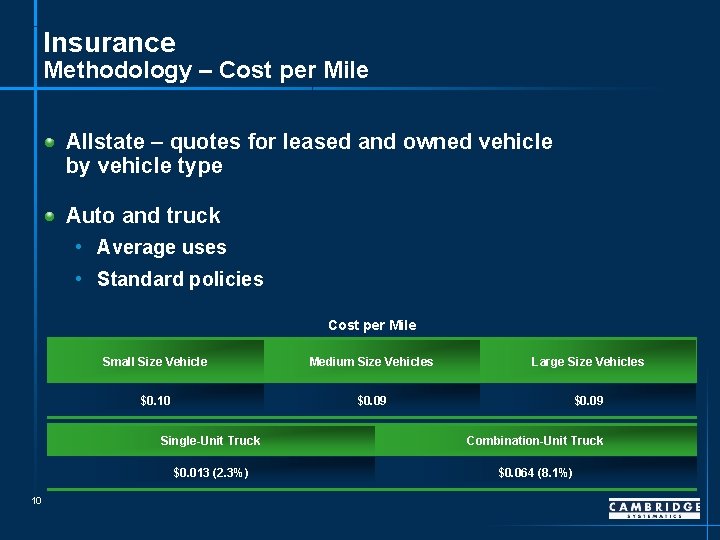
Insurance Methodology – Cost per Mile Allstate – quotes for leased and owned vehicle by vehicle type Auto and truck • Average uses • Standard policies Cost per Mile 10 Small Size Vehicle Medium Size Vehicles Large Size Vehicles $0. 10 $0. 09 Single-Unit Truck Combination-Unit Truck $0. 013 (2. 3%) $0. 064 (8. 1%)
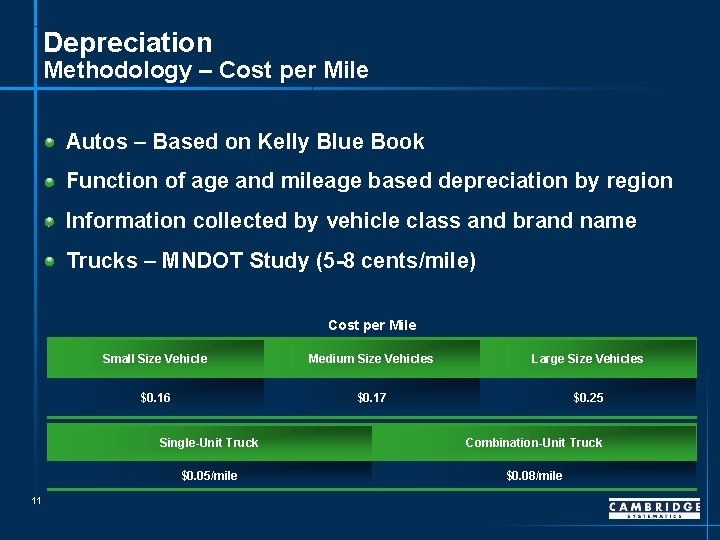
Depreciation Methodology – Cost per Mile Autos – Based on Kelly Blue Book Function of age and mileage based depreciation by region Information collected by vehicle class and brand name Trucks – MNDOT Study (5 -8 cents/mile) Cost per Mile 11 Small Size Vehicle Medium Size Vehicles Large Size Vehicles $0. 16 $0. 17 $0. 25 Single-Unit Truck Combination-Unit Truck $0. 05/mile $0. 08/mile
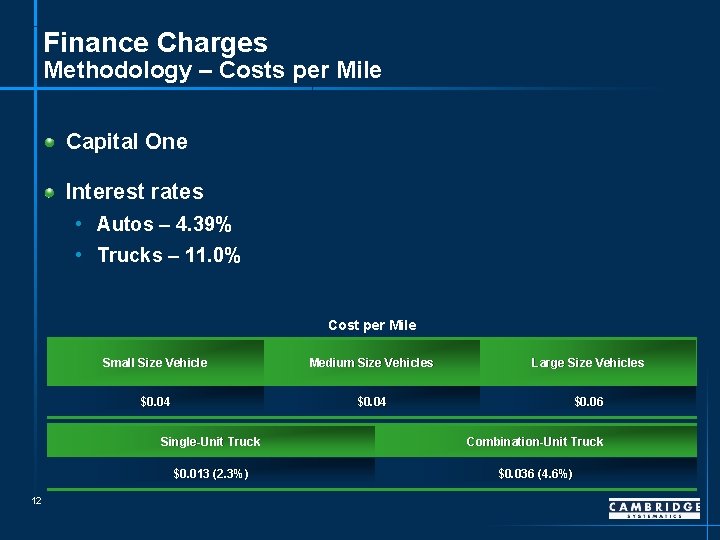
Finance Charges Methodology – Costs per Mile Capital One Interest rates • Autos – 4. 39% • Trucks – 11. 0% Cost per Mile 12 Small Size Vehicle Medium Size Vehicles Large Size Vehicles $0. 04 $0. 06 Single-Unit Truck Combination-Unit Truck $0. 013 (2. 3%) $0. 036 (4. 6%)
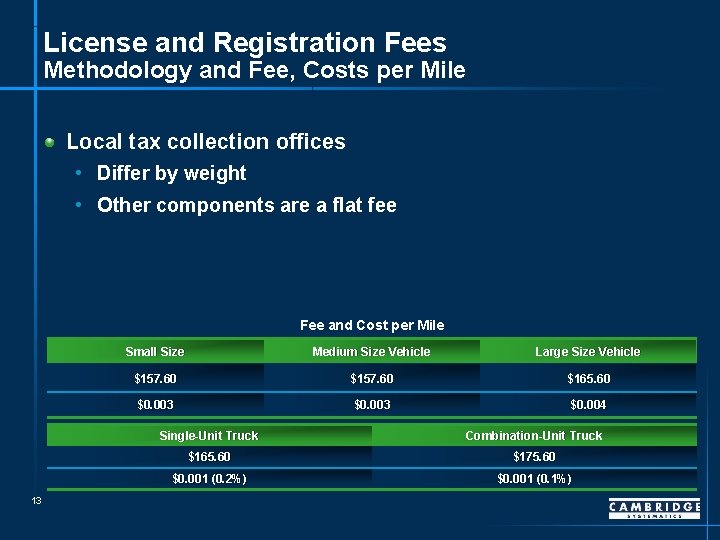
License and Registration Fees Methodology and Fee, Costs per Mile Local tax collection offices • Differ by weight • Other components are a flat fee Fee and Cost per Mile 13 Small Size Medium Size Vehicle Large Size Vehicle $157. 60 $165. 60 $0. 003 $0. 004 Single-Unit Truck Combination-Unit Truck $165. 60 $175. 60 $0. 001 (0. 2%) $0. 001 (0. 1%)
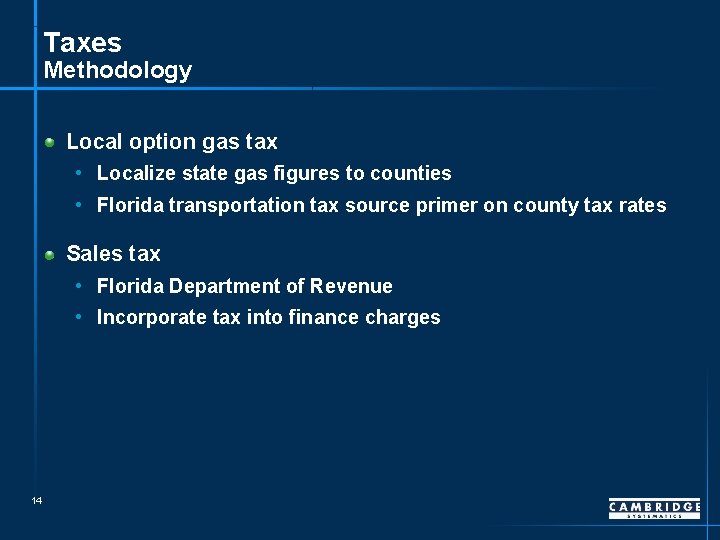
Taxes Methodology Local option gas tax • Localize state gas figures to counties • Florida transportation tax source primer on county tax rates Sales tax • Florida Department of Revenue • Incorporate tax into finance charges 14
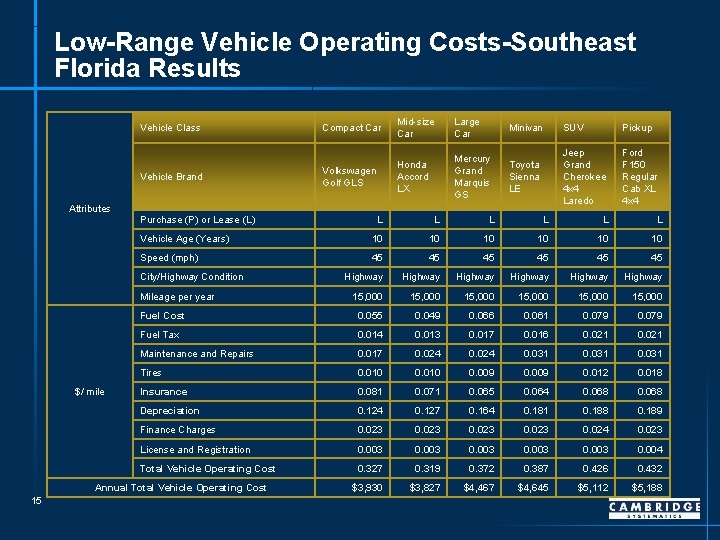
Low-Range Vehicle Operating Costs-Southeast Florida Results Vehicle Class Vehicle Brand Attributes Purchase (P) or Lease (L) Large Car Minivan SUV Pickup Volkswagen Golf GLS Honda Accord LX Mercury Grand Marquis GS Toyota Sienna LE Jeep Grand Cherokee 4 x 4 Laredo Ford F 150 Regular Cab XL 4 x 4 L L L Vehicle Age (Years) 10 10 10 Speed (mph) 45 45 45 Highway Highway 15, 000 15, 000 Fuel Cost 0. 055 0. 049 0. 066 0. 061 0. 079 Fuel Tax 0. 014 0. 013 0. 017 0. 016 0. 021 Maintenance and Repairs 0. 017 0. 024 0. 031 Tires 0. 010 0. 009 0. 012 0. 018 Insurance 0. 081 0. 071 0. 065 0. 064 0. 068 Depreciation 0. 124 0. 127 0. 164 0. 181 0. 188 0. 189 Finance Charges 0. 023 0. 024 0. 023 License and Registration 0. 003 0. 004 Total Vehicle Operating Cost 0. 327 0. 319 0. 372 0. 387 0. 426 0. 432 $3, 930 $3, 827 $4, 467 $4, 645 $5, 112 $5, 188 Mileage per year Annual Total Vehicle Operating Cost 15 Mid-size Car L City/Highway Condition $/ mile Compact Car
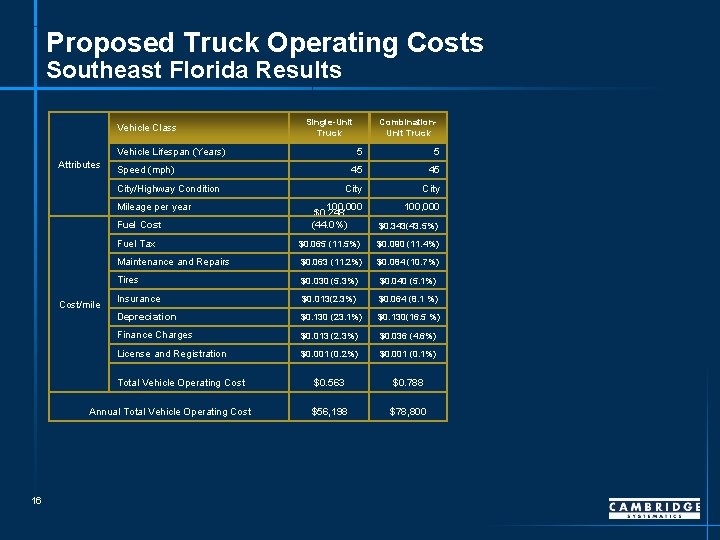
Proposed Truck Operating Costs Southeast Florida Results Vehicle Class Single-Unit Truck Vehicle Lifespan (Years) Attributes 5 5 45 45 City 100, 000 $0. 248 (44. 0%) 100, 000 $0. 343(43. 5%) Fuel Tax $0. 065 (11. 5%) $0. 090 (11. 4%) Maintenance and Repairs $0. 063 (11. 2%) $0. 084 (10. 7%) Tires $0. 030 (5. 3%) $0. 040 (5. 1%) Insurance $0. 013(2. 3%) $0. 064 (8. 1 %) Depreciation $0. 130 (23. 1%) $0. 130(16. 5 %) Finance Charges $0. 013 (2. 3%) $0. 036 (4. 6%) License and Registration $0. 001 (0. 2%) $0. 001 (0. 1%) $0. 563 $0. 788 $56, 198 $78, 800 Speed (mph) City/Highway Condition Mileage per year Fuel Cost/mile Total Vehicle Operating Cost Annual Total Vehicle Operating Cost 16 Combination. Unit Truck
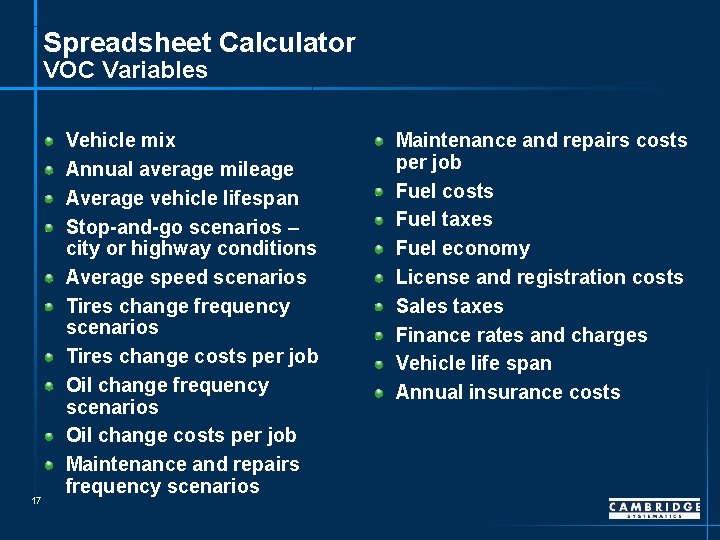
Spreadsheet Calculator VOC Variables 17 Vehicle mix Annual average mileage Average vehicle lifespan Stop-and-go scenarios – city or highway conditions Average speed scenarios Tires change frequency scenarios Tires change costs per job Oil change frequency scenarios Oil change costs per job Maintenance and repairs frequency scenarios Maintenance and repairs costs per job Fuel costs Fuel taxes Fuel economy License and registration costs Sales taxes Finance rates and charges Vehicle life span Annual insurance costs
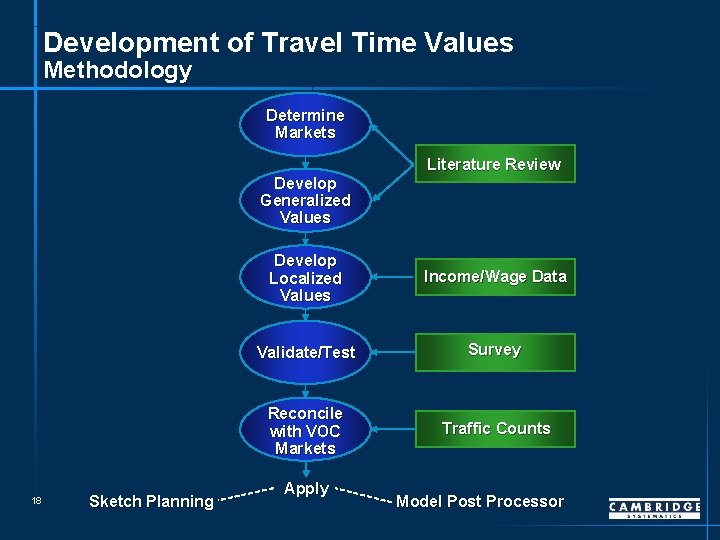
Development of Travel Time Values Methodology Determine Markets Develop Generalized Values 18 Sketch Planning Literature Review Develop Localized Values Income/Wage Data Validate/Test Survey Reconcile with VOC Markets Traffic Counts Apply Model Post Processor
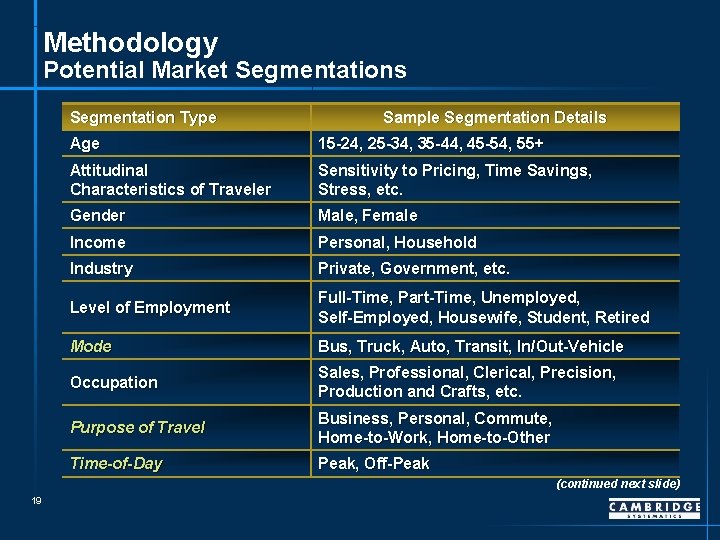
Methodology Potential Market Segmentations Segmentation Type Sample Segmentation Details Age 15 -24, 25 -34, 35 -44, 45 -54, 55+ Attitudinal Characteristics of Traveler Sensitivity to Pricing, Time Savings, Stress, etc. Gender Male, Female Income Personal, Household Industry Private, Government, etc. Level of Employment Full-Time, Part-Time, Unemployed, Self-Employed, Housewife, Student, Retired Mode Bus, Truck, Auto, Transit, In/Out-Vehicle Occupation Sales, Professional, Clerical, Precision, Production and Crafts, etc. Purpose of Travel Business, Personal, Commute, Home-to-Work, Home-to-Other Time-of-Day Peak, Off-Peak (continued next slide) 19
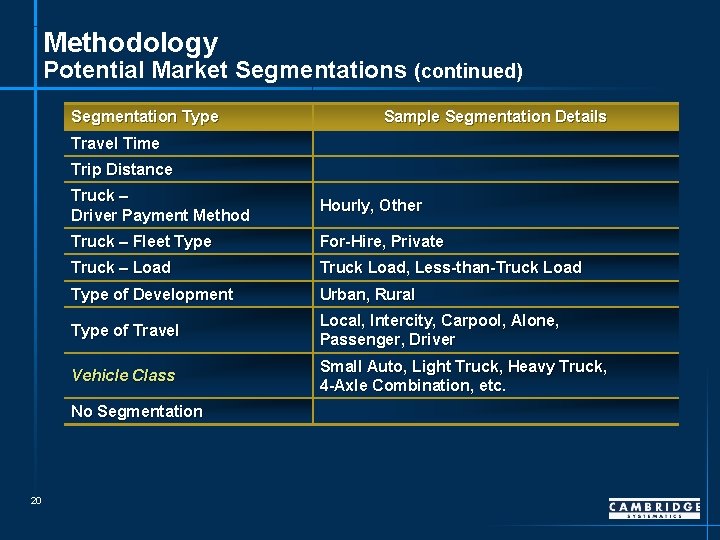
Methodology Potential Market Segmentations (continued) Segmentation Type Sample Segmentation Details Travel Time Trip Distance Truck – Driver Payment Method Hourly, Other Truck – Fleet Type For-Hire, Private Truck – Load Truck Load, Less-than-Truck Load Type of Development Urban, Rural Type of Travel Local, Intercity, Carpool, Alone, Passenger, Driver Vehicle Class Small Auto, Light Truck, Heavy Truck, 4 -Axle Combination, etc. No Segmentation 20
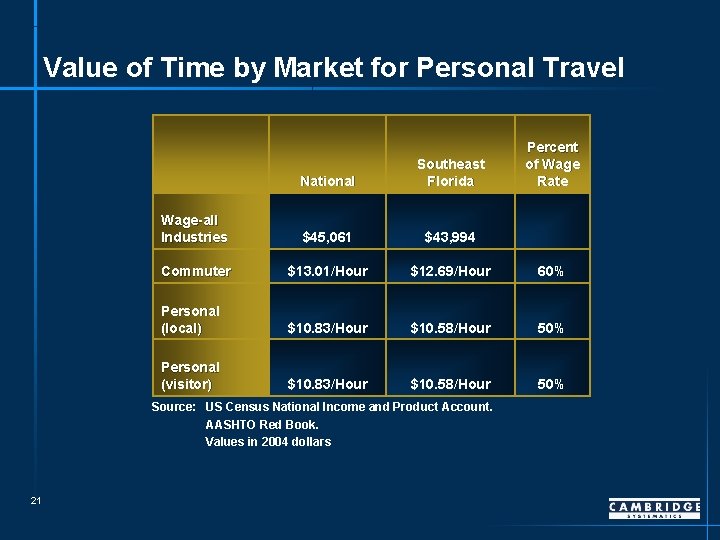
Value of Time by Market for Personal Travel National Southeast Florida Wage-all Industries $45, 061 $43, 994 Commuter $13. 01/Hour $12. 69/Hour 60% Personal (local) $10. 83/Hour $10. 58/Hour 50% Personal (visitor) $10. 83/Hour $10. 58/Hour 50% Source: US Census National Income and Product Account. AASHTO Red Book. Values in 2004 dollars 21 Percent of Wage Rate
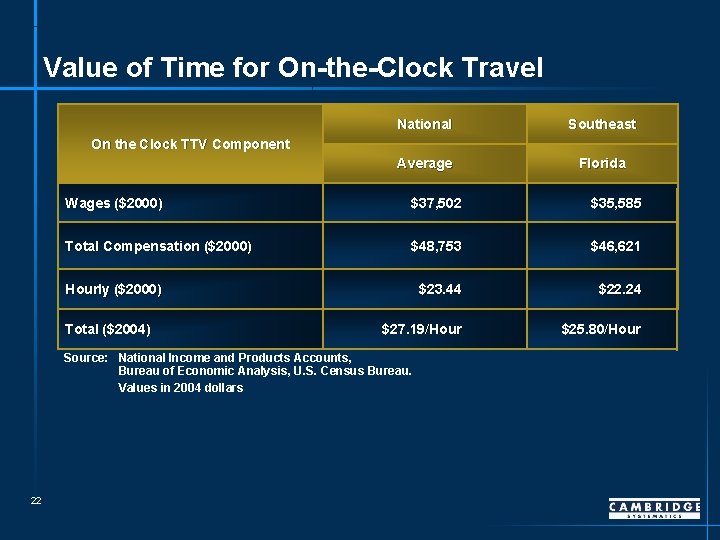
Value of Time for On-the-Clock Travel National Southeast Average Florida On the Clock TTV Component Wages ($2000) $37, 502 $35, 585 Total Compensation ($2000) $48, 753 $46, 621 $23. 44 $22. 24 $27. 19/Hour $25. 80/Hourly ($2000) Total ($2004) Source: National Income and Products Accounts, Bureau of Economic Analysis, U. S. Census Bureau. Values in 2004 dollars 22
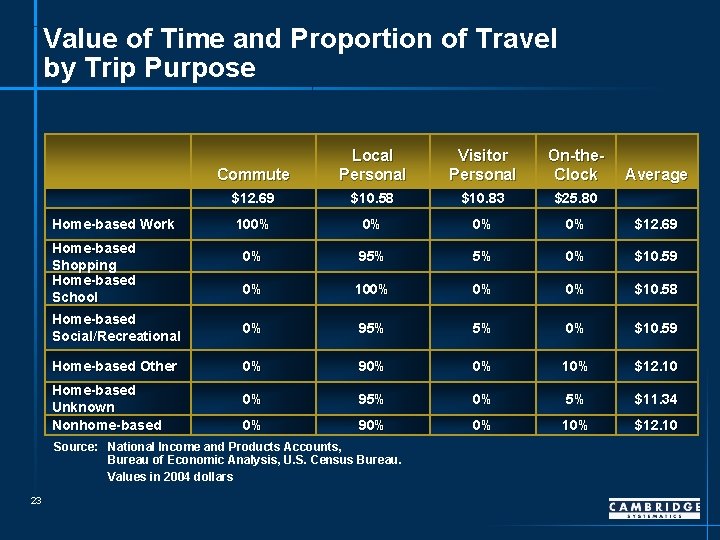
Value of Time and Proportion of Travel by Trip Purpose Commute Local Personal Visitor Personal On-the. Clock $12. 69 $10. 58 $10. 83 $25. 80 100% 0% $12. 69 0% 95% 5% 0% $10. 59 0% 100% 0% 0% $10. 58 Home-based Social/Recreational 0% 95% 5% 0% $10. 59 Home-based Other 0% 90% 0% 10% $12. 10 0% 95% 0% 5% $11. 34 0% 90% 0% 10% $12. 10 Home-based Work Home-based Shopping Home-based School Home-based Unknown Nonhome-based Source: National Income and Products Accounts, Bureau of Economic Analysis, U. S. Census Bureau. Values in 2004 dollars 23 Average
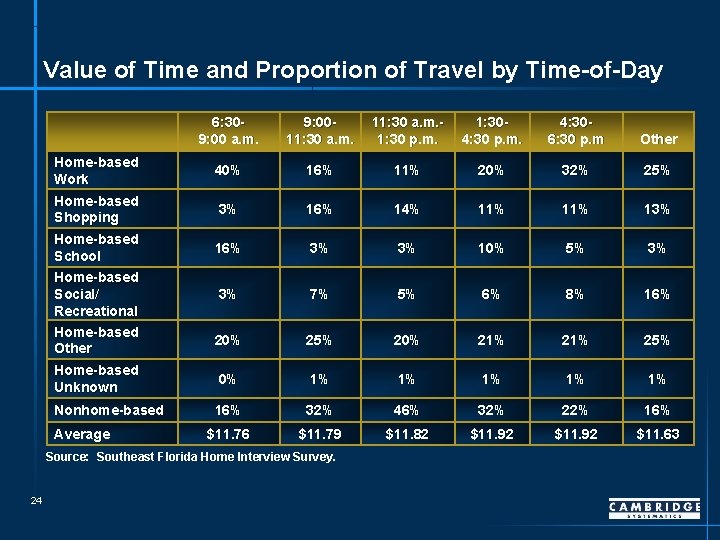
Value of Time and Proportion of Travel by Time-of-Day 6: 309: 00 a. m. 9: 0011: 30 a. m. 1: 30 p. m. 1: 304: 30 p. m. 4: 306: 30 p. m Other Home-based Work 40% 16% 11% 20% 32% 25% Home-based Shopping 3% 16% 14% 11% 13% 16% 3% 3% 10% 5% 3% 3% 7% 5% 6% 8% 16% 20% 25% 20% 21% 25% Home-based Unknown 0% 1% 1% 1% Nonhome-based 16% 32% 46% 32% 22% 16% $11. 76 $11. 79 $11. 82 $11. 92 $11. 63 Home-based School Home-based Social/ Recreational Home-based Other Average Source: Southeast Florida Home Interview Survey. 24
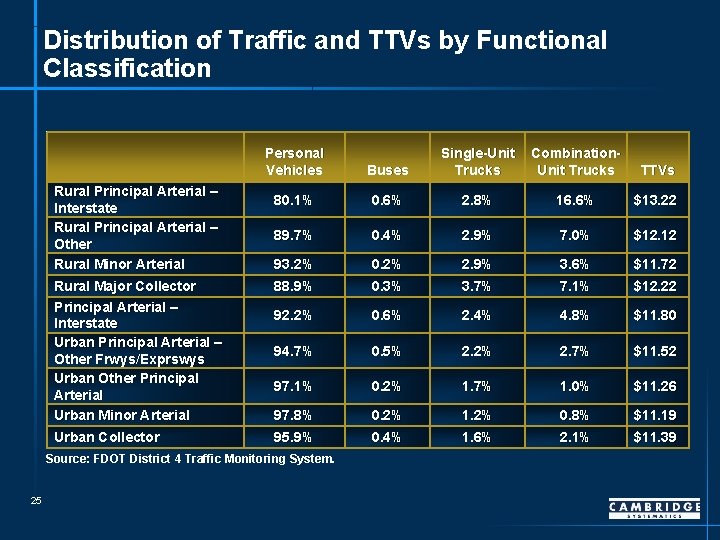
Distribution of Traffic and TTVs by Functional Classification Buses Single-Unit Trucks Combination. Unit Trucks TTVs 80. 1% 0. 6% 2. 8% 16. 6% $13. 22 89. 7% 0. 4% 2. 9% 7. 0% $12. 12 93. 2% 0. 2% 2. 9% 3. 6% $11. 72 Rural Major Collector Principal Arterial – Interstate Urban Principal Arterial – Other Frwys/Exprswys Urban Other Principal Arterial Urban Minor Arterial 88. 9% 0. 3% 3. 7% 7. 1% $12. 22 92. 2% 0. 6% 2. 4% 4. 8% $11. 80 94. 7% 0. 5% 2. 2% 2. 7% $11. 52 97. 1% 0. 2% 1. 7% 1. 0% $11. 26 97. 8% 0. 2% 1. 2% 0. 8% $11. 19 Urban Collector 95. 9% 0. 4% 1. 6% 2. 1% $11. 39 Rural Principal Arterial – Interstate Rural Principal Arterial – Other Rural Minor Arterial Personal Vehicles Source: FDOT District 4 Traffic Monitoring System. 25
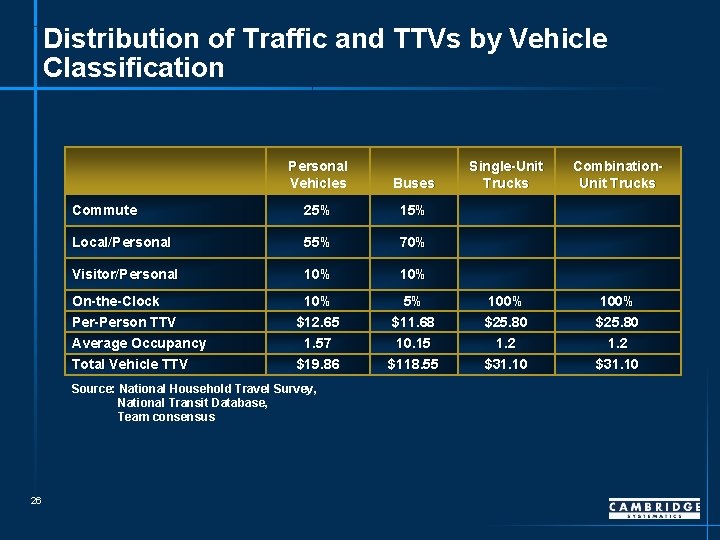
Distribution of Traffic and TTVs by Vehicle Classification Personal Vehicles Buses Commute 25% 15% Local/Personal 55% 70% Visitor/Personal 10% On-the-Clock Per-Person TTV 10% $12. 65 Average Occupancy Total Vehicle TTV 1. 57 $19. 86 Source: National Household Travel Survey, National Transit Database, Team consensus 26 Single-Unit Trucks Combination. Unit Trucks 5% $11. 68 100% $25. 80 10. 15 $118. 55 1. 2 $31. 10
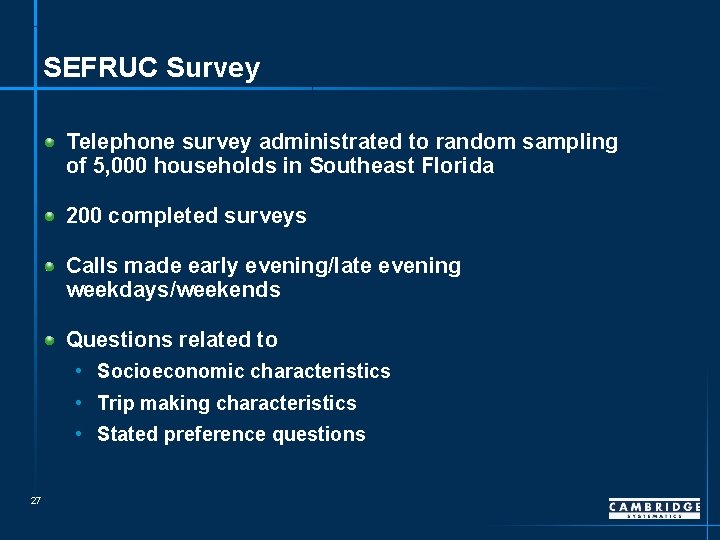
SEFRUC Survey Telephone survey administrated to random sampling of 5, 000 households in Southeast Florida 200 completed surveys Calls made early evening/late evening weekdays/weekends Questions related to • Socioeconomic characteristics • Trip making characteristics • Stated preference questions 27
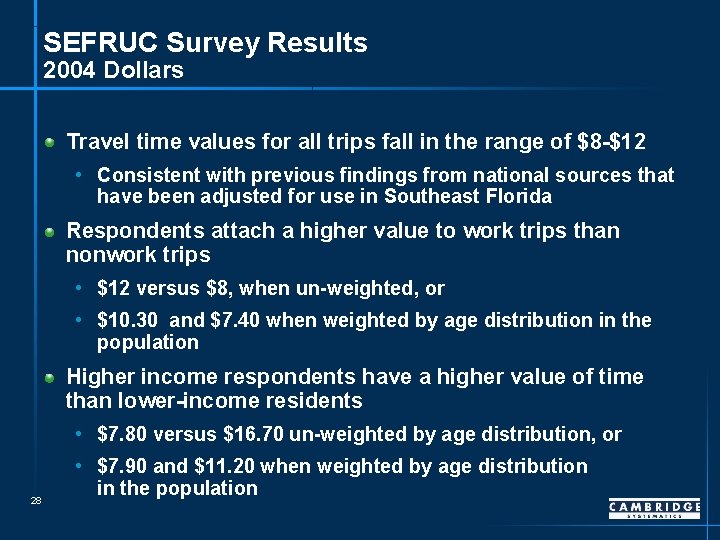
SEFRUC Survey Results 2004 Dollars Travel time values for all trips fall in the range of $8 -$12 • Consistent with previous findings from national sources that have been adjusted for use in Southeast Florida Respondents attach a higher value to work trips than nonwork trips • $12 versus $8, when un-weighted, or • $10. 30 and $7. 40 when weighted by age distribution in the population Higher income respondents have a higher value of time than lower-income residents • $7. 80 versus $16. 70 un-weighted by age distribution, or 28 • $7. 90 and $11. 20 when weighted by age distribution in the population
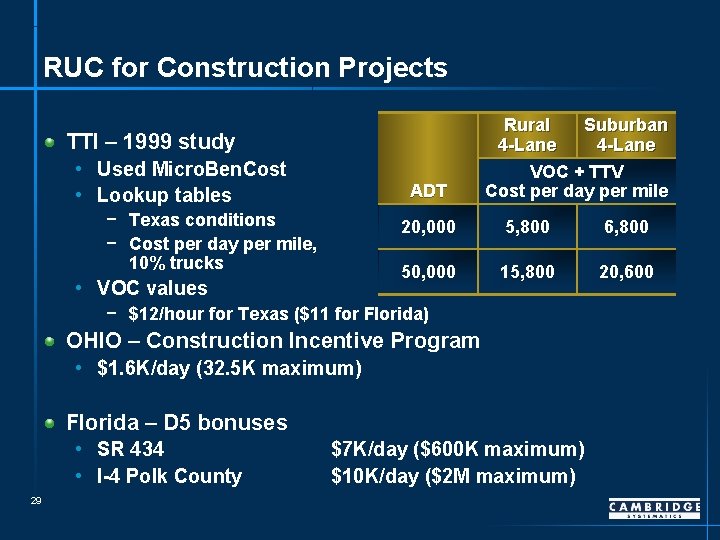
RUC for Construction Projects TTI – 1999 study • Used Micro. Ben. Cost • Lookup tables ADT − Texas conditions − Cost per day per mile, 10% trucks • VOC values Rural Suburban 4 -Lane VOC + TTV Cost per day per mile 20, 000 5, 800 6, 800 50, 000 15, 800 20, 600 − $12/hour for Texas ($11 for Florida) OHIO – Construction Incentive Program • $1. 6 K/day (32. 5 K maximum) Florida – D 5 bonuses • SR 434 • I-4 Polk County 29 $7 K/day ($600 K maximum) $10 K/day ($2 M maximum)