AHPs Supporting Unscheduled Care and Improving Patient Flow


- Slides: 22

AHPs Supporting Unscheduled Care and Improving Patient Flow Caroline Poole Deputy Clinical Director Allied Health Professions (AHPs) @caroline. Nhs caroline. poole 4@nhs. net

Visibility & Influence Contribution to QI activity

• Staying in hospital is bad for patients – acute or community it leads to deconditioning and harm and for many patients never returning to their homes after their hospital admission #Homefirst • 20 – 25 % admissions do not need to have come into hospital and 50% of bed days are not required for clinical reasons could be managed in a lower level of care preferably at home • 50% of people could have been discharged on lower level pathway • At least 50% of the reasons for not needing to be in hospital are in the direct control of the hospital • 350000 patients spend over three weeks in hospital each year 3 | Presentation title

Lots of ideas already published…. 4 | Presentation title

AHPs CAN support patient flow 15 case studies with evidenced impact 5 | Presentation title

6 | Presentation title

The collaborative: high demand - 44 trusts and their system partners completed the programme - Competing priorities and lack of AHP leadership were cited by some trusts as the reason why they could not participate at this time, despite their desire to do so - Collaborative delivery from NHS Improvement between Emergency Care Intensive Support Team and the AHP Team 7 | Presentation title

The collaborative structure Blended approach, 90 days rapid improvement cycle using Model for Improvement 8 | Presentation title

Reducing longer lengths of stay following emergency admission - Local opportunity - Not prescriptive 9 | Presentation title

Measurement: two key tools 10 | Presentation title

Capturing shift in team behaviours: bespoke tool 11 | Presentation title

Engagement Measures Twitter via #Home. First • “The energy & drive of everyone involved” • “Feeling empowered to make suggestions toward a larger collaborative goal” • “I was really quite blown away with the enthusiasm and innovation in the group – it’s really made me think about how we could develop a bit more passion and ‘blue sky thinking’ […] I think we’ve got so bogged down operationally over time we’ve forgotten how to get excited […] and the impact we can have! Thanks for the motivation” 12 |

The power of twitter 13 |

Improved Team Cohesion (Behaviour) • Project Teams were asked to reflect on the status of their team’s cohesion at each touch point • The team working assessment tool was created bespoke for this collaborative and is based on assessing the recognising behaviours demonstrated by high performing teams • This illustrates a significant shift towards positive team culture that we anticipate will provide longer term benefit for both sustainability and a wider effect for the organisations participating. 90 day tiv e ga 82% 84% 86% 88% Launch 30 day 90% Ne bi va le nt od Am Launch Go ng St ro e tiv ga Ne Am bi va le nt od ro Go 9 8 7 6 5 4 3 2 1 0 St 14 | Average % of trusts in cohorts 1 & 2 who completed and submitted homework after each event Team Assessment Launch - 90 Day Comparison: Average feedback about project teams (cohorts 1 & 2) ng Number of responses • The participating trusts submitted >84% of all ‘homework’ tasks on time, indicating a high level of engagement with the content. 60 - 90 day 92% 94%

Improvements Achieved (Results) IHI Assessment Scale Comparison Launch to 90 Days (Cohort 1) 5. 0 Outstanding sustainable results 4. 5 Sustainable improvement % of Trusts reporting improvements to varying degrees: 4. 0 Significant improvement 3. 5 Improvement 3. 0 Modest improvement Cohort 1: 19 out of the 27 trusts (70%) 2. 5 Changes tested, but no improvement 2. 0 Activity, but no changes Cohort 2: 10 out of the 17 trusts (59%) 1. 5 Planning for the project has begun 1. 0 Forming Team Other (0. 5) 0 2 Launch event 4 6 90 Day event 8 10 12 14 16 IHI Assessment Scale Comparison Launch to 90 Days (Cohort 2) 5. 0 Outstanding sustainable results 4. 5 Sustainable improvement 4. 0 Significant improvement 3. 5 Improvement 3. 0 Modest improvement 2. 5 Changes tested, but no improvement 2. 0 Activity, but no changes 1. 5 Planning for the project has begun 1. 0 Forming Team Other (0. 5) 0 1 Launch event 15 | 2 3 4 90 Day event 5 6 7 8 9 10

Long Length of Stay (Daily sit rep) 2. 21% decrease in LLOS (National) 9. 45% decrease in trusts in AHP collaborative * we have been unable to pull the objective data from Cohort 2 into this report to cover the same period of time yet. 16 |

Site Feedback “The best bit about this project is the way the team have just seen an opportunity and developed the model. The MDT approach of the team and the can do attitude has been great to witness. The results we are seeing are fantastic, but behind the numbers are our patients who are receiving more timely care, in the correct environment and being supported back home. We have extended the scheme until end of March by which time a business case will have been developed. I’m very proud of the team and what has been achieved in a very short time. ” Chief Operating Officer “It addresses the social issues that, previously we’ve simply not been set up to deal with” Consultant “Sometimes the easy way out is to admit; this has shown us a different way of thinking and working. ” Consultant 17 |

Delivering system and culture change, e. g. • Embed Homefirst culture • Increase number of patients discharged home rather than intermediate care • Increase number of patient discharged within 24 hours of being medically optimised • Implement radiographer-led discharge from emergency department • Identify nutrition and hydration risks in the emergency department • AHPs in handover from ambulance trust to support rapid discharge 18 |

Our learning • Time out as a team • Permission and authority to focus • Hidden and untapped talent • Energy and commitment • Making opportunities for your AHPs to demonstrate their leadership adds value • Short term collaboration energises and mobilises… 19 | Presentation title

20 | Presentation title

A call to action… • Can you describe the impact of your service in terms that your decision-makers recognise as important? • Can you clearly articulate the AHP contribution to your trust’s strategic priorities? • Who is your “go to” AHP lead; are you connected? 21 | Presentation title

Any questions? @caroline. Nhs 22 | Presentation title
 Patient registration workflow
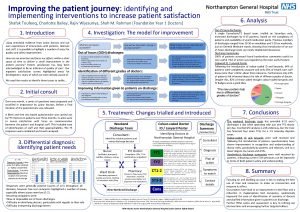
 Improving the patient journey
 Bronson intranet
 Improving chronic illness care model
 Levels of care primary secondary tertiary quaternary
 Patient 2 patient
 Primary nursing model
 Patient safety and quality care movement
 Dr moza
 Patient flow
 Patient flow
 Define modular nursing in management
 Qsen project examples
 What is progressive patient care
 Factors of care patients can expect
 Nursing diagnosis for vision impairment
 Nursing care plan for ocd patient
 Chapter 55 care of the patient with an immune disorder
 Chapter 53 care of the patient with a sensory disorder
 Care of critically ill surgical patient
 Phases of perioperative nursing
 Patient care ergonomics
 Patient centered primary care collaborative

