Aegean 2016 Full Service Carrier Focus on quality
- Slides: 16
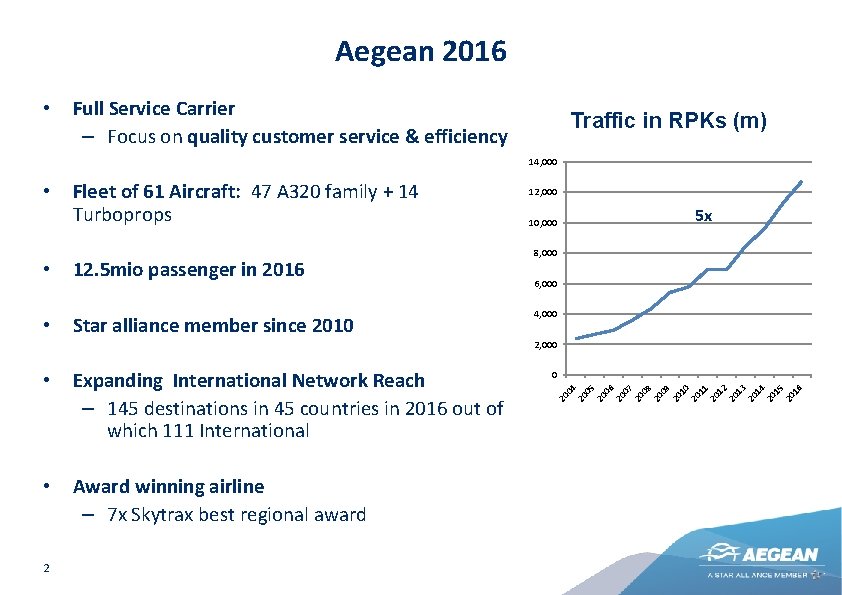
Aegean 2016 • Full Service Carrier – Focus on quality customer service & efficiency Traffic in RPKs (m) 14, 000 • Fleet of 61 Aircraft: 47 A 320 family + 14 Turboprops • 12. 5 mio passenger in 2016 • Star alliance member since 2010 12, 000 10, 000 5 x 8, 000 6, 000 4, 000 2, 000 Expanding International Network Reach – 145 destinations in 45 countries in 2016 out of which 111 International • Award winning airline – 7 x Skytrax best regional award 2 0 20 04 20 05 20 06 20 07 20 08 20 09 20 10 20 11 20 12 20 13 20 14 20 15 20 16 •
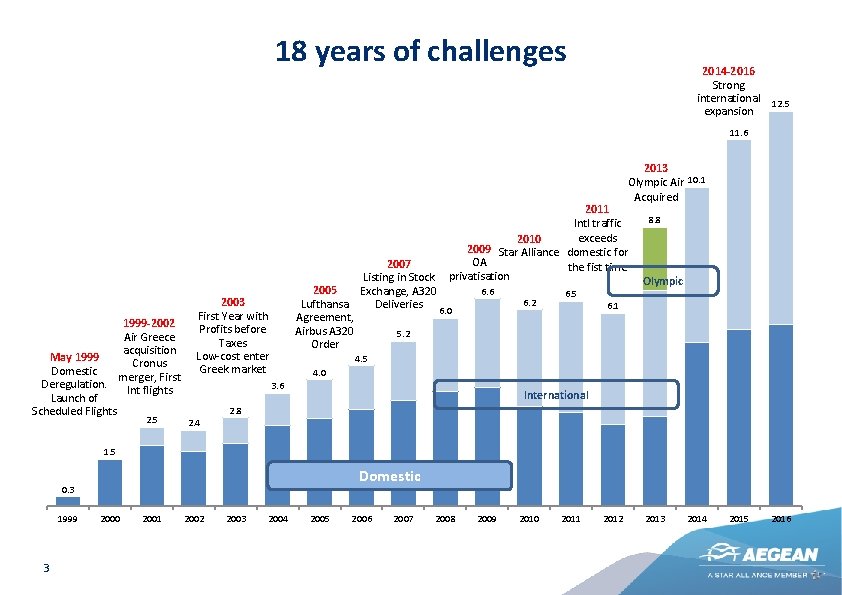
18 years of challenges 2014 -2016 Strong international 12. 5 expansion 11. 6 2013 Olympic Air 10. 1 Acquired 2011 Intl traffic exceeds 2010 2009 Star Alliance domestic for OA the fist time privatisation 1999 -2002 Air Greece acquisition May 1999 Cronus Domestic merger, First Deregulation. Int flights Launch of Scheduled Flights 2. 5 2007 Listing in Stock 2005 Exchange, A 320 Lufthansa Deliveries 6. 0 Agreement, Airbus A 320 5. 2 Order 2003 First Year with Profits before Taxes Low-cost enter Greek market 6. 6 6. 2 6. 5 8. 8 Olympic 6. 1 4. 5 4. 0 3. 6 International 2. 8 2. 4 1. 5 Domestic 0. 3 1999 3 2000 2001 2002 2003 2004 2005 2006 2007 2008 2009 2010 2011 2012 2013 2014 2015 2016
Aegean’s current challenges and objectives • Profitable, sustainable growth: – healthy balance sheet • Development in international markets • Focus on: – quality service to our customers: differentiation – cost efficiency/productivity: competitiveness 4
Aegean’s key levers • Continuous investment in our people, the asset that makes the difference: – skill development – training • Continuous investment in technology / process improvement for: – the customer – simplification of internal processes and the day-to-day job of our people 5
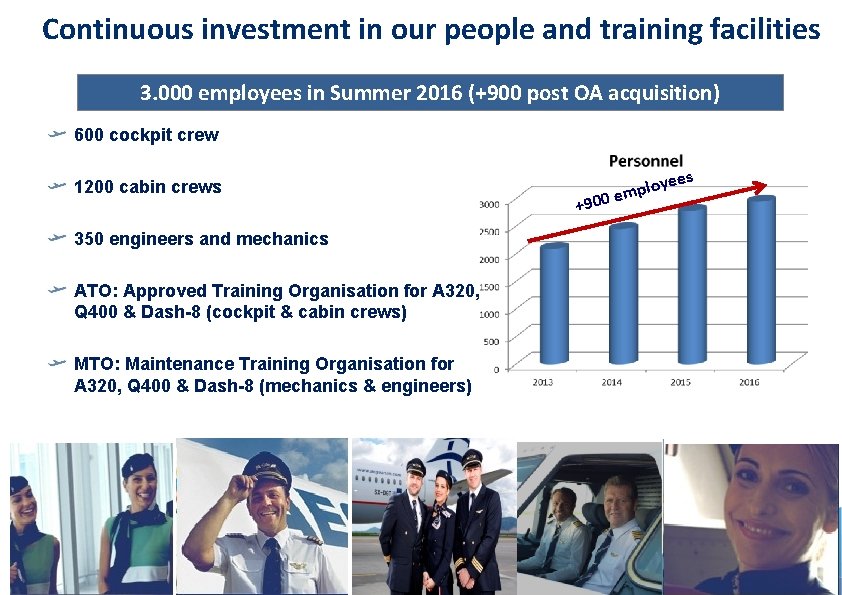
Continuous investment in our people and training facilities 3. 000 employees in Summer 2016 (+900 post OA acquisition) 600 cockpit crew 1200 cabin crews 350 engineers and mechanics ATO: Approved Training Organisation for A 320, Q 400 & Dash-8 (cockpit & cabin crews) MTO: Maintenance Training Organisation for A 320, Q 400 & Dash-8 (mechanics & engineers) 6 +900 yees o l p em
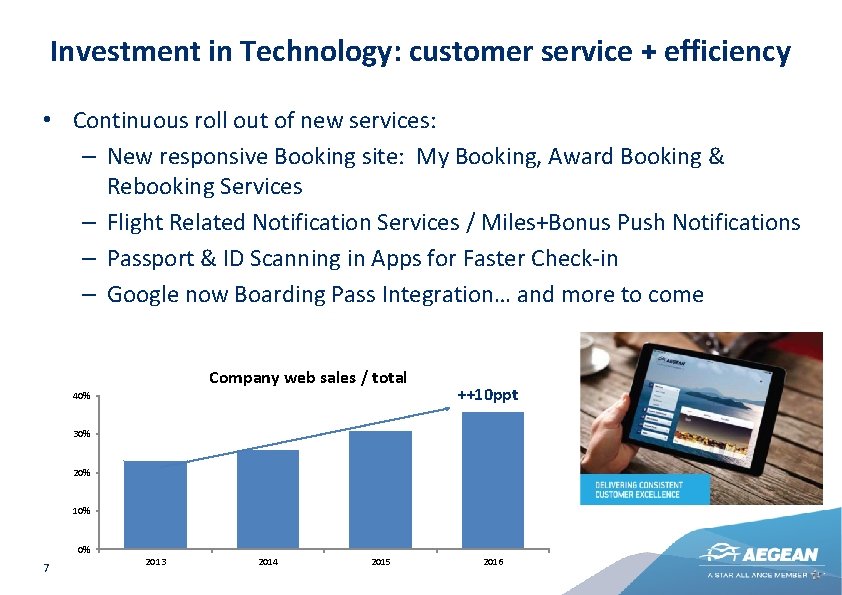
Investment in Technology: customer service + efficiency • Continuous roll out of new services: – New responsive Booking site: My Booking, Award Booking & Rebooking Services – Flight Related Notification Services / Miles+Bonus Push Notifications – Passport & ID Scanning in Apps for Faster Check-in – Google now Boarding Pass Integration… and more to come Company web sales / total 40% ++10 ppt 30% 20% 10% 0% 7 2013 2014 2015 2016
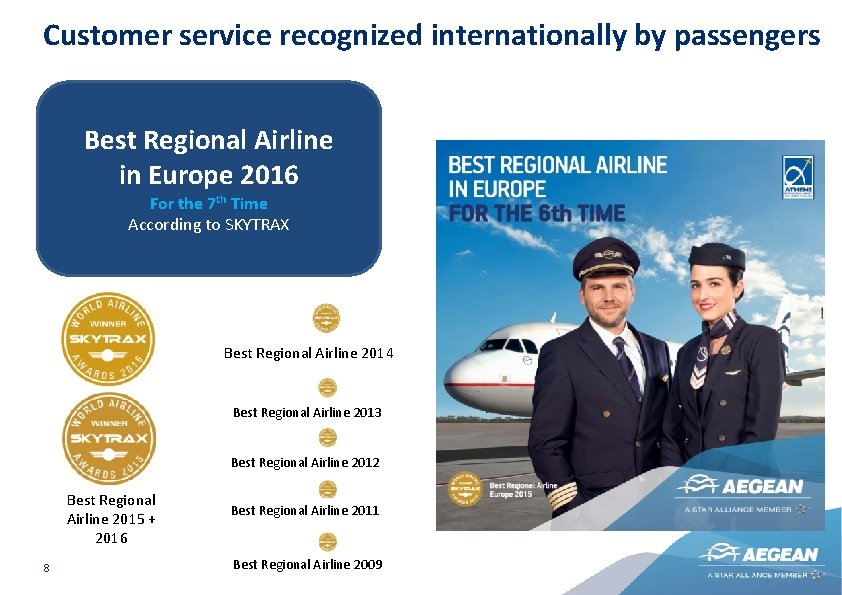
Customer service recognized internationally by passengers Best Regional Airline in Europe 2016 For the 7 th Time According to SKYTRAX Best Regional Airline 2014 Best Regional Airline 2013 Best Regional Airline 2012 Best Regional Airline 2015 + 2016 8 Best Regional Airline 2011 Best Regional Airline 2009
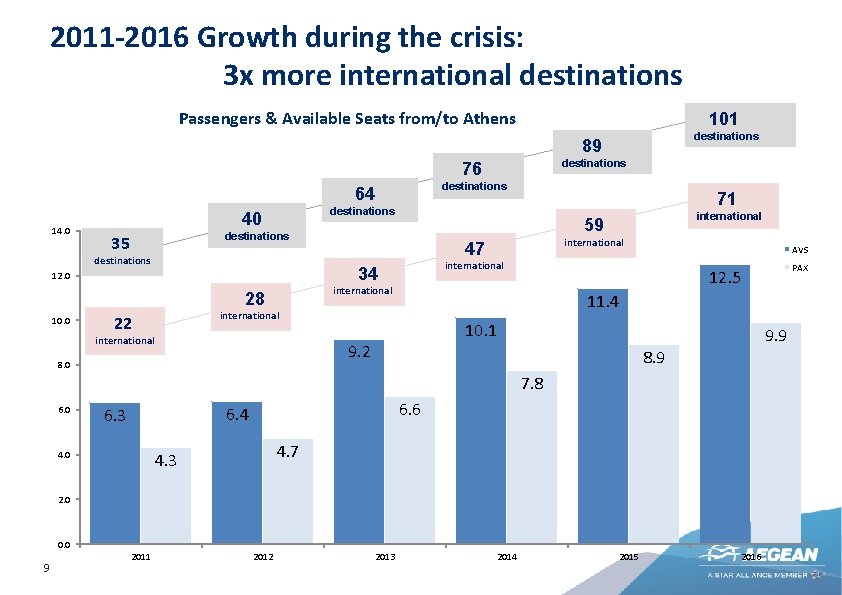
2011 -2016 Growth during the crisis: 3 x more international destinations Passengers & Available Seats from/to Athens 101 destinations 89 destinations 76 destinations 64 14. 0 40 destinations 22 10. 1 9. 2 8. 0 9. 9 8. 9 7. 8 6. 0 6. 6 6. 4 6. 3 4. 0 4. 7 4. 3 2. 0 0. 0 9 2011 2012 2013 PAX 12. 5 11. 4 international AVS international 28 10. 0 international 47 34 12. 0 international 59 destinations 35 71 destinations 2014 2015 2016
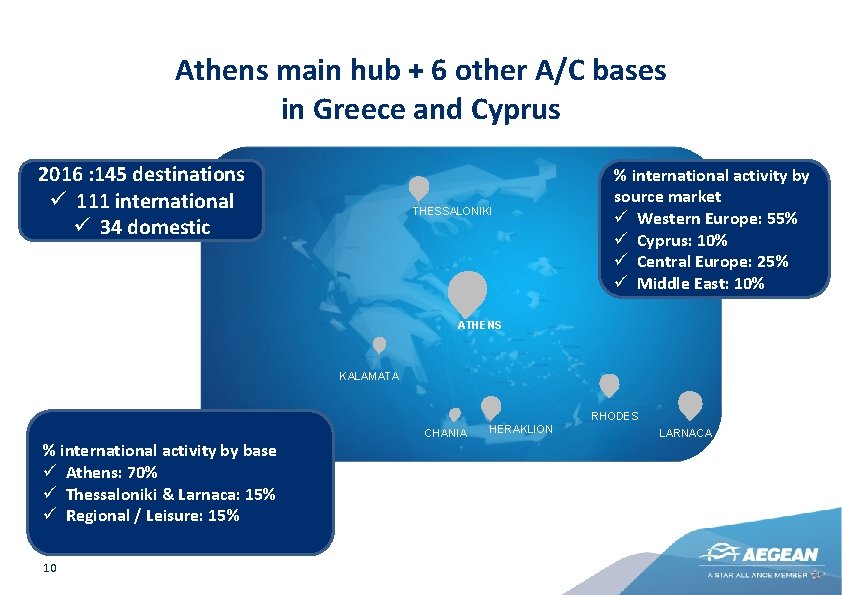
Athens main hub + 6 other A/C bases in Greece and Cyprus 2016 : 145 destinations ü 111 international ü 34 domestic THESSALONIKI % international activity by source market ü Western Europe: 55% ü Cyprus: 10% ü Central Europe: 25% ü Middle East: 10% ATHENS KALAMATA RHODES % international activity by base ü Athens: 70% ü Thessaloniki & Larnaca: 15% HERAKLION ü Regional / Leisure: 15% 10 CHANIA HERAKLION LARNACA
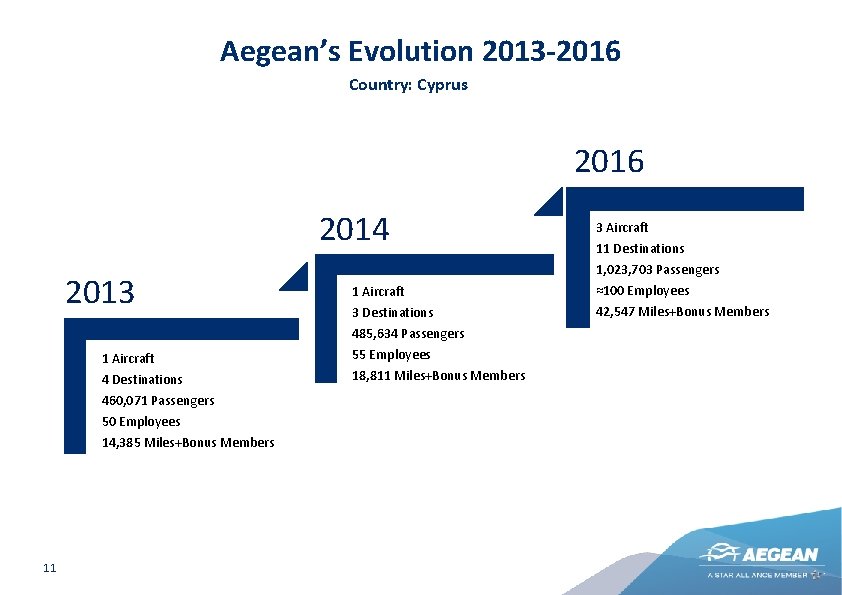
Aegean’s Evolution 2013 -2016 Country: Cyprus 2016 2014 2013 1 Aircraft 4 Destinations 460, 071 Passengers 50 Employees 14, 385 Miles+Bonus Members 11 1 Aircraft 3 Destinations 485, 634 Passengers 55 Employees 18, 811 Miles+Bonus Members 3 Aircraft 11 Destinations 1, 023, 703 Passengers ≈100 Employees 42, 547 Miles+Bonus Members
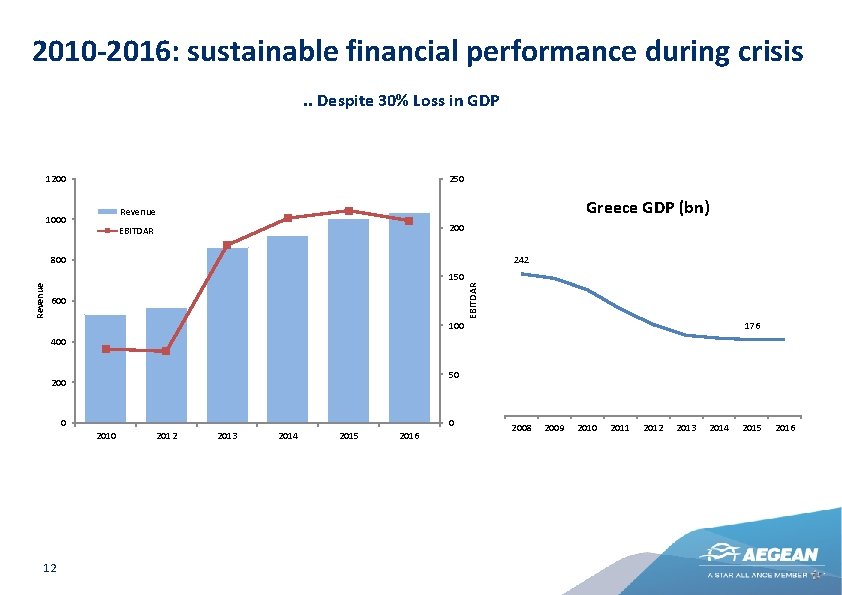
2010 -2016: sustainable financial performance during crisis. . Despite 30% Loss in GDP 1200 250 Greece GDP (bn) Revenue 1000 200 EBITDAR 242 800 EBITDAR Revenue 150 600 176 400 50 200 0 0 2010 12 2013 2014 2015 2016 2008 2009 2010 2011 2012 2013 2014 2015 2016
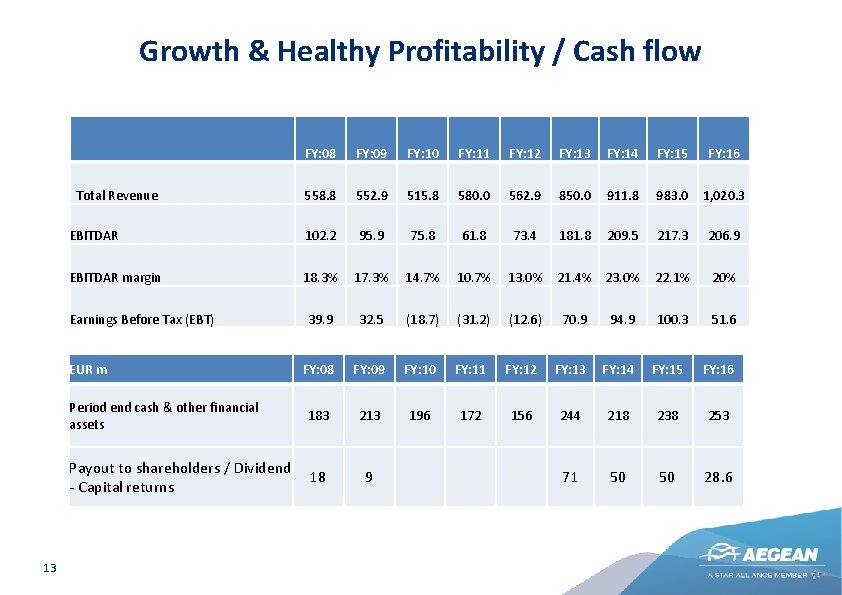
Growth & Healthy Profitability / Cash flow FY: 08 FY: 09 FY: 10 FY: 11 FY: 12 FY: 13 FY: 14 FY: 15 FY: 16 558. 8 552. 9 515. 8 580. 0 562. 9 850. 0 911. 8 983. 0 1, 020. 3 EBITDAR 102. 2 95. 9 75. 8 61. 8 73. 4 181. 8 209. 5 217. 3 206. 9 EBITDAR margin 18. 3% 17. 3% 14. 7% 10. 7% 13. 0% 21. 4% 23. 0% 22. 1% 20% 39. 9 32. 5 (18. 7) (31. 2) (12. 6) 100. 3 51. 6 FY: 08 FY: 09 FY: 10 FY: 11 Period end cash & other financial assets 183 213 196 172 Payout to shareholders / Dividend - Capital returns 18 9 Total Revenue Earnings Before Tax (EBT) EUR m 13 70. 9 94. 9 FY: 12 FY: 13 FY: 14 FY: 15 FY: 16 156 244 218 238 253 71 50 50 28. 6
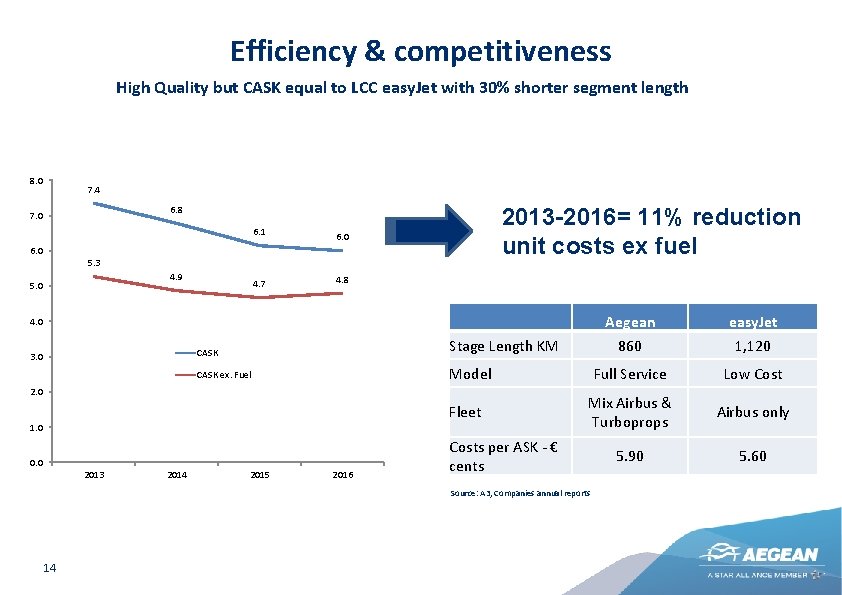
Efficiency & competitiveness High Quality but CASK equal to LCC easy. Jet with 30% shorter segment length 8. 0 7. 4 2013 -2016= 11% reduction unit costs ex fuel 6. 8 7. 0 6. 1 6. 0 5. 3 4. 9 5. 0 4. 7 4. 8 Aegean 860 easy. Jet 1, 120 Full Service Low Cost Mix Airbus & Turboprops Airbus only 5. 90 5. 60 4. 0 3. 0 CASK Stage Length KM CASK ex. Fuel Model 2. 0 Fleet 1. 0 0. 0 2013 2014 2015 2016 Costs per ASK - € cents Source: A 3, Companies annual reports 14
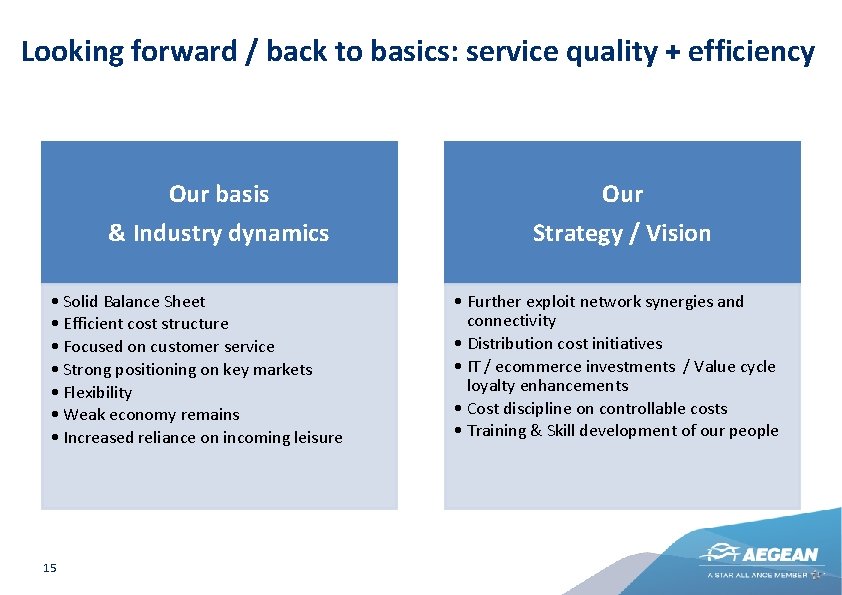
Looking forward / back to basics: service quality + efficiency Our basis & Industry dynamics • Solid Balance Sheet • Efficient cost structure • Focused on customer service • Strong positioning on key markets • Flexibility • Weak economy remains • Increased reliance on incoming leisure 15 Our Strategy / Vision • Further exploit network synergies and connectivity • Distribution cost initiatives • IT / ecommerce investments / Value cycle loyalty enhancements • Cost discipline on controllable costs • Training & Skill development of our people
THANK YOU 16