3 D Modeling in SUGAR 1 1 Jason



- Slides: 37
3 -D Modeling in SUGAR 1. 1 Jason Vaughn Clark, Ningning Zhou, Kris Pister, Jim Demmel University of California at Berkeley March 14 -15, 2000
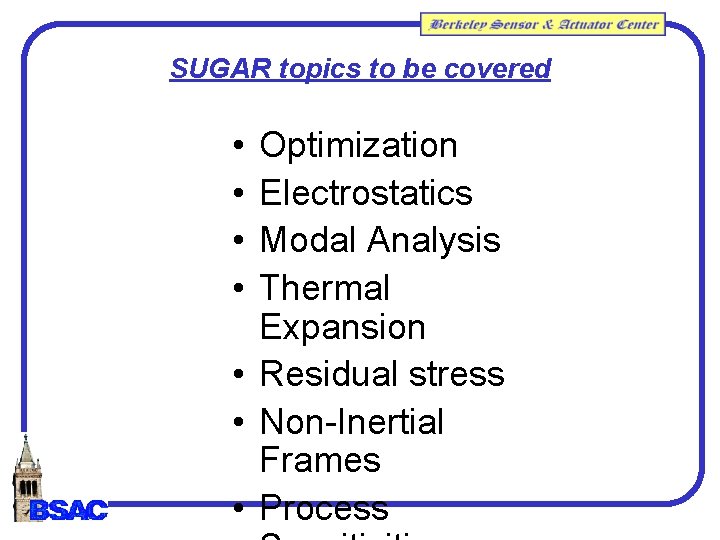
SUGAR topics to be covered • • Optimization Electrostatics Modal Analysis Thermal Expansion • Residual stress • Non-Inertial Frames • Process
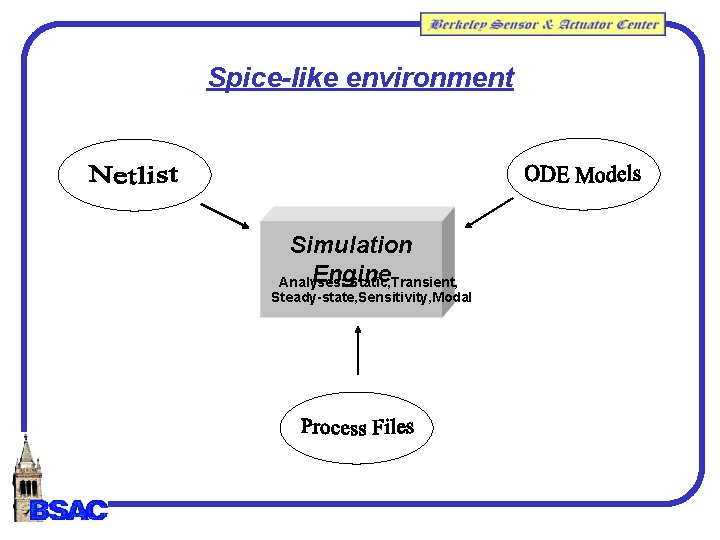
Spice-like environment Simulation Engine Analyses: Static, Transient, Steady-state, Sensitivity, Modal
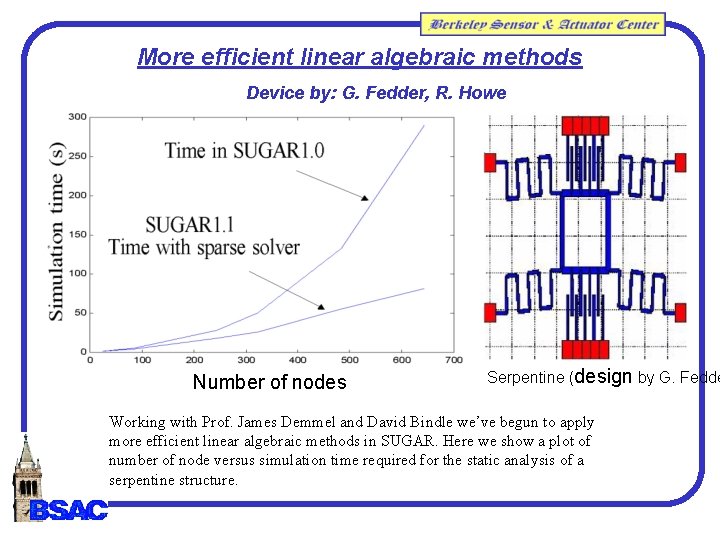
Optimization Sparse solvers and other efficient algorithms from a collaboration with David Bindle, and Prof. Jim Demmel.
More efficient linear algebraic methods Device by: G. Fedder, R. Howe Number of nodes Serpentine (design by G. Fedde Working with Prof. James Demmel and David Bindle we’ve begun to apply more efficient linear algebraic methods in SUGAR. Here we show a plot of number of node versus simulation time required for the static analysis of a serpentine structure.
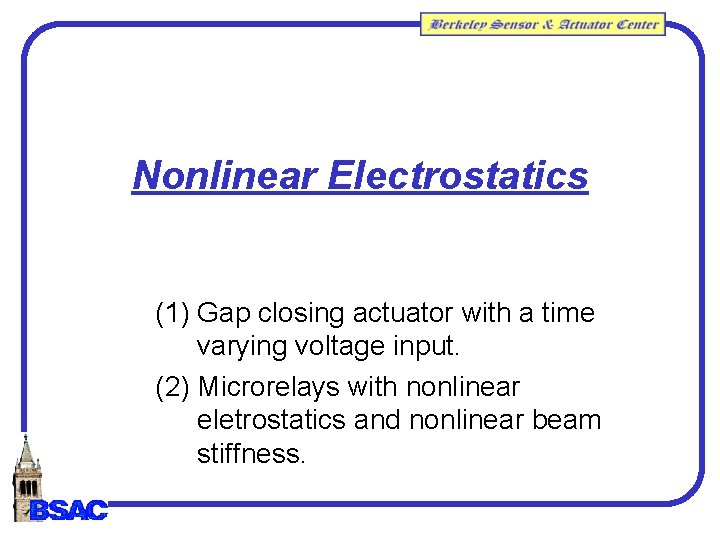
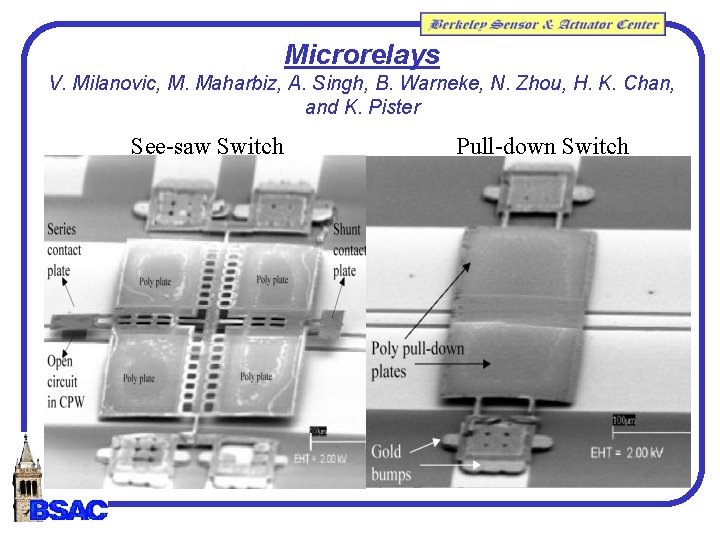
Nonlinear Electrostatics (1) Gap closing actuator with a time varying voltage input. (2) Microrelays with nonlinear eletrostatics and nonlinear beam stiffness.
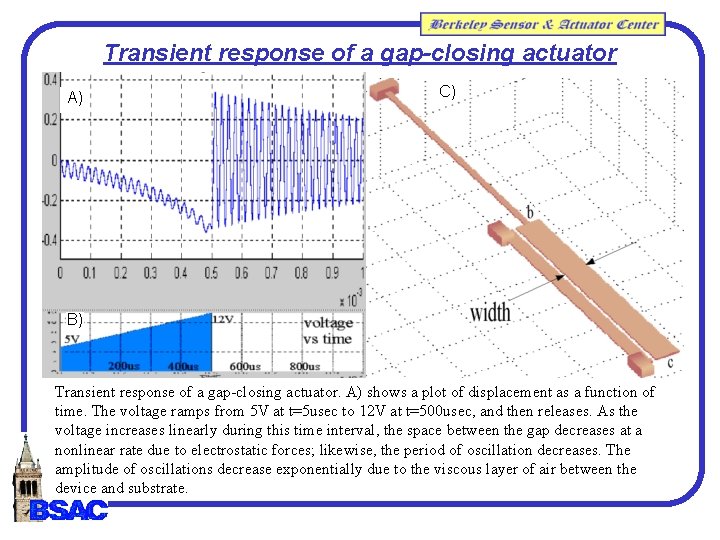
Transient response of a gap-closing actuator A) C) B) Transient response of a gap-closing actuator. A) shows a plot of displacement as a function of time. The voltage ramps from 5 V at t=5 usec to 12 V at t=500 usec, and then releases. As the voltage increases linearly during this time interval, the space between the gap decreases at a nonlinear rate due to electrostatic forces; likewise, the period of oscillation decreases. The amplitude of oscillations decrease exponentially due to the viscous layer of air between the device and substrate.
Microrelays V. Milanovic, M. Maharbiz, A. Singh, B. Warneke, N. Zhou, H. K. Chan, and K. Pister See-saw Switch Pull-down Switch
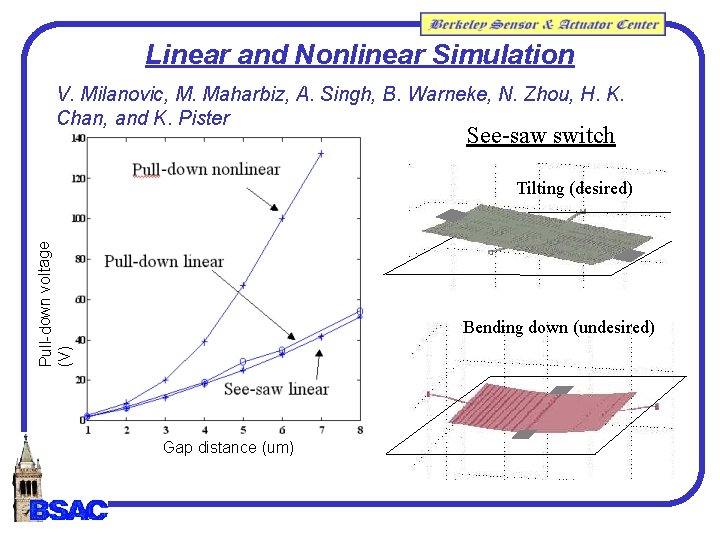
Linear and Nonlinear Simulation V. Milanovic, M. Maharbiz, A. Singh, B. Warneke, N. Zhou, H. K. Chan, and K. Pister See-saw switch Pull-down voltage (V) Tilting (desired) Bending down (undesired) Gap distance (um)
Circuits: Induced Currents Multimode resonator.
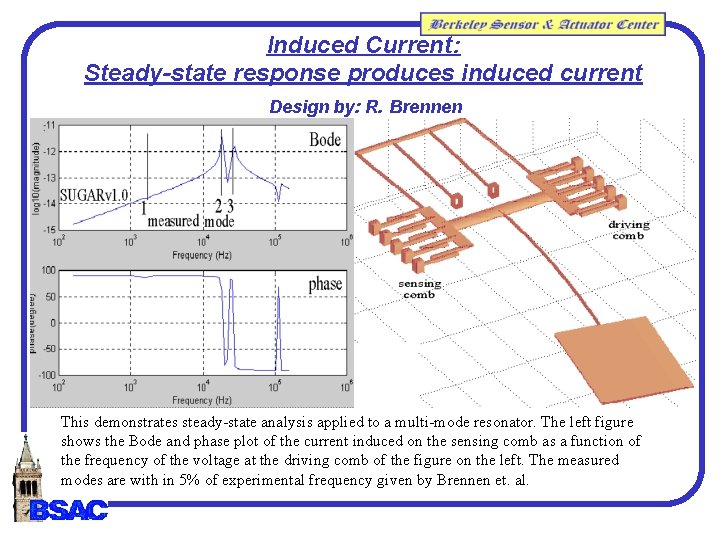
Induced Current: Steady-state response produces induced current Design by: R. Brennen This demonstrates steady-state analysis applied to a multi-mode resonator. The left figure shows the Bode and phase plot of the current induced on the sensing comb as a function of the frequency of the voltage at the driving comb of the figure on the left. The measured modes are with in 5% of experimental frequency given by Brennen et. al.
3 D Modal Analysis Accelerometer. Micromirror. Gyro.
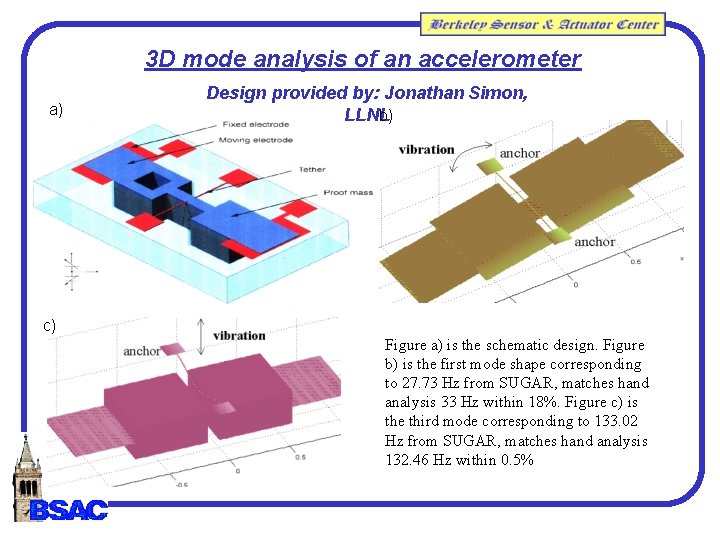
3 D mode analysis of an accelerometer a) Design provided by: Jonathan Simon, LLNL b) c) Figure a) is the schematic design. Figure b) is the first mode shape corresponding to 27. 73 Hz from SUGAR, matches hand analysis 33 Hz within 18%. Figure c) is the third mode corresponding to 133. 02 Hz from SUGAR, matches hand analysis 132. 46 Hz within 0. 5%
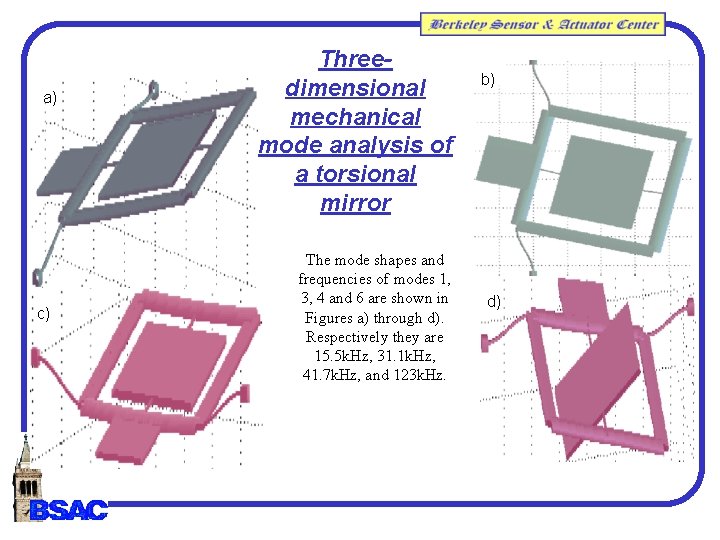
a) c) Threedimensional mechanical mode analysis of a torsional mirror The mode shapes and frequencies of modes 1, 3, 4 and 6 are shown in Figures a) through d). Respectively they are 15. 5 k. Hz, 31. 1 k. Hz, 41. 7 k. Hz, and 123 k. Hz. b) d)
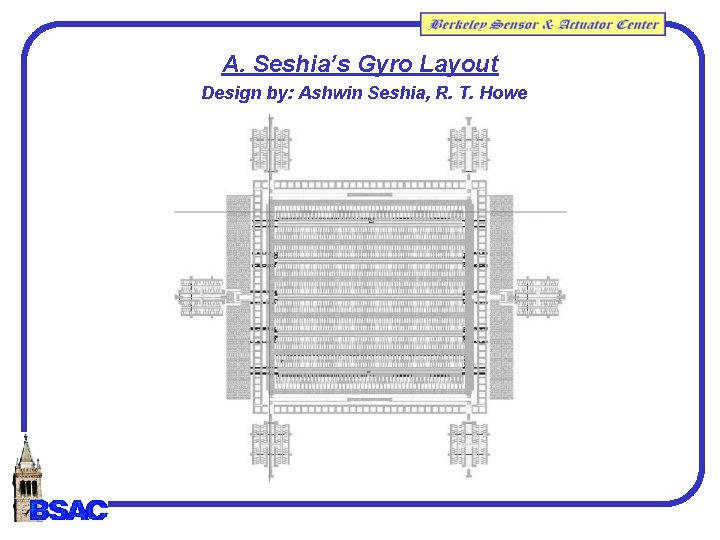
A. Seshia’s Gyro Layout Design by: Ashwin Seshia, R. T. Howe
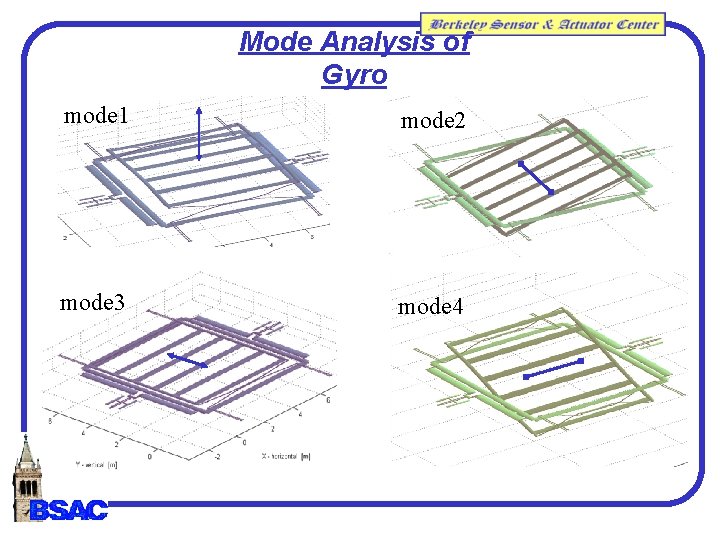
Mode Analysis of Gyro mode 1 mode 2 mode 3 mode 4
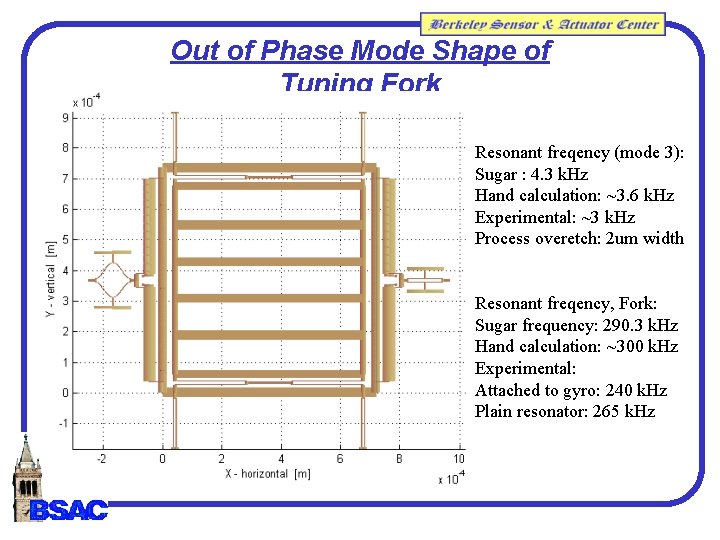
Out of Phase Mode Shape of Tuning Fork Resonant freqency (mode 3): Sugar : 4. 3 k. Hz Hand calculation: ~3. 6 k. Hz Experimental: ~3 k. Hz Process overetch: 2 um width Resonant freqency, Fork: Sugar frequency: 290. 3 k. Hz Hand calculation: ~300 k. Hz Experimental: Attached to gyro: 240 k. Hz Plain resonator: 265 k. Hz
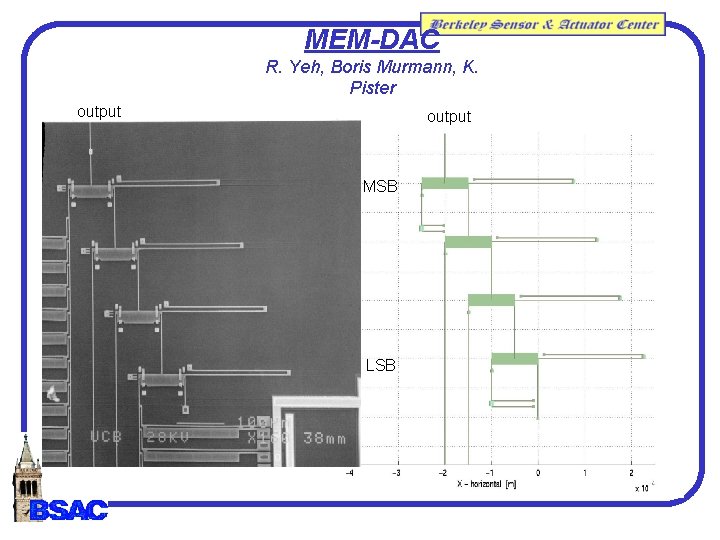
Thermal expansion Heatuator. Digital to Analog Converter.
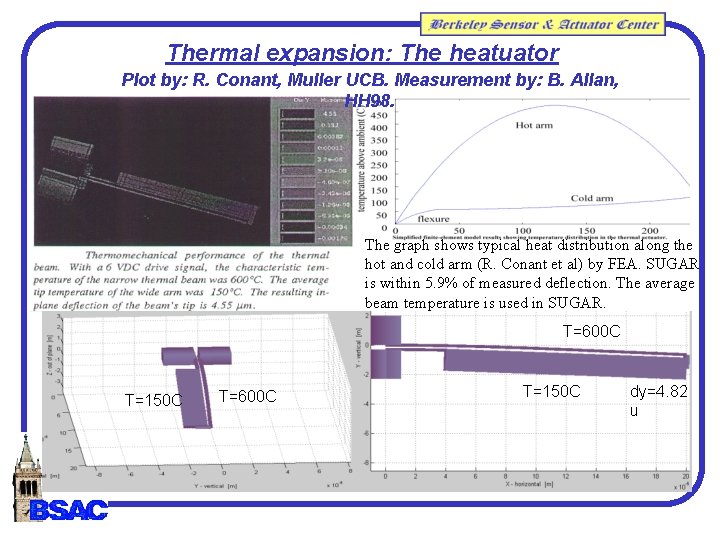
Thermal expansion: The heatuator Plot by: R. Conant, Muller UCB. Measurement by: B. Allan, HH 98. The graph shows typical heat distribution along the hot and cold arm (R. Conant et al) by FEA. SUGAR is within 5. 9% of measured deflection. The average beam temperature is used in SUGAR. T=600 C T=150 C dy=4. 82 u
MEM-DAC R. Yeh, Boris Murmann, K. Pister output MSB LSB
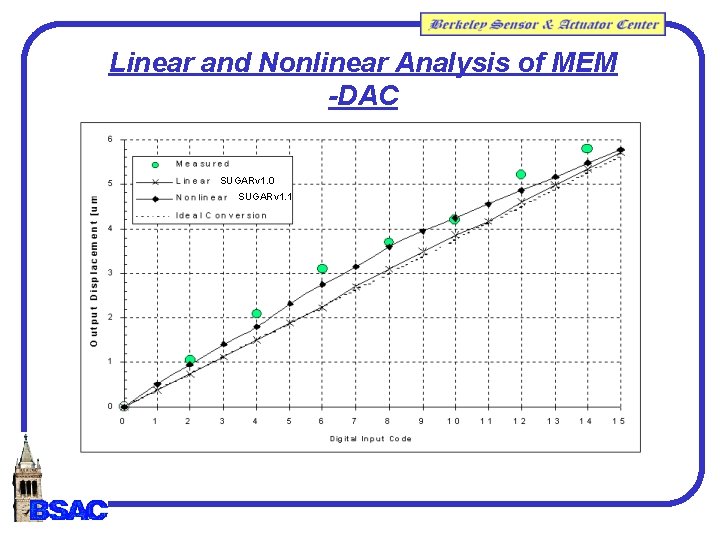
Linear and Nonlinear Analysis of MEM -DAC SUGARv 1. 0 SUGARv 1. 1
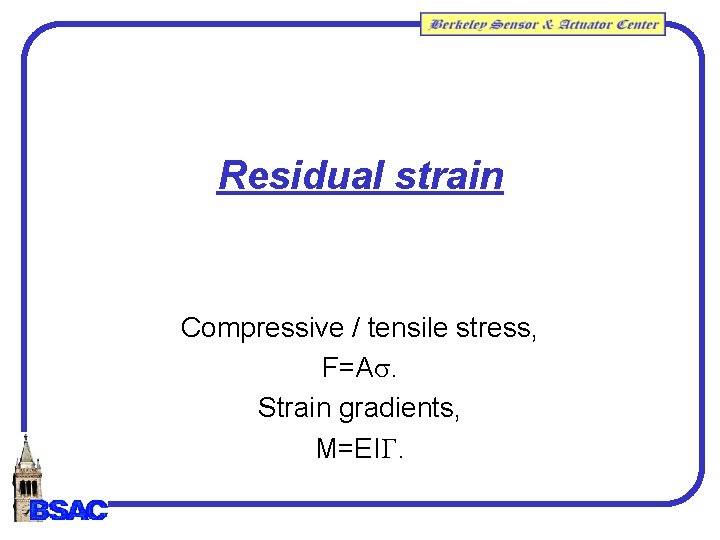
Residual strain Compressive / tensile stress, F=As. Strain gradients, M=EIG.
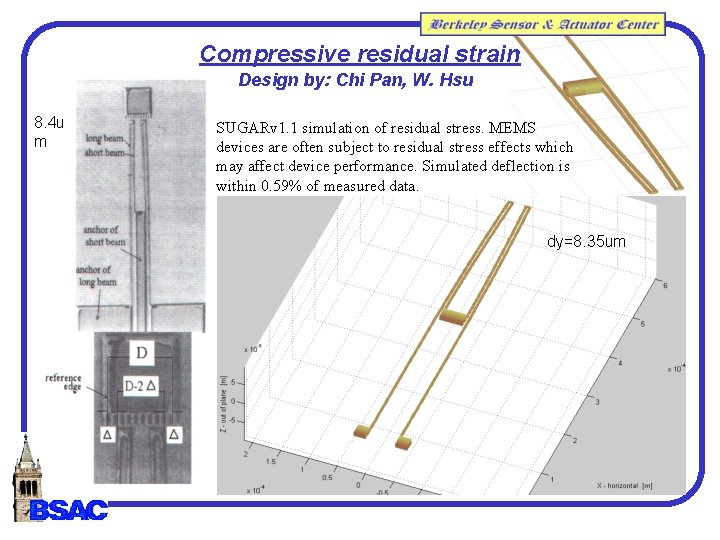
Compressive residual strain Design by: Chi Pan, W. Hsu 8. 4 u m SUGARv 1. 1 simulation of residual stress. MEMS devices are often subject to residual stress effects which may affect device performance. Simulated deflection is within 0. 59% of measured data. dy=8. 35 um
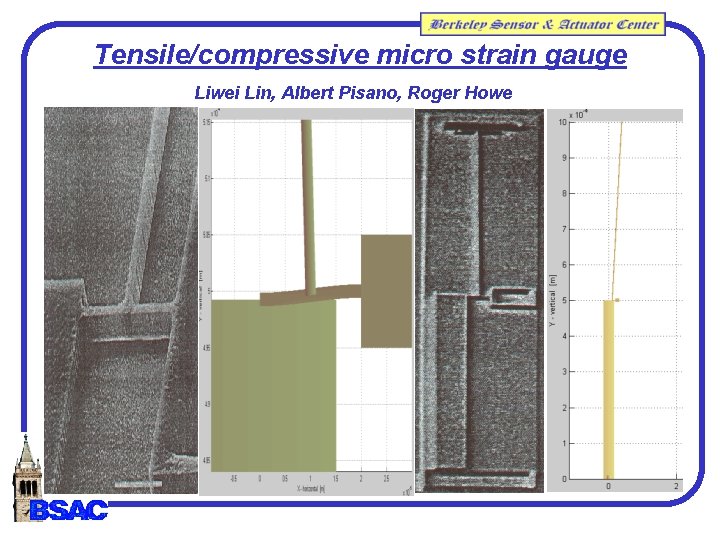
Tensile/compressive micro strain gauge Liwei Lin, Albert Pisano, Roger Howe
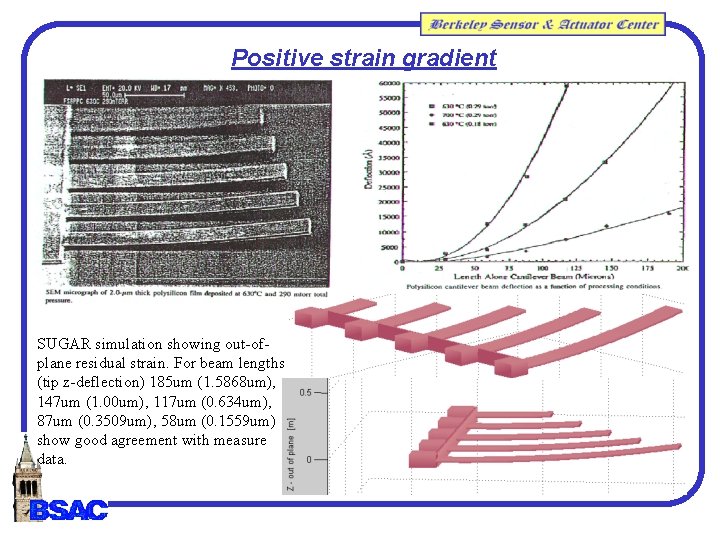
Positive strain gradient SUGAR simulation showing out-ofplane residual strain. For beam lengths (tip z-deflection) 185 um (1. 5868 um), 147 um (1. 00 um), 117 um (0. 634 um), 87 um (0. 3509 um), 58 um (0. 1559 um) show good agreement with measure data.
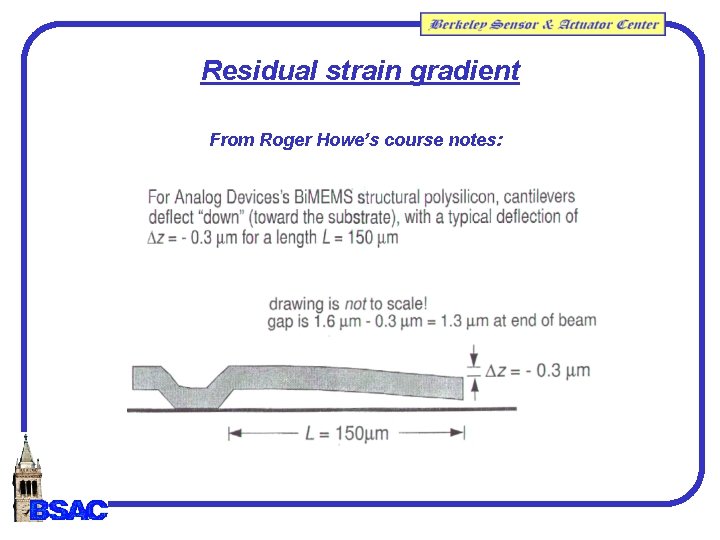
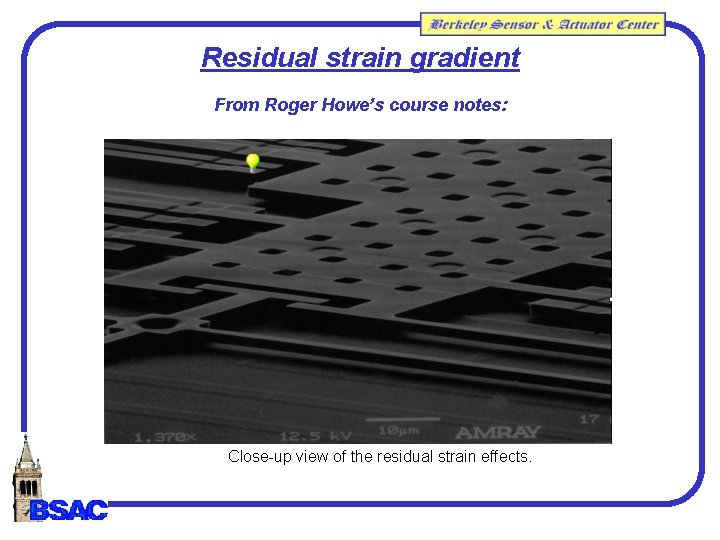
Residual strain gradient From Roger Howe’s course notes:
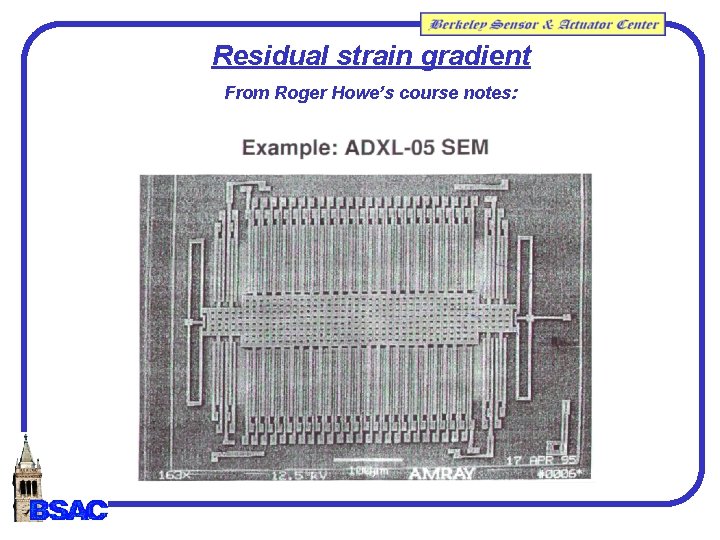
Residual strain gradient From Roger Howe’s course notes:
Residual strain gradient From Roger Howe’s course notes: Close-up view of the residual strain effects.
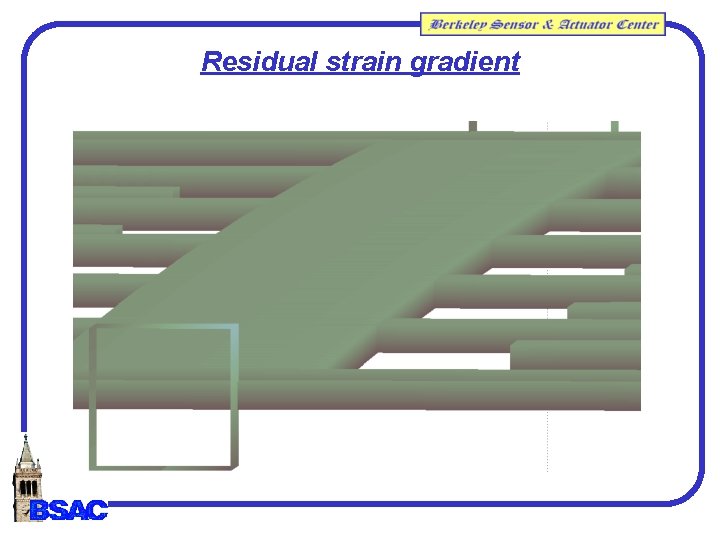
Residual strain gradient
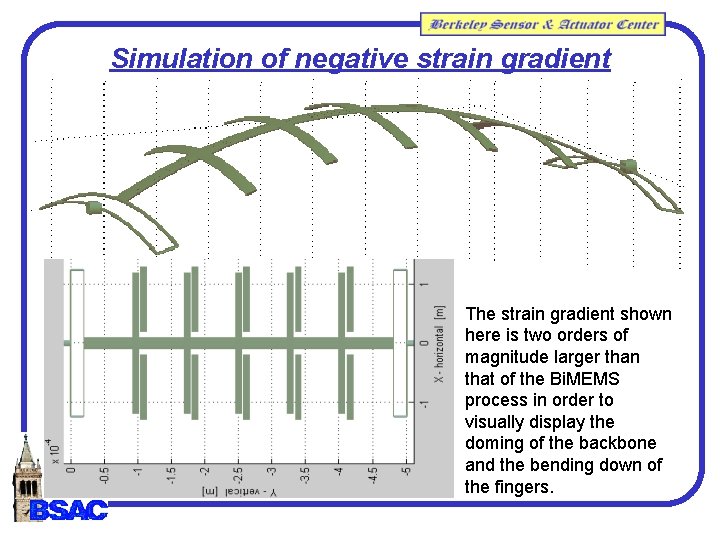
Simulation of negative strain gradient The strain gradient shown here is two orders of magnitude larger than that of the Bi. MEMS process in order to visually display the doming of the backbone and the bending down of the fingers.
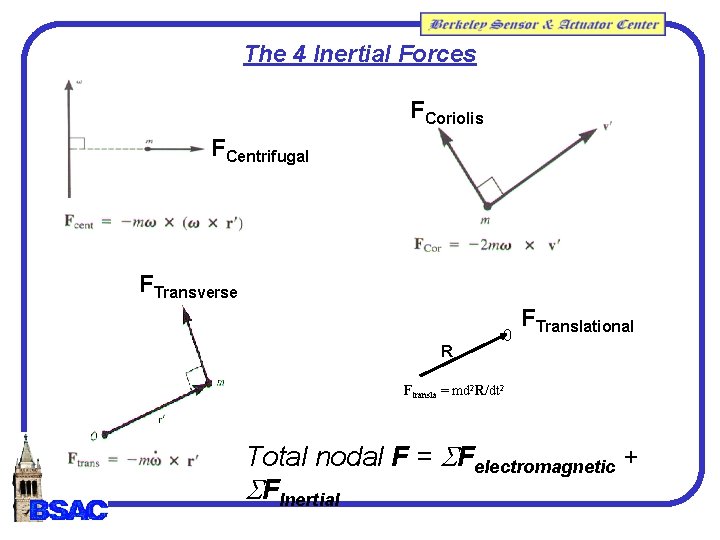
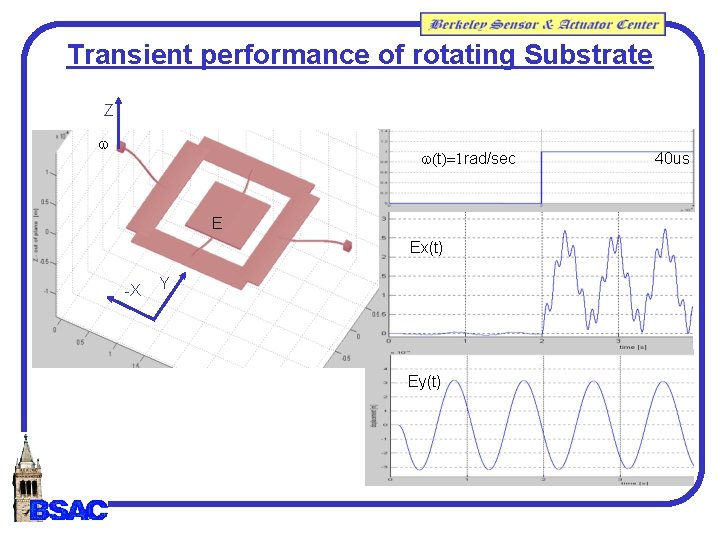
Accelerating Frames All inertial forces are incorporated. Rotating substrate example.
The 4 Inertial Forces FCoriolis FCentrifugal FTransverse R 0 FTranslational Ftransla = md 2 R/dt 2 Total nodal F = SFelectromagnetic + SFInertial
Transient performance of rotating Substrate Z w w(t)=1 rad/sec E Ex(t) -X Y Ey(t) 40 us
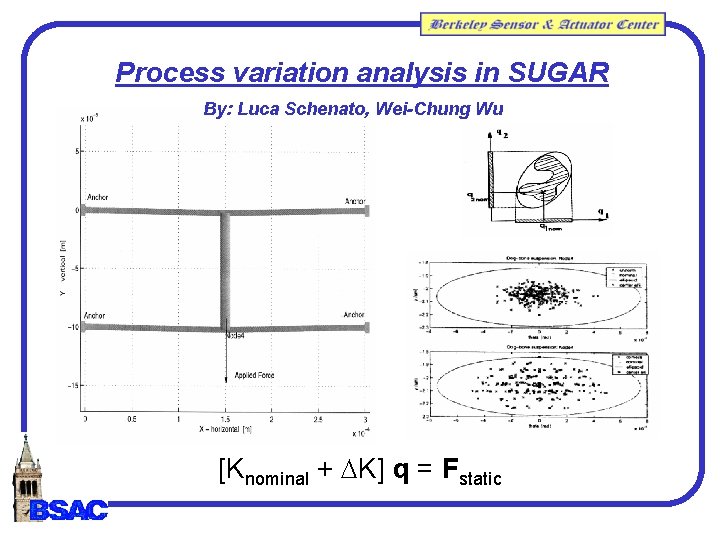
Process sensitivities Process variations by Luca Schenato, Wei. Chung Wu Monte Carlo: performance possibilities, Ellipsoidal Calculus: worst case scenarios.
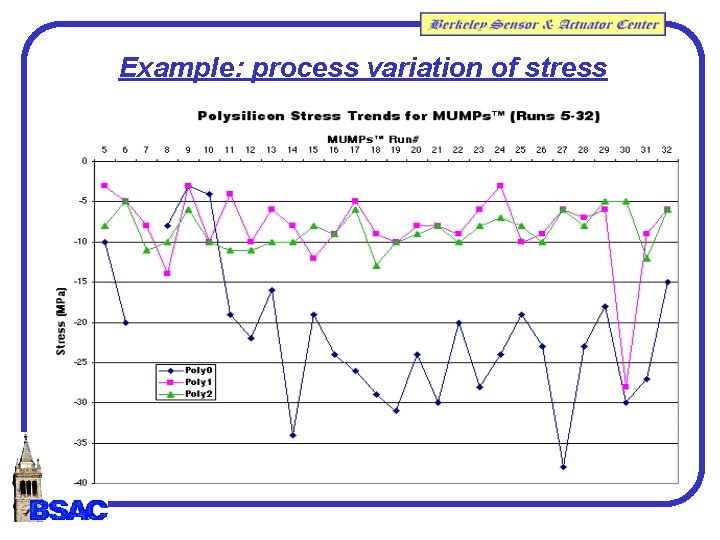
Example: process variation of stress
Process variation analysis in SUGAR By: Luca Schenato, Wei-Chung Wu [Knominal + DK] q = Fstatic
Conclusion • Free on the web • Transient, modal, steady-state, and static analysis • Limited thermal model • Residual stress/strain models • Non-inertial frames • Improved algorithms • Preliminary process sensitivity modeling