
OUR VISION Leading Fiji to Economic Success OUR



















- Slides: 54
OUR VISION Leading Fiji to Economic Success OUR VISION Leading Fiji to Economic Success OUR VISION Leading Fiji to Economic Success Leading Fiji to Economic Success OUR VISION Leading Fiji to Economic Succ PRESENTATION AT THE CONSTRUCTION INDUSTRY COUNCIL CONFERENCE STATE OF THE ECONOMY 15 JUNE 2019
PRESENTATION OUTLINE International Economy Domestic Economy Monetary Policy: RBF’s Twin Objectives A Snapshot of the Construction Industry Key issues for the Construction Industry Summary
GLOBAL ECONOMY
TRADING PARTNER GROWTH Global growth is expected to strengthen… Real GDP Growth Projections (percent change from earlier forecast) World U. S. Euro Area Japan Australia NZ India China 2019 (@Jan ’ 19)* 3. 5 2. 5 1. 6 1. 1 2. 8 3. 0 7. 5 6. 2 2019 (@Apr ‘ 19) 3. 3 2. 3 1. 0 2. 1 2. 5 7. 3 6. 3 Change (PP) -0. 2 -0. 3 -0. 1 -0. 7 -0. 5 -0. 2 +0. 1 Sources: IMF World Economic Outlook April 2019; *Australia and New Zealand from October 2018 WEO
DOMESTIC ECONOMY
FIJI’S GDP GROWTH OUTLOOK Favorable outlook in the medium term though not quite the 5% we are looking for Actuals % Forecast as @May 19 Target 8 Average 1970 -2018 = 3. 0% Average 5 Years = 4. 7% 5. 6 6 4. 7 4 2 3. 0 4. 7 2. 7 Average 10 Years = 3. 4% 5. 2 4. 2 2. 7 2. 6 3. 0 2020 f 2021 1. 4 1. 0 0 -2 2008 -1. 4 2009 2010 2011 2012 2013 2014 2015 2016 2017 2018 e 2019 f Source: Macroeconomic Committee
SECTORAL FORECASTS FOR 2019 Sugarcane Production: +10. 3% Electricity Generation: +5. 0% Sugar Production: +29. 7% Gold Production: -4. 0% Forestry & Logging: +0. 3% Visitor Arrivals: +2. 5% Fisheries & Aquaculture: +0. 1% Source: Macroeconomic Committee
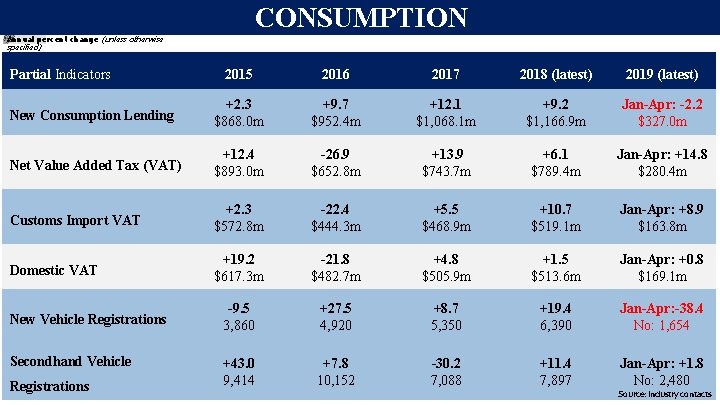
CONSUMPTION Annual percent change (unless otherwise specified) Partial Indicators 2015 2016 2017 2018 (latest) 2019 (latest) New Consumption Lending +2. 3 $868. 0 m +9. 7 $952. 4 m +12. 1 $1, 068. 1 m +9. 2 $1, 166. 9 m Jan-Apr: -2. 2 $327. 0 m Net Value Added Tax (VAT) +12. 4 $893. 0 m -26. 9 $652. 8 m +13. 9 $743. 7 m +6. 1 $789. 4 m Jan-Apr: +14. 8 $280. 4 m Customs Import VAT +2. 3 $572. 8 m -22. 4 $444. 3 m +5. 5 $468. 9 m +10. 7 $519. 1 m Jan-Apr: +8. 9 $163. 8 m Domestic VAT +19. 2 $617. 3 m -21. 8 $482. 7 m +4. 8 $505. 9 m +1. 5 $513. 6 m Jan-Apr: +0. 8 $169. 1 m -9. 5 3, 860 +27. 5 4, 920 +8. 7 5, 350 +19. 4 6, 390 Jan-Apr: -38. 4 No: 1, 654 +43. 0 9, 414 +7. 8 10, 152 -30. 2 7, 088 +11. 4 7, 897 Jan-Apr: +1. 8 No: 2, 480 New Vehicle Registrations Secondhand Vehicle Registrations Source: Industry contacts
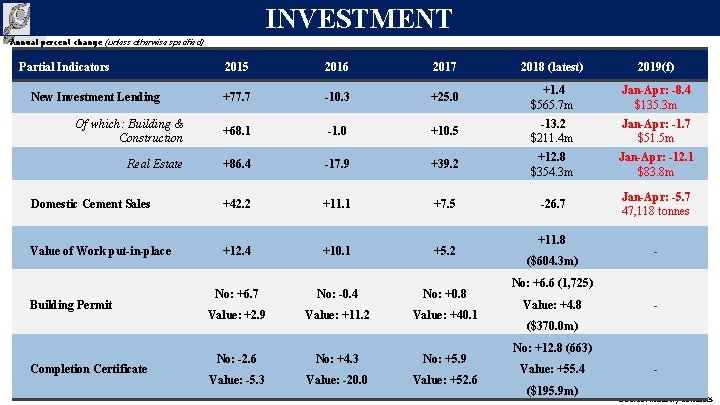
INVESTMENT Annual percent change (unless otherwise specified) Partial Indicators 2015 2016 2017 2018 (latest) 2019(f) +77. 7 -10. 3 +25. 0 +1. 4 $565. 7 m Jan-Apr: -8. 4 $135. 3 m Of which: Building & Construction +68. 1 -1. 0 +10. 5 -13. 2 $211. 4 m Jan-Apr: -1. 7 $51. 5 m Real Estate +86. 4 -17. 9 +39. 2 +12. 8 $354. 3 m Jan-Apr: -12. 1 $83. 8 m Domestic Cement Sales +42. 2 +11. 1 +7. 5 -26. 7 Jan-Apr: -5. 7 47, 118 tonnes Value of Work put-in-place +12. 4 +10. 1 +5. 2 No: +6. 7 No: -0. 4 No: +0. 8 Value: +2. 9 Value: +11. 2 Value: +40. 1 No: -2. 6 No: +4. 3 No: +5. 9 Value: -5. 3 Value: -20. 0 Value: +52. 6 New Investment Lending Building Permit Completion Certificate +11. 8 ($604. 3 m) - No: +6. 6 (1, 725) Value: +4. 8 - ($370. 0 m) No: +12. 8 (663) Value: +55. 4 ($195. 9 m) Source: Industry contacts
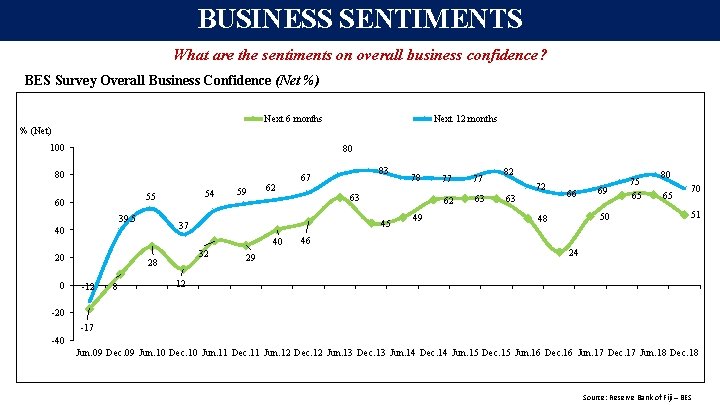
BUSINESS SENTIMENTS What are the sentiments on overall business confidence? BES Survey Overall Business Confidence (Net %) Next 6 months Next 12 months % (Net) 100 80 80 54 55 60 39. 5 59 62 45 40 20 0 32 28 -12 8 29 78 63 37 40 83 67 49 77 77 62 63 82 72 63 66 69 50 48 75 65 80 65 70 51 46 24 12 -20 -17 -40 Jun. 09 Dec. 09 Jun. 10 Dec. 10 Jun. 11 Dec. 11 Jun. 12 Dec. 12 Jun. 13 Dec. 13 Jun. 14 Dec. 14 Jun. 15 Dec. 15 Jun. 16 Dec. 16 Jun. 17 Dec. 17 Jun. 18 Dec. 18 Source: Reserve Bank of Fiji – BES
MEDIUM-TERM INVESTMENT OUTLOOK What are the sentiments on investment? % of Firms (Net) Plant & Machinery % of Firms (Net) 100 90 83. 0 70 50 90 86. 2 80 60 60. 9 62. 0 58. 3 78. 0 79. 1 78. 1 75. 0 70. 0 84. 0 79. 3 80 72. 472. 3 69. 2 65. 8 70 64 60 40 26. 8 51. 3 49. 3 38. 8 55 50 48 51 47 47 36 38 35. 7 29. 9 24. 5 20 10 10 Dec. 09 Dec. 10 Dec. 11 Dec. 12 Dec-13 Dec-14 Dec-15 Dec-16 Dec-17 Dec-18 54 43 30 20 0 60 59 50 50. 0 40 30 Buildings 0 Dec. 09 Jun. 11 Dec. 12 Jun-14 Dec-15 Jun-17 Dec-18 Source: Reserve Bank of Fiji – BES
INVESTMENT Need to sustain the 25% target % of GDP Changes in inventories 30. 0 Government Private & Public Enterprises Government Target: 25% 25. 0 20. 1 19. 7 20. 0 17. 9 17. 7 15. 0 10. 0 5. 0 0. 0 11. 9 4. 4 1. 5 2014 Gap $534 m 12. 4 10. 6 5. 1 6. 0 2. 1 1. 2 2015 2016 r *Estimated change in inventories to be around 2. 0% of GDP in 2017 while FBOS kept it at zero 7. 5 2. 0 2017 p Sources: FBOS and RBF Estimates
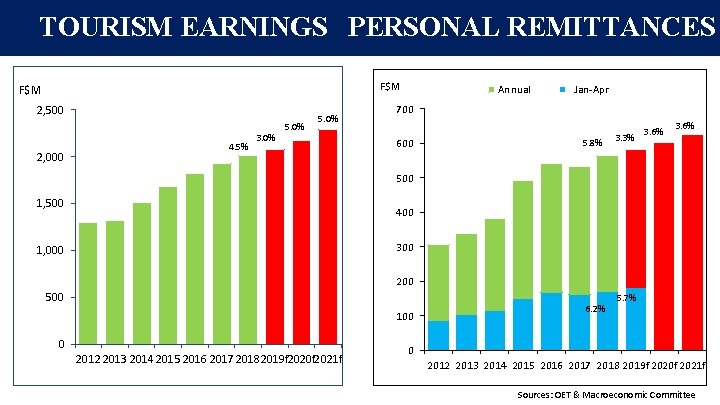
TOURISM EARNINGS PERSONAL REMITTANCES F$M 2, 500 2, 000 4. 5% 3. 0% 5. 0% Annual Jan-Apr 700 600 5. 8% 3. 3% 3. 6% 500 1, 500 400 300 1, 000 200 500 100 0 2012 2013 2014 2015 2016 2017 20182019 f 2020 f 2021 f 6. 2% 5. 7% 0 2012 2013 2014 2015 2016 2017 2018 2019 f 2020 f 2021 f Sources: OET & Macroeconomic Committee
GOVERNMENT EXPENDITURE Where is the rise in expenditure diverted to? Revenue Expenditure F$M 4000. 0 3500. 0 Expenditure Mix F$M 5000. 0 3491. 7 3000. 0 % 100 4500. 0 4000. 0 80 3000. 0 60 2000. 0 2500. 0 50 2000. 0 40 1500. 0 30 1000. 0 20 500. 0 10 0. 0 0 20 2004 2005 2006 2007 2008 2009 2010 2011 2012 2013 20 2014 2016 15 20 20 17 -17 19 18 -2 -1 0 9 (b ) *Revenue for FY 2017 -18 includes asset sales. 67 33 20 2004 2005 2006 2007 2008 2009 2010 2011 2012 2 13 20 01 2 4 2016 - 01 20 5 1 2 7 1 20018 -2017 19 -2 8 -2 01 0 9 (b ) 2500. 0 20 2004 2005 2006 2007 2008 2009 2010 2011 2012 2013 20 2014 2016 -15 20 20117 -17 19 8 18 -2 -1 0 9 (b ) 70 1000. 0 Capital 90 3840. 9 3500. 0 1500. 0 Operating Source: National Budget Supplements
GOVERNMENT DEBT Is rising in value terms but stable as a ratio to GDP Domestic External Domestic % of GDP $M External 60 6, 000 53 4 5, 000 408 0 4, 000 4 4548 228 34 840 1399 4 3. 0 40 1352 1254 44. 5 1457 1246 44. 4 44. 1 45. 6 13. 7 12. 7 13. 1 12. 8 30. 4 31. 0 31. 6 12. 4 3, 000 2826 2982 3196 2014 2015 2016 3441 3877 20 33. 1 1, 000 0 0 2011 2012 2013 2017 2018 2010 2011 2012 2013 2014 2015 2016 2017 2018 Sources: MOE & RBF
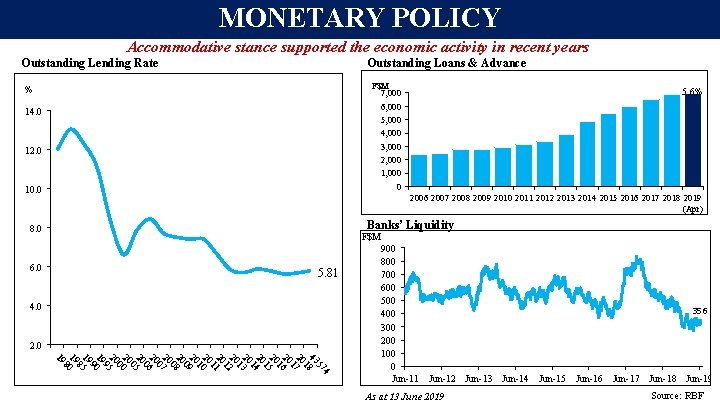
MONETARY POLICY Accommodative stance supported the economic activity in recent years Outstanding Loans & Advance Outstanding Lending Rate F$M 7, 000 6, 000 5, 000 4, 000 3, 000 2, 000 1, 000 0 % 14. 0 12. 0 10. 0 2006 2007 2008 2009 2010 2011 2012 2013 2014 2015 2016 2017 2018 2019 (Apr) Banks’ Liquidity 8. 0 6. 0 5. 6% F$M 5. 81 4. 0 2. 0 4 57 43 8 1 20 7 1 20 6 1 20 5 1 20 14 20 3 1 20 2 1 20 1 1 20 0 1 20 9 0 20 8 0 20 7 0 20 6 0 20 5 0 20 0 0 20 95 19 0 9 19 5 8 19 0 8 19 900 800 700 600 500 356 400 300 200 100 0 Jun-11 Jun-12 Jun-13 Jun-14 Jun-15 Jun-16 Jun-17 Jun-18 Jun-19 As at 13 June 2019 Source: RBF
MONETARY POLICY: RBF’s TWIN OBJECTIVES INFLATION FOREIGN RESERVES
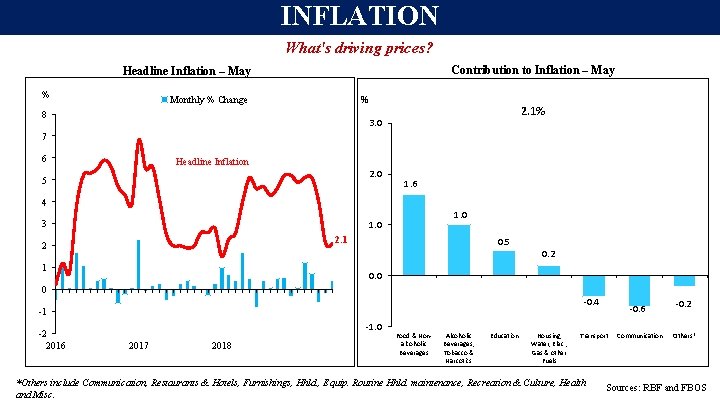
INFLATION What's driving prices? Contribution to Inflation – May Headline Inflation – May % % Monthly % Change 8 2. 1% 3. 0 7 6 Headline Inflation 2. 0 5 1. 6 4 3 1. 0 2. 1 2 0. 5 0. 2 1 0. 0 0 -0. 4 -1 -2 2016 -1. 0 2017 2018 Food & Nonalcoholic Beverages Alcoholic Beverages, Tobacco & Narcotics Education Housing, Water, Elec. , Gas & other Fuels -0. 6 Transport *Others include Communication, Restaurants & Hotels, Furnishings, Hhld. , Equip. Routine Hhld. maintenance, Recreation & Culture, Health and Misc. Communication -0. 2 Others* Sources: RBF and FBOS
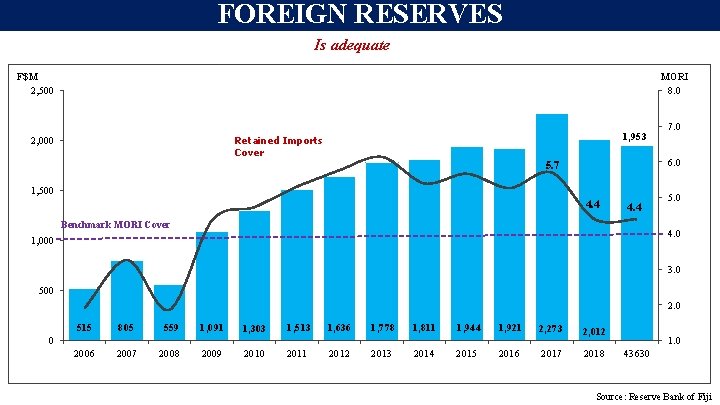
FOREIGN RESERVES Is adequate F$M 2, 500 MORI 8. 0 1, 953 Retained Imports Cover 2, 000 7. 0 6. 0 5. 7 1, 500 4. 4 Benchmark MORI Cover 5. 0 4. 0 1, 000 3. 0 500 2. 0 515 805 559 1, 091 1, 303 1, 513 1, 636 1, 778 1, 811 1, 944 1, 921 2, 273 2, 012 2006 2007 2008 2009 2010 2011 2012 2013 2014 2015 2016 2017 2018 0 1. 0 43630 Source: Reserve Bank of Fiji
A SNAPSHOT OF THE CONSTRUCTION INDUSTRY
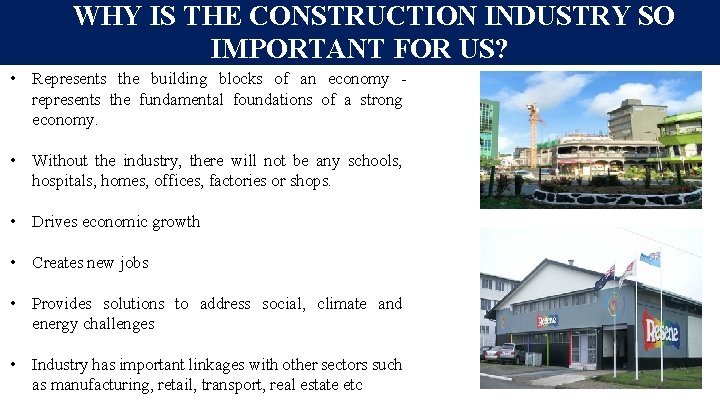
WHY IS THE CONSTRUCTION INDUSTRY SO IMPORTANT FOR US? • Represents the building blocks of an economy represents the fundamental foundations of a strong economy. • Without the industry, there will not be any schools, hospitals, homes, offices, factories or shops. • Drives economic growth • Creates new jobs • Provides solutions to address social, climate and energy challenges • Industry has important linkages with other sectors such as manufacturing, retail, transport, real estate etc
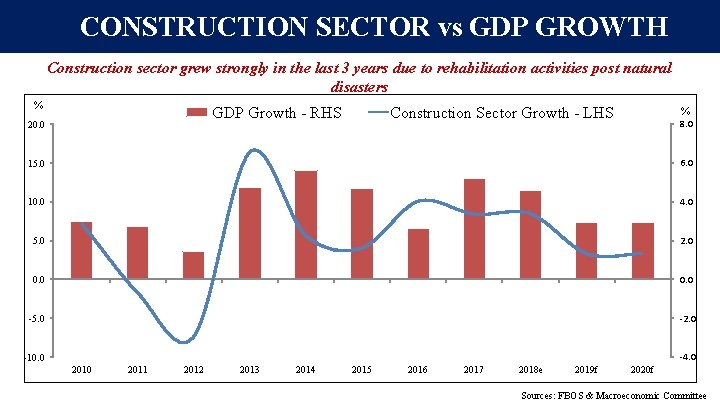
CONSTRUCTION SECTOR vs GDP GROWTH Construction sector grew strongly in the last 3 years due to rehabilitation activities post natural disasters % GDP Growth - RHS 20. 0 Construction Sector Growth - LHS % 8. 0 15. 0 6. 0 10. 0 4. 0 5. 0 2. 0 0. 0 -5. 0 -2. 0 -4. 0 -10. 0 2011 2012 2013 2014 2015 2016 2017 2018 e 2019 f 2020 f Sources: FBOS & Macroeconomic Committee
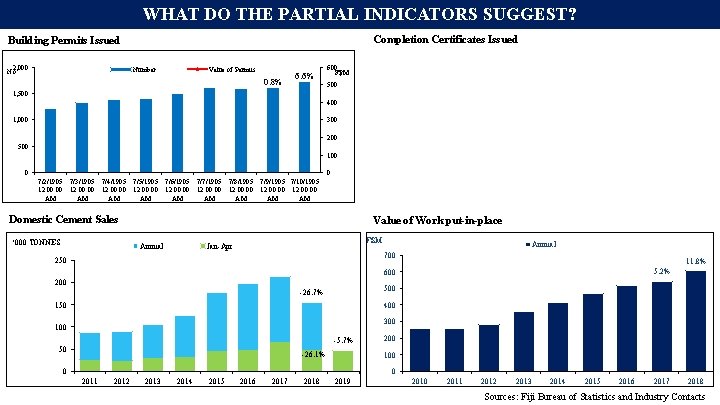
WHAT DO THE PARTIAL INDICATORS SUGGEST? Completion Certificates Issued Building Permits Issued 2, 000 No. Number Value of Permits 0. 8% 6. 6% 600 F$M 500 1, 500 400 1, 000 300 200 500 100 0 0 7/2/1905 7/3/1905 7/4/1905 7/5/1905 7/6/1905 7/7/1905 7/8/1905 7/9/1905 7/10/1905 12: 00: 00 12: 00: 00 12: 00 AM AM AM Domestic Cement Sales ‘ 000 TONNES Value of Work put-in-place Annual F$M Jan-Apr Annual 700 250 11. 8% 5. 2% 600 200 500 -26. 7% 150 400 300 100 -5. 7% 50 -26. 1% 200 100 0 0 2011 2012 2013 2014 2015 2016 2017 2018 2019 2010 2011 2012 2013 2014 2015 2016 2017 2018 Sources: Fiji Bureau of Statistics and Industry Contacts
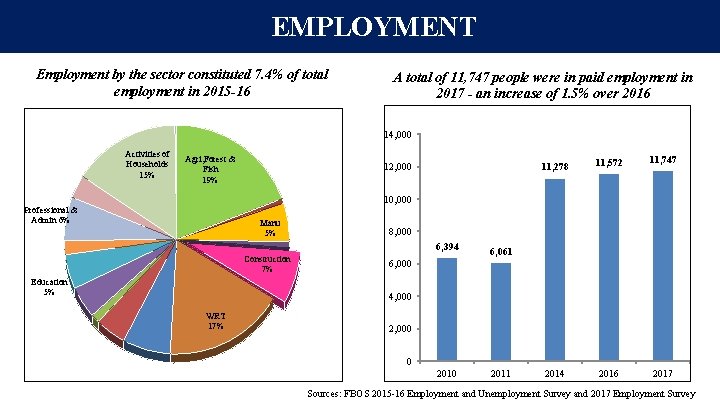
EMPLOYMENT Employment by the sector constituted 7. 4% of total employment in 2015 -16 A total of 11, 747 people were in paid employment in 2017 - an increase of 1. 5% over 2016 14, 000 Activities of Households 15% Agri, Forest & Fish 19% 12, 000 11, 278 11, 572 11, 747 2014 2016 2017 10, 000 Professional & Admin 6% Manu 5% 8, 000 6, 394 Construction 7% Education 5% 6, 061 6, 000 4, 000 WRT 17% 2, 000 0 2011 Sources: FBOS 2015 -16 Employment and Unemployment Survey and 2017 Employment Survey
BANK LENDING TO THE CONSTRUCTION SECTOR Commercial Banks’ New Lending Thousands Commercial Banks’ Outstanding Lending 300 900 779 800 250 211 200 700 600 500 150 400 100 300 200 50 100 8 - 37 - 00 20 02 20 04 20 2 6 00 2 8 00 2 0 01 2 2 01 2 4 01 2 6 01 2 8 01 00 20 02 20 04 20 06 20 8 0 20 20 12 20 14 20 16 20 18 Source: Reserve Bank of Fiji
BANK LENDING TO THE CONSTRUCTION SECTOR Commercial Banks’ Outstanding Lending Interest Rates Construction Sector WALR 10. 00% 8. 89% 9. 00% 8. 31% 8. 00% 7. 00% 6. 00% 5. 69% 5. 02% 5. 00% 4. 00% 00 20 01 20 2 0 20 3 0 20 04 20 05 20 06 20 07 20 08 20 09 20 10 20 11 20 12 20 13 20 14 20 15 20 16 20 17 20 18 20 Source: Reserve Bank of Fiji
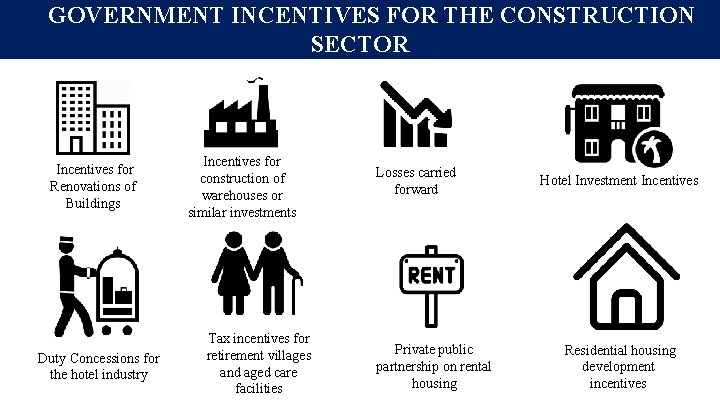
GOVERNMENT INCENTIVES FOR THE CONSTRUCTION SECTOR Incentives for Renovations of Buildings Duty Concessions for the hotel industry Incentives for construction of warehouses or similar investments Tax incentives for retirement villages and aged care facilities Losses carried forward Private public partnership on rental housing Hotel Investment Incentives Residential housing development incentives
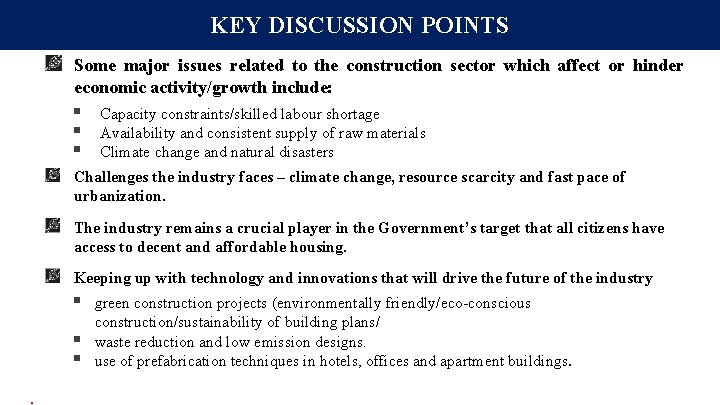
KEY DISCUSSION POINTS Some major issues related to the construction sector which affect or hinder economic activity/growth include: § § § Capacity constraints/skilled labour shortage Availability and consistent supply of raw materials Climate change and natural disasters Challenges the industry faces – climate change, resource scarcity and fast pace of urbanization. The industry remains a crucial player in the Government’s target that all citizens have access to decent and affordable housing. Keeping up with technology and innovations that will drive the future of the industry § § §. green construction projects (environmentally friendly/eco-conscious construction/sustainability of building plans/ waste reduction and low emission designs. use of prefabrication techniques in hotels, offices and apartment buildings.
SUMMARY ON THE MACROECONOMY The construction industry has important linkages with other sectors. Therefore, its impact on GDP and economic development goes well beyond the direct contribution of the construction activities Domestic economy is forecast to achieve 10 th year of consecutive growth, however, at a slower pace The current monetary and fiscal policy stance remains appropriate and supportive of economic growth Monetary policy objectives remain intact § Inflation stood at 2. 1 percent in May and is expected to remain around 3. 2 percent by year-end § Foreign reserves are forecast to remain adequate by year-end
THANK YOU
SPARES
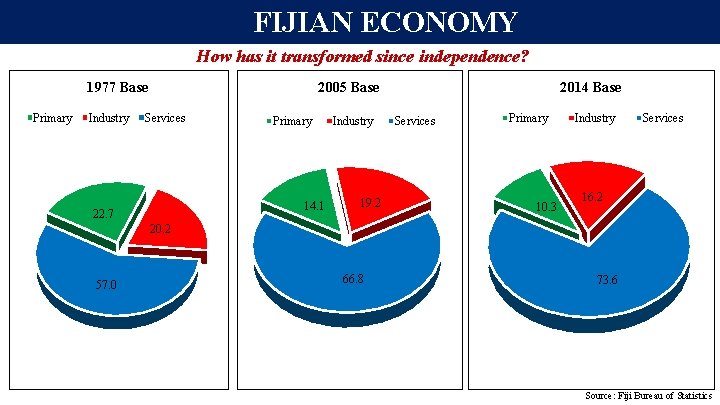
FIJIAN ECONOMY How has it transformed since independence? 1977 Base Primary Industry 2005 Base Services Primary 14. 1 22. 7 Industry 19. 2 2014 Base Services Primary 10. 3 Industry Services 16. 2 20. 2 57. 0 66. 8 73. 6 Source: Fiji Bureau of Statistics
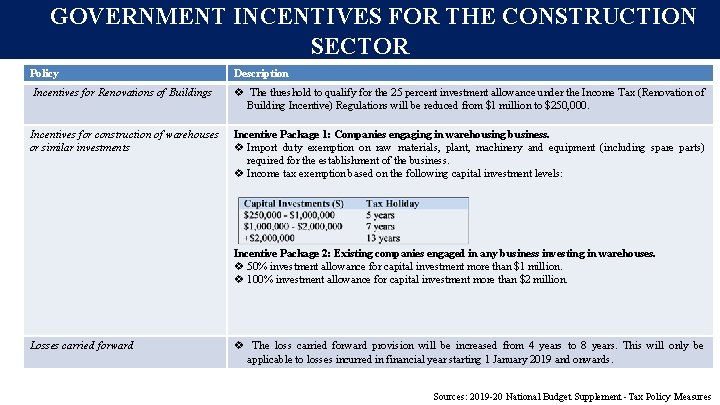
GOVERNMENT INCENTIVES FOR THE CONSTRUCTION SECTOR Policy Description Incentives for Renovations of Buildings v The threshold to qualify for the 25 percent investment allowance under the Income Tax (Renovation of Building Incentive) Regulations will be reduced from $1 million to $250, 000. Incentives for construction of warehouses or similar investments Incentive Package 1: Companies engaging in warehousing business. v Import duty exemption on raw materials, plant, machinery and equipment (including spare parts) required for the establishment of the business. v Income tax exemption based on the following capital investment levels: Incentive Package 2: Existing companies engaged in any business investing in warehouses. v 50% investment allowance for capital investment more than $1 million. v 100% investment allowance for capital investment more than $2 million. Losses carried forward v The loss carried forward provision will be increased from 4 years to 8 years. This will only be applicable to losses incurred in financial year starting 1 January 2019 and onwards. Sources: 2019 -20 National Budget Supplement -Tax Policy Measures
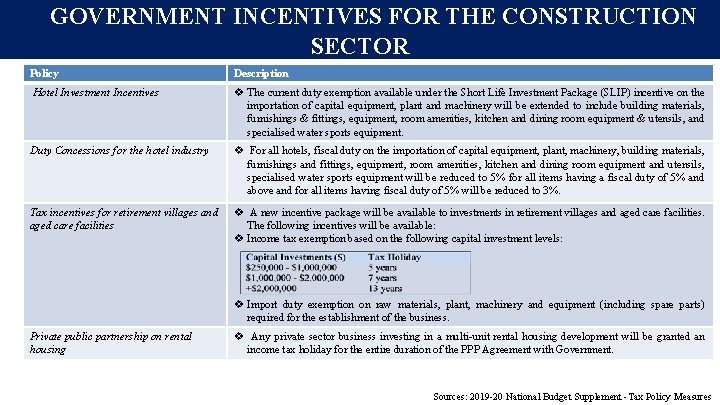
GOVERNMENT INCENTIVES FOR THE CONSTRUCTION SECTOR Policy Description Hotel Investment Incentives v The current duty exemption available under the Short Life Investment Package (SLIP) incentive on the importation of capital equipment, plant and machinery will be extended to include building materials, furnishings & fittings, equipment, room amenities, kitchen and dining room equipment & utensils, and specialised water sports equipment. Duty Concessions for the hotel industry v For all hotels, fiscal duty on the importation of capital equipment, plant, machinery, building materials, furnishings and fittings, equipment, room amenities, kitchen and dining room equipment and utensils, specialised water sports equipment will be reduced to 5% for all items having a fiscal duty of 5% and above and for all items having fiscal duty of 5% will be reduced to 3%. Tax incentives for retirement villages and aged care facilities v A new incentive package will be available to investments in retirement villages and aged care facilities. The following incentives will be available: v Income tax exemption based on the following capital investment levels: v Import duty exemption on raw materials, plant, machinery and equipment (including spare parts) required for the establishment of the business. Private public partnership on rental housing v Any private sector business investing in a multi-unit rental housing development will be granted an income tax holiday for the entire duration of the PPP Agreement with Government. Sources: 2019 -20 National Budget Supplement -Tax Policy Measures
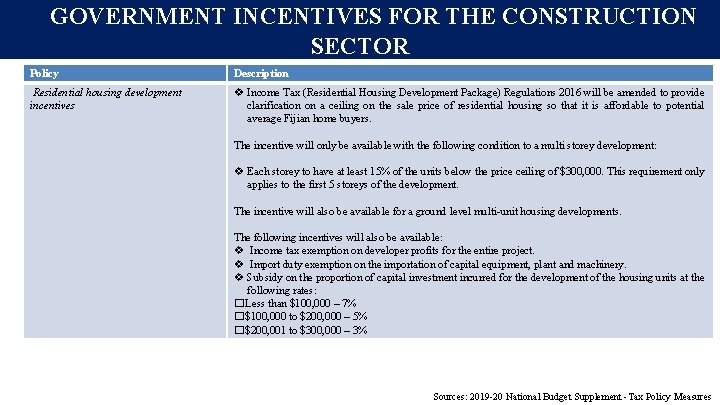
GOVERNMENT INCENTIVES FOR THE CONSTRUCTION SECTOR Policy Description Residential housing development incentives v Income Tax (Residential Housing Development Package) Regulations 2016 will be amended to provide clarification on a ceiling on the sale price of residential housing so that it is affordable to potential average Fijian home buyers. The incentive will only be available with the following condition to a multi storey development: v Each storey to have at least 15% of the units below the price ceiling of $300, 000. This requirement only applies to the first 5 storeys of the development. The incentive will also be available for a ground level multi-unit housing developments. The following incentives will also be available: v Income tax exemption on developer profits for the entire project. v Import duty exemption on the importation of capital equipment, plant and machinery. v Subsidy on the proportion of capital investment incurred for the development of the housing units at the following rates: � Less than $100, 000 – 7% � $100, 000 to $200, 000 – 5% � $200, 001 to $300, 000 – 3% Sources: 2019 -20 National Budget Supplement -Tax Policy Measures
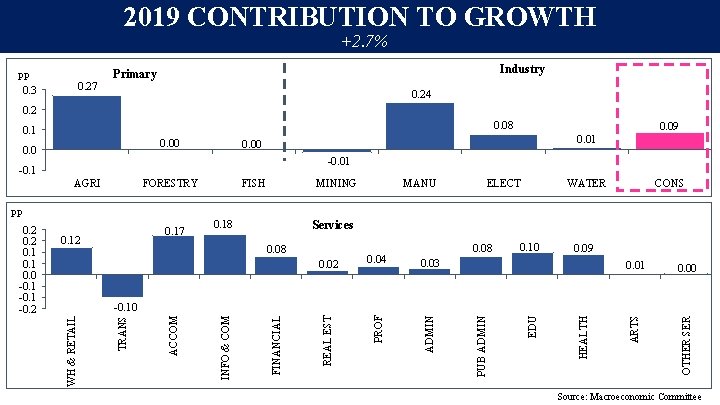
2019 CONTRIBUTION TO GROWTH +2. 7% pp 0. 3 0. 27 Industry Primary 0. 24 0. 2 0. 08 0. 1 0. 00 0. 09 0. 01 0. 00 -0. 01 -0. 1 AGRI FORESTRY FISH MINING MANU ELECT WATER CONS pp 0. 18 Services 0. 03 ADMIN 0. 10 0. 09 0. 01 0. 00 OTHER SER 0. 02 PROF 0. 08 0. 04 REAL EST 0. 08 ARTS 0. 17 0. 12 HEALTH EDU PUB ADMIN FINANCIAL INFO & COM ACCOM TRANS -0. 10 WH & RETAIL 0. 2 0. 1 0. 0 -0. 1 -0. 2 Source: Macroeconomic Committee
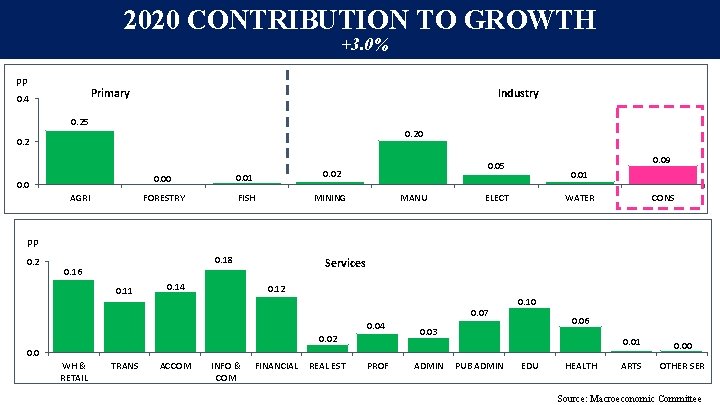
2020 CONTRIBUTION TO GROWTH +3. 0% pp Industry Primary 0. 4 0. 25 0. 20 0. 2 0. 0 AGRI 0. 00 0. 01 0. 02 FORESTRY FISH MINING 0. 09 0. 05 MANU 0. 01 ELECT WATER CONS pp 0. 2 0. 18 0. 16 0. 11 0. 14 Services 0. 12 0. 07 0. 04 0. 02 0. 10 0. 06 0. 03 0. 0 WH & RETAIL TRANS ACCOM INFO & COM FINANCIAL REAL EST PROF ADMIN PUB ADMIN EDU HEALTH 0. 01 0. 00 ARTS OTHER Source: Macroeconomic Committee
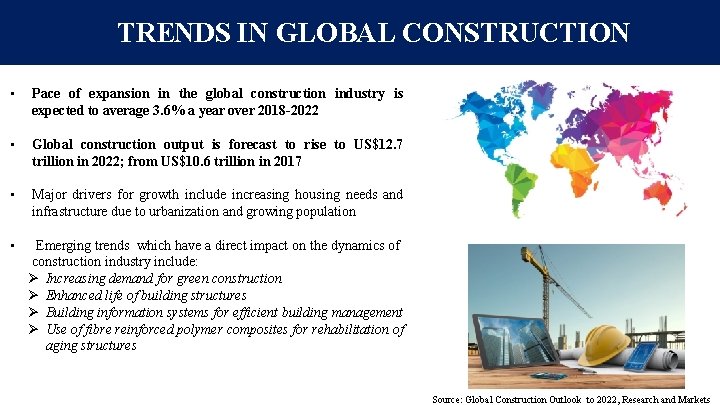
TRENDS IN GLOBAL CONSTRUCTION • Pace of expansion in the global construction industry is expected to average 3. 6% a year over 2018 -2022 • Global construction output is forecast to rise to US$12. 7 trillion in 2022; from US$10. 6 trillion in 2017 • Major drivers for growth include increasing housing needs and infrastructure due to urbanization and growing population • Emerging trends which have a direct impact on the dynamics of construction industry include: Ø Increasing demand for green construction Ø Enhanced life of building structures Ø Building information systems for efficient building management Ø Use of fibre reinforced polymer composites for rehabilitation of aging structures Source: Global Construction Outlook to 2022, Research and Markets
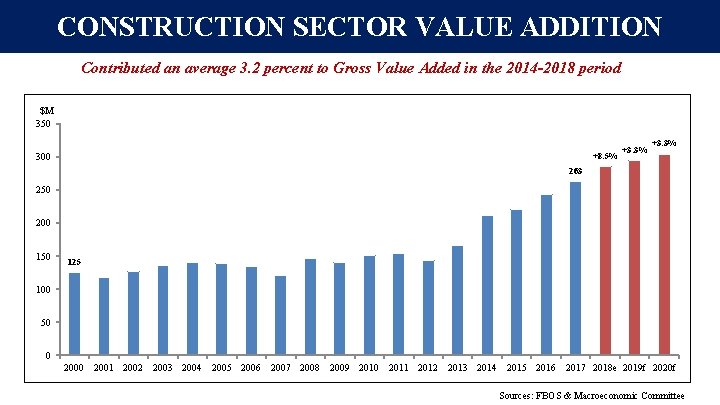
CONSTRUCTION SECTOR VALUE ADDITION Contributed an average 3. 2 percent to Gross Value Added in the 2014 -2018 period $M 350 +8. 5% 300 +3. 3% 263 250 200 150 125 100 50 0 2001 2002 2003 2004 2005 2006 2007 2008 2009 2010 2011 2012 2013 2014 2015 2016 2017 2018 e 2019 f 2020 f Sources: FBOS & Macroeconomic Committee
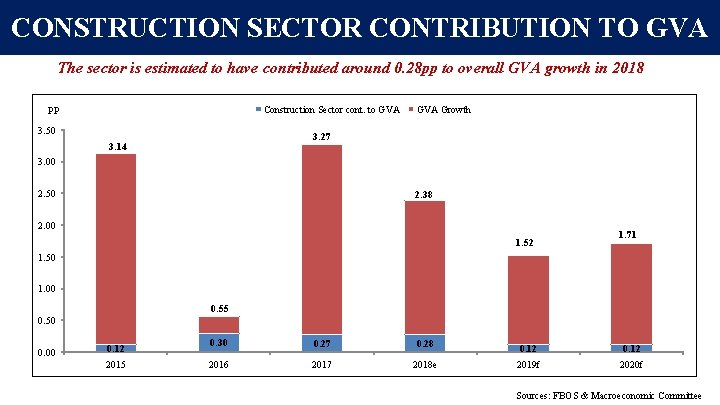
CONSTRUCTION SECTOR CONTRIBUTION TO GVA The sector is estimated to have contributed around 0. 28 pp to overall GVA growth in 2018 Construction Sector cont. to GVA PP 3. 50 GVA Growth 3. 27 3. 14 3. 00 2. 50 2. 38 2. 00 1. 52 1. 71 1. 50 1. 00 0. 55 0. 50 0. 00 0. 12 2015 0. 30 0. 27 0. 28 2016 2017 2018 e 0. 12 2019 f 2020 f Sources: FBOS & Macroeconomic Committee
COMPONENTS OF CONSTRUCTION SECTOR Private construction constitutes around 65% of total construction activity Informal $M Formal non-Government (Private) 350 300 250 200 158 167 186 193 199 133 141 78 79 84 95 99 101 105 2014 2015 2016 2017 2018 e 2019 f 2020 f 100 50 0 Sources: FBOS & Macroeconomic Committee
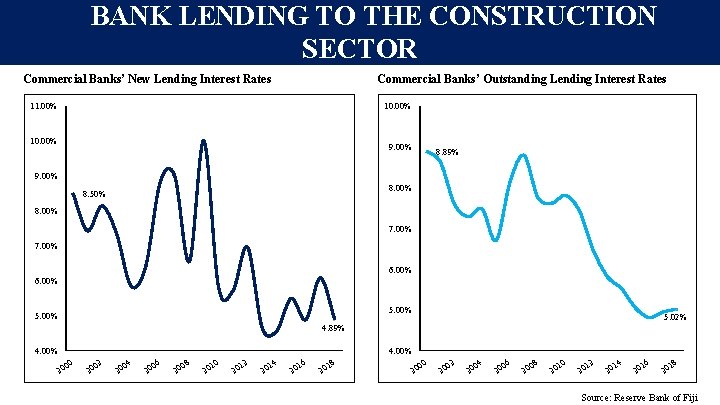
BANK LENDING TO THE CONSTRUCTION SECTOR Commercial Banks’ New Lending Interest Rates Commercial Banks’ Outstanding Lending Interest Rates 11. 00% 10. 00% 9. 00% 8. 89% 9. 00% 8. 50% 8. 00% 7. 00% 6. 00% 5. 02% 4. 89% 4. 00% 00 20 02 20 04 20 20 06 20 08 20 10 20 12 20 14 20 16 20 18 00 20 02 20 04 20 06 20 20 08 20 10 20 12 20 14 20 16 20 18 Source: Reserve Bank of Fiji
CONSTRUCTION SECTOR WEIGHTS How have the weights changed ? 2014 Base 1995 Base Agri, Fish & Forest Community & Social 19% 17% Agri, Fis. H & Forest 10% Education 8% Public Admin 9% Finance &Real Estate 15% Manufacturing 13% Real Estate 4% Transport 8% Manufacturing 14% Financial 10% WRT 11% WRT 10% Building & Construction 5% Construction 3% Transport 8% Source: Fiji Bureau of Statistics
GOVERNMENT INCENTIVES FOR THE CONSTRUCTION SECTOR Policy Description 1. Fiscal import duty reduction Reduction on the fiscal import duty on: v fabricated steel structures from 32 percent to 5 percent v insulated (electrical) cables from 32 percent to 15 percent v glues, epoxies, sealer, protective coatings, polishes and creams, and similar appropriations from 15 percent to 5 percent v steel and aluminium louver frame from 32 percent to 5 percent 2. Promoting the upgrade and modernisation of buildings v v 3. New Dwelling House VAT refund v Eligible person can claim a refund for the amount of VAT paid for acquiring the home or VAT paid for building materials and services but only to a maximum VAT inclusive price of $120, 000 4. Residential Housing Development Investment v Government subsidising return on investment throught rental payments to investors that build housing units 5. First Homeowners Grant v Families with an annual income under $50, 000 are eligible to receive $15, 000 towards construction or $10, 000 toward the purchase of their first home. 6. Standard Allowance v v Investment allowance of 25% of total expenditure is allowed as a deduction. Applicable to building of a new hotel and renovations or refurbishments or extension existing hotel. 7. National Qualification Initiative v v Standardised National Qualifications in Carpentry (International benchmarked National Qualification) Memorandum of Understanding (Mo. U) signed between the Australian Pacific Training Coalition (APTC), the Fiji National University (FNU), the Fiji Higher Education Commission (FHEC) and the Construction Industry Council (CIC). 125 percent tax deduction on total expenditure incurred for renovation and redevelopment 25 percent investment allowance on total capital expenditure incurred for extension or redevelopment Sources: National Budget Supplements -Tax Policy Measures and FNU
GOVERNMENT REVENUE FY 18 -19 B F$M FY 19 -20 B Total Revenue (F$M) % of GDP 17 -18(a) 18 -19(r) 19 -20(b) Direct Taxes 826. 8 768. 5 804. 8 o/w Income Taxes 751. 0 711. 7 744. 4 Indirect Taxes 2, 004. 9 2, 139. 5 2, 275. 4 o/w VAT 788. 8 854. 2 909. 0 Customs 668. 6 701. 1 746. 0 Departure Tax 147. 5 153. 5 163. 3 ECAL 150. 5 164. 8 174. 1 Capital Revenue 15. 2 23. 4 94. 7 o/w Govt Asset Sales 1. 4 5. 0 80. 0 3, 244. 4 3, 256. 1 3, 491. 7 30. 0 5, 000 28. 6 27. 0 4, 236. 4 4, 000 3, 372. 2 3, 244. 4 3, 256. 1 27. 5 4, 008. 3 3, 491. 7 20. 0 3, 000 2, 000 10. 0 1, 000 0. 0 0 2017 -2018 -2019 -2020 Total Revenue (Including Govt. VAT) Source: 2019 -2020 National Budget Supplement
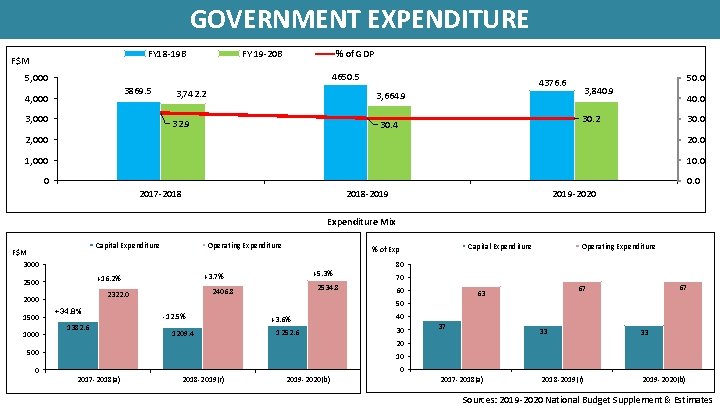
GOVERNMENT EXPENDITURE FY 18 -19 B F$M FY 19 -20 B % of GDP 4650. 5 5, 000 3869. 5 4, 000 3, 742. 2 50. 0 4376. 6 3, 840. 9 3, 664. 9 32. 9 40. 0 30. 2 30. 4 30. 0 2, 000 20. 0 1, 000 10. 0 0 0. 0 2017 -2018 -2019 -2020 Expenditure Mix Capital Expenditure F$M 3000 1000 +34. 8% 1382. 6 +5. 3% 2534. 8 2406. 8 2322. 0 2000 Capital Expenditure % of Exp +3. 7% +16. 2% 2500 1500 Operating Expenditure 80 70 60 67 67 63 50 -12. 5% 1209. 4 +3. 6% 1252. 6 40 30 37 33 33 20 500 10 0 0 2017 -2018(a) 2018 -2019(r) 2019 -2020(b) Sources: 2019 -2020 National Budget Supplement & Estimates
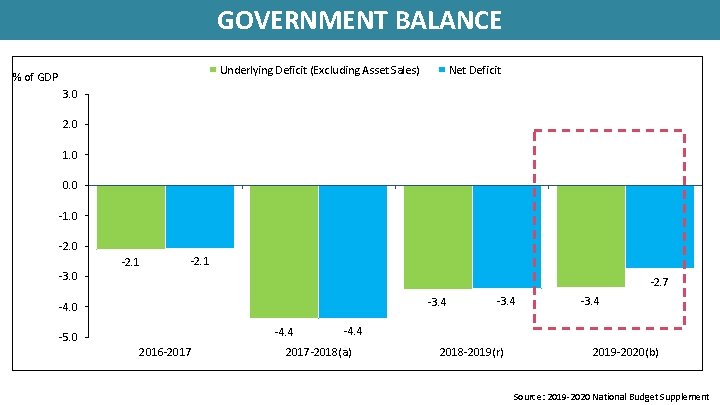
GOVERNMENT BALANCE Underlying Deficit (Excluding Asset Sales) % of GDP Net Deficit 3. 0 2. 0 1. 0 0. 0 -1. 0 -2. 0 -3. 0 -2. 1 -2. 7 -3. 4 -4. 0 -4. 4 -5. 0 2016 -2017 -3. 4 -4. 4 2017 -2018(a) 2018 -2019(r) 2019 -2020(b) Source: 2019 -2020 National Budget Supplement
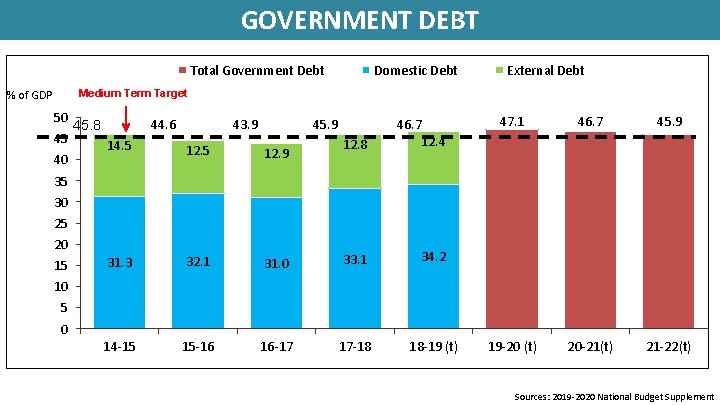
GOVERNMENT DEBT Total Government Debt Domestic Debt External Debt Medium Term Target % of GDP 50 45 40 44. 6 45. 8 43. 9 45. 9 12. 8 46. 7 12. 4 31. 0 33. 1 34. 2 16 -17 17 -18 18 -19 (t) 14. 5 12. 9 31. 3 32. 1 14 -15 15 -16 47. 1 46. 7 45. 9 19 -20 (t) 20 -21(t) 21 -22(t) 35 30 25 20 15 10 5 0 Sources: 2019 -2020 National Budget Supplement
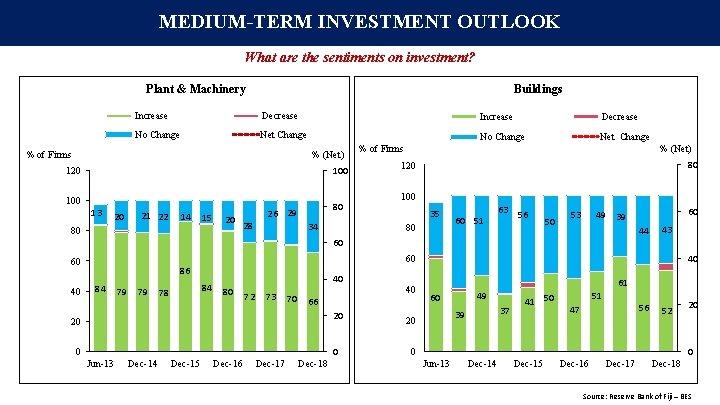
MEDIUM-TERM INVESTMENT OUTLOOK What are the sentiments on investment? Plant & Machinery Buildings Increase Decrease No Change Net Change % of Firms % (Net) 100 120 100 13 20 21 22 14 15 80 20 28 80 26 29 34 Increase Decrease No Change Net Change % (Net) % of Firms 80 120 100 35 80 60 51 63 56 50 53 49 60 39 44 43 60 40 40 60 60 86 84 79 79 84 78 40 80 72 73 70 66 20 0 Jun-13 Dec-14 Dec-15 Dec-16 Dec-17 40 Dec-18 20 20 0 0 61 49 60 37 39 41 50 51 56 47 52 20 0 Jun-13 Dec-14 Dec-15 Dec-16 Dec-17 Dec-18 Source: Reserve Bank of Fiji – BES
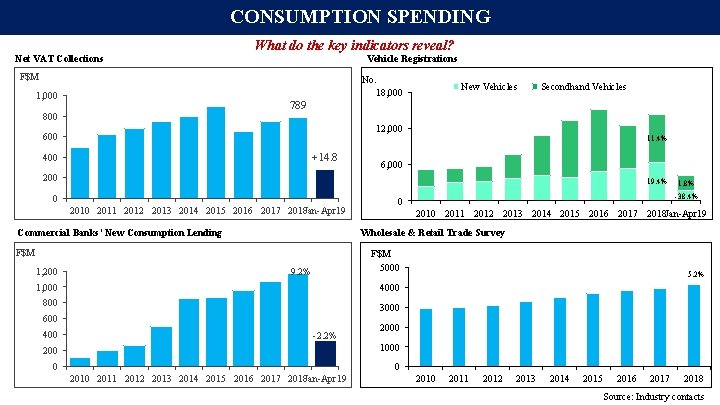
CONSUMPTION SPENDING What do the key indicators reveal? Vehicle Registrations Net VAT Collections F$M No. 18, 000 1, 000 New Vehicles Secondhand Vehicles 789 800 12, 000 600 11. 4% +14. 8 400 6, 000 200 19. 4% 0 2011 2012 2013 2014 2015 2016 2017 2018 Jan-Apr 19 Commercial Banks’ New Consumption Lending 0 2011 2012 2013 2014 2015 2016 2017 2018 Jan-Apr 19 Wholesale & Retail Trade Survey F$M 1, 200 F$M 5000 9. 2% 1, 000 4000 800 3000 600 400 1. 8% -38. 4% -2. 2% 5. 2% 2000 1000 200 0 0 2011 2012 2013 2014 2015 2016 2017 2018 Jan-Apr 19 2010 2011 2012 2013 2014 2015 2016 2017 2018 Source: Industry contacts
INVESTMENT What do the key indicators reveal? Commercial Banks’ New Investment Lending Building & Construction F$M Government's Actual Capital Expenditure F$M Real Estate +1. 4% 600 1383 1500 1200 500 400 900 300 600 200 -8. 4% 100 1209 1253 300 0 0 2006 2007 2008 2009 2010 2011 2012 2013 2014 2015 2016 2017 2018 Jan-Apr 19 Value of Work Put in Place 2010 2011 2012 2013 2014 2015 2016 FY 16 -17 FY 17 -18 FY 18 -19 FY 19 -20 Domestic Cement Sales F$M 604 +11. 8% 600 ‘ 000 TONNES 250 500 200 400 150 300 +7. 5% -26. 7% 100 200 100 50 0 0 2011 2012 2013 2014 2015 2016 2017 2018 -5. 7% 2010 2011 2012 2013 2014 2015 2016 2017 2018 Jan-Apr 19 Source: RBF and Industry contacts
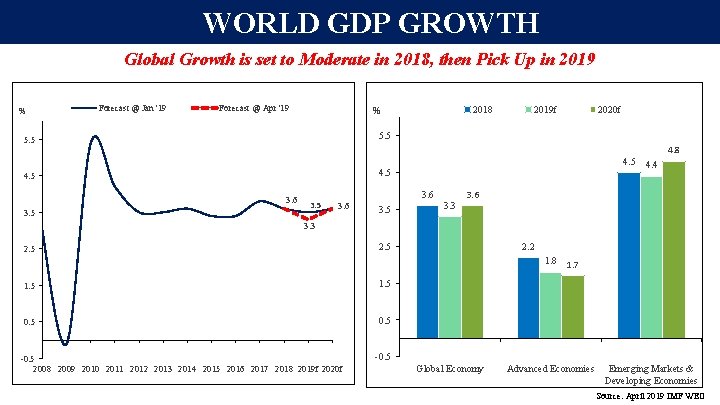
WORLD GDP GROWTH Global Growth is set to Moderate in 2018, then Pick Up in 2019 % Forecast @ Jan '19 Forecast @ Apr '19 2019 f 2020 f 5. 5 4. 4 4. 5 3. 6 3. 5 2018 % 3. 5 3. 6 3. 5 3. 3 4. 8 3. 6 3. 3 2. 5 2. 2 2. 5 1. 8 1. 7 1. 5 0. 5 -0. 5 2008 2009 2010 2011 2012 2013 2014 2015 2016 2017 2018 2019 f 2020 f -0. 5 Global Economy Advanced Economies Emerging Markets & Developing Economies Source: April 2019 IMF WEO
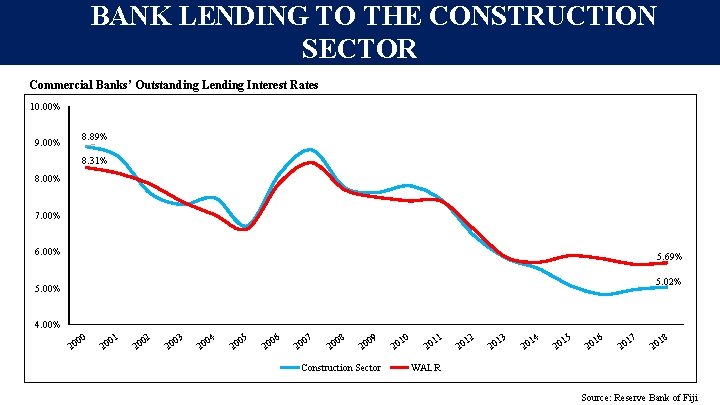
BANK LENDING TO THE CONSTRUCTION SECTOR Commercial Banks’ Outstanding Lending Interest Rates 10. 00% 8. 89% 9. 00% 8. 31% 8. 00% 7. 00% 6. 00% 5. 69% 5. 02% 5. 00% 4. 00% 00 20 01 20 2 0 20 3 0 20 04 20 05 20 06 20 07 20 08 20 09 20 Construction Sector 10 20 11 20 12 20 13 20 14 20 15 20 16 20 17 20 18 20 WALR Source: Reserve Bank of Fiji
REAL GDP GROWTH How have we performed against our historical growth rate? % 14 12 10 Average 5 Years = 4. 7% 8 Average 10 Years = 3. 4% 6 4 2 0 -2 -4 -6 -8 2018 p 2017 p 2016 r 2015 2014 2013 2012 2011 2010 2009 2008 2007 2006 2005 2004 2003 2002 2001 2000 1999 1998 1997 1996 1995 1994 1993 1992 1991 1990 1989 1988 1987 1986 1985 1984 1983 1982 1981 1980 1979 1978 1977 1976 1975 1974 1973 1972 1971 1970 Source: Fiji Bureau of Statistics