1 7 Scientific Notation and Significant Figures Fun

- Slides: 22
1. 7 Scientific Notation and Significant Figures
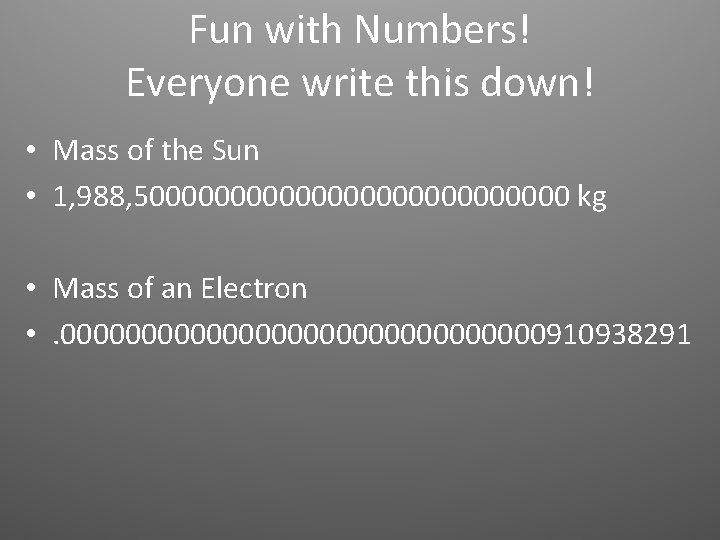
Fun with Numbers! Everyone write this down! • Mass of the Sun • 1, 988, 50000000000000 kg • Mass of an Electron • . 000000000000000910938291
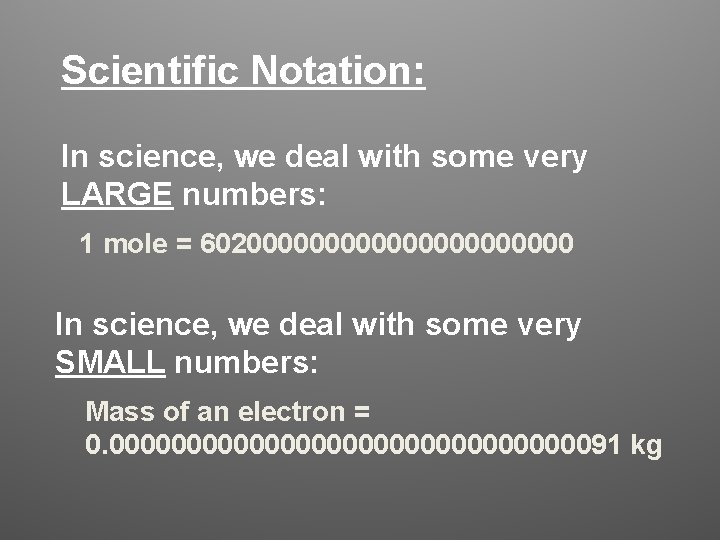
Scientific Notation: In science, we deal with some very LARGE numbers: 1 mole = 60200000000000 In science, we deal with some very SMALL numbers: Mass of an electron = 0. 000000000000000091 kg
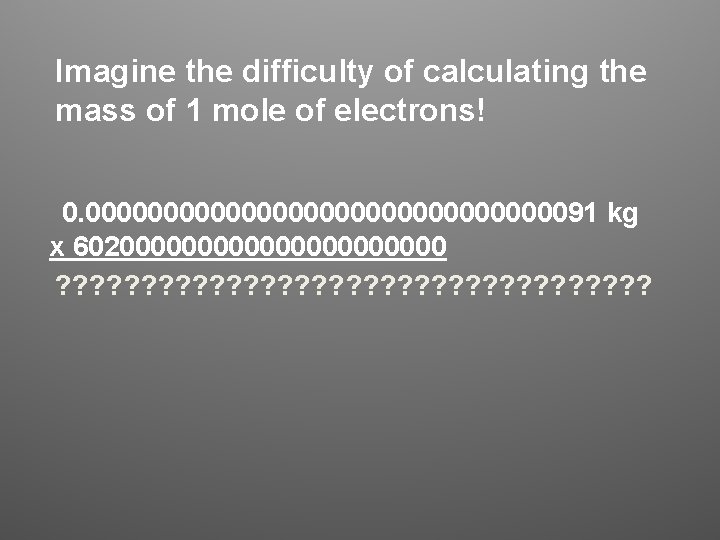
Imagine the difficulty of calculating the mass of 1 mole of electrons! 0. 000000000000000091 kg x 60200000000000 ? ? ? ? ? ? ? ? ?
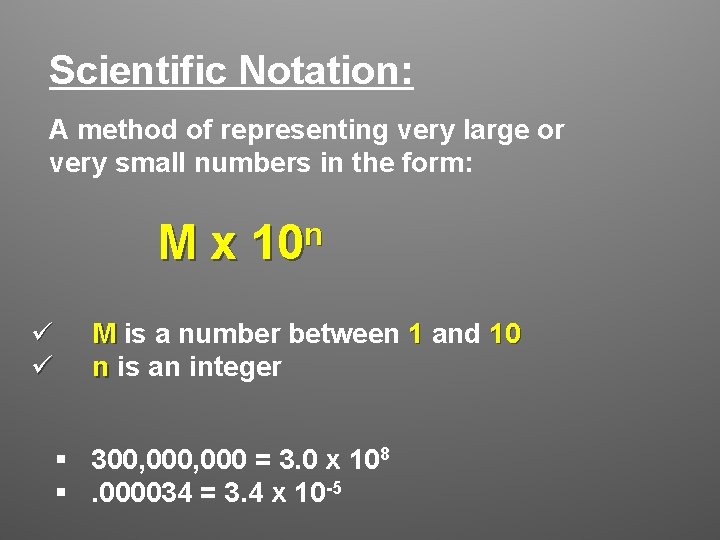
Scientific Notation: A method of representing very large or very small numbers in the form: M x 10 n ü ü M is a number between 1 and 10 n is an integer § 300, 000 = 3. 0 x 108 §. 000034 = 3. 4 x 10 -5
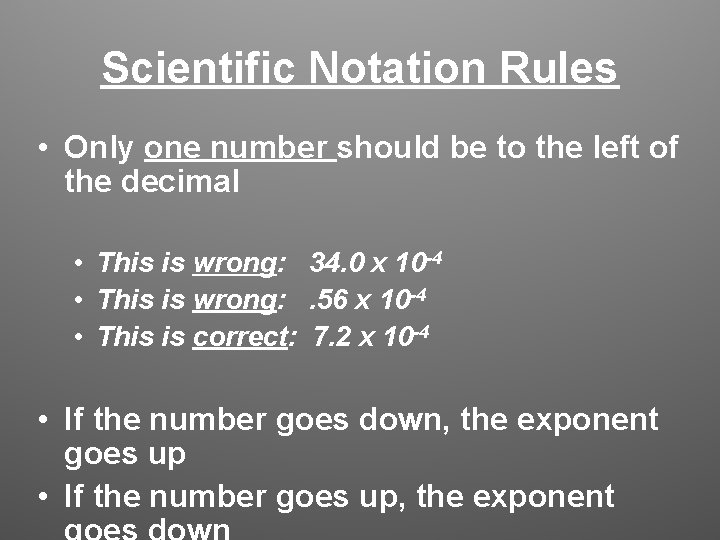
Scientific Notation Rules • Only one number should be to the left of the decimal • This is wrong: 34. 0 x 10 -4 • This is wrong: . 56 x 10 -4 • This is correct: 7. 2 x 10 -4 • If the number goes down, the exponent goes up • If the number goes up, the exponent
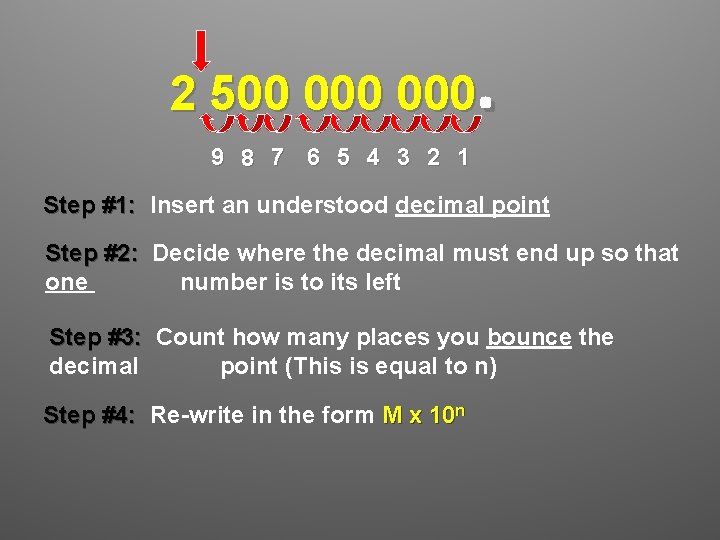
. 2 500 000 9 8 7 6 5 4 3 2 1 Step #1: Insert an understood decimal point Step #2: Decide where the decimal must end up so that one number is to its left Step #3: Count how many places you bounce the decimal point (This is equal to n) Step #4: Re-write in the form M x 10 n
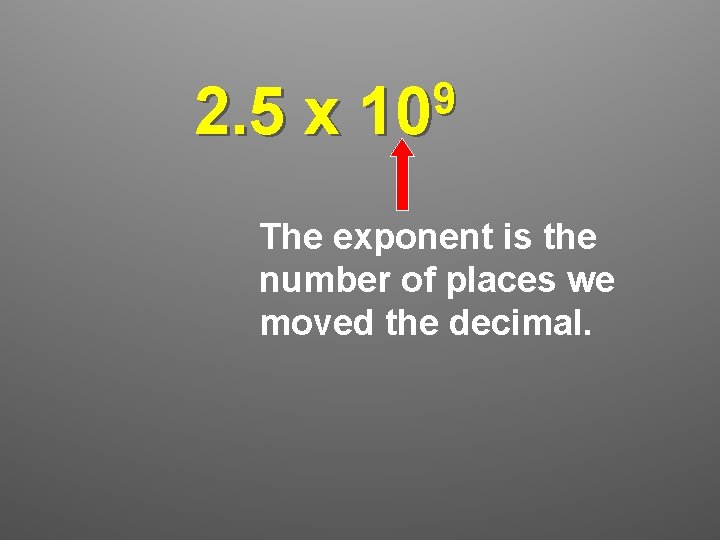
2. 5 x 9 10 The exponent is the number of places we moved the decimal.
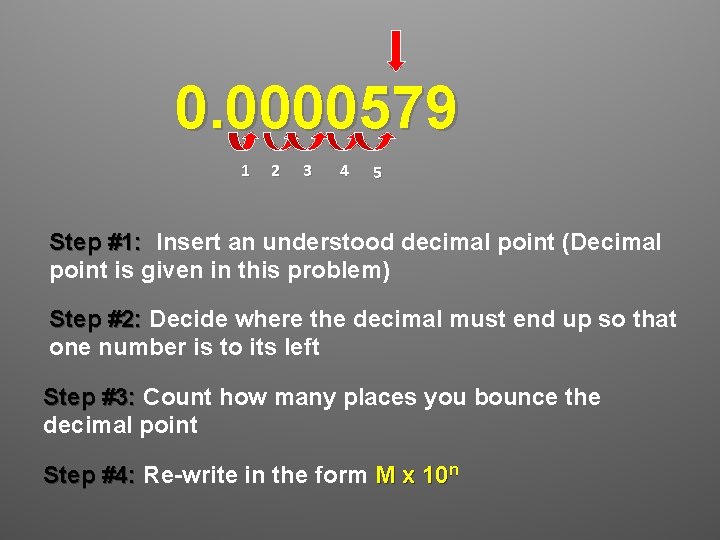
0. 0000579 1 2 3 4 5 Step #1: Insert an understood decimal point (Decimal point is given in this problem) Step #2: Decide where the decimal must end up so that one number is to its left Step #3: Count how many places you bounce the decimal point Step #4: Re-write in the form M x 10 n
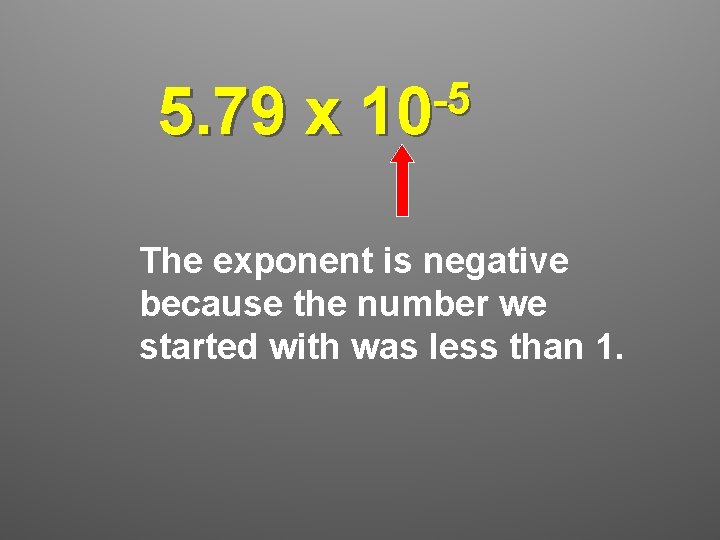
5. 79 x -5 10 The exponent is negative because the number we started with was less than 1.
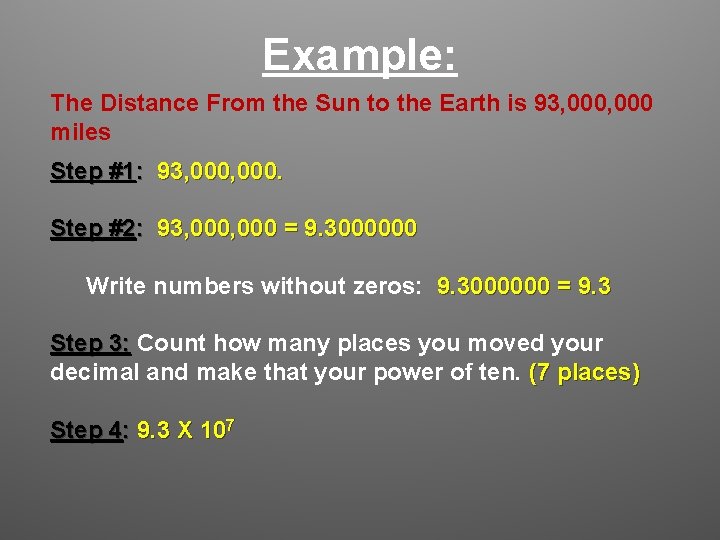
Example: The Distance From the Sun to the Earth is 93, 000 miles Step #1: 93, 000. Step #2: 93, 000 = 9. 3000000 Write numbers without zeros: 9. 3000000 = 9. 3 Step 3: Count how many places you moved your decimal and make that your power of ten. (7 places) Step 4: 9. 3 X 10⁷
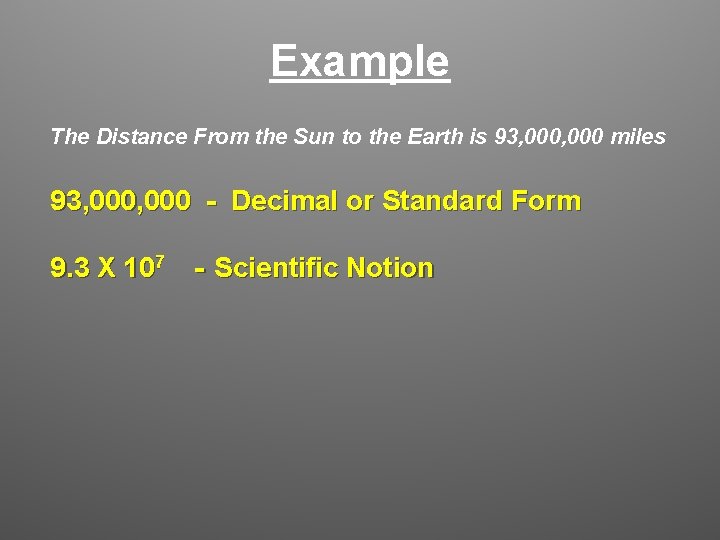
Example The Distance From the Sun to the Earth is 93, 000 miles 93, 000 - Decimal or Standard Form 9. 3 X 10⁷ - Scientific Notion
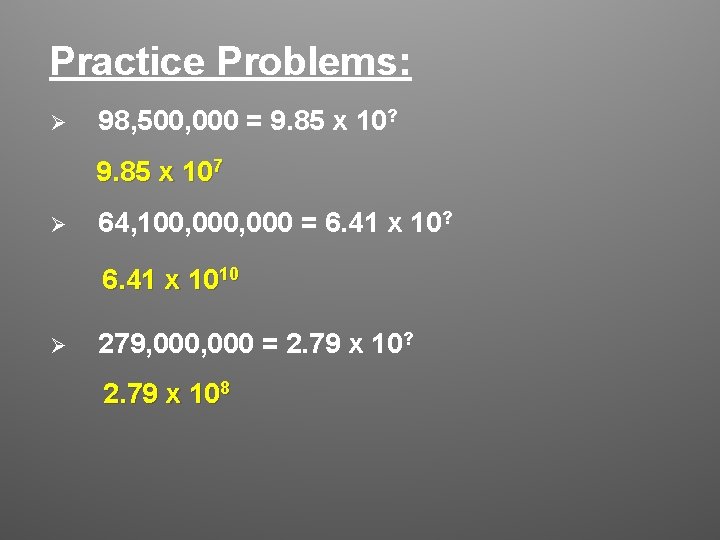
Practice Problems: Ø 98, 500, 000 = 9. 85 x 10? 9. 85 x 107 Ø 64, 100, 000 = 6. 41 x 10? 6. 41 x 1010 Ø 279, 000 = 2. 79 x 10? 2. 79 x 108
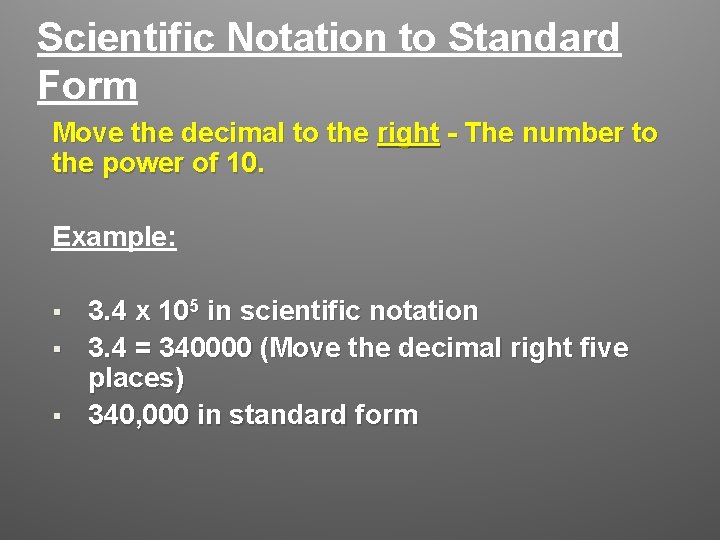
Scientific Notation to Standard Form Move the decimal to the right - The number to the power of 10. Example: § § § 3. 4 x 10⁵ in scientific notation 3. 4 = 340000 (Move the decimal right five places) 340, 000 in standard form
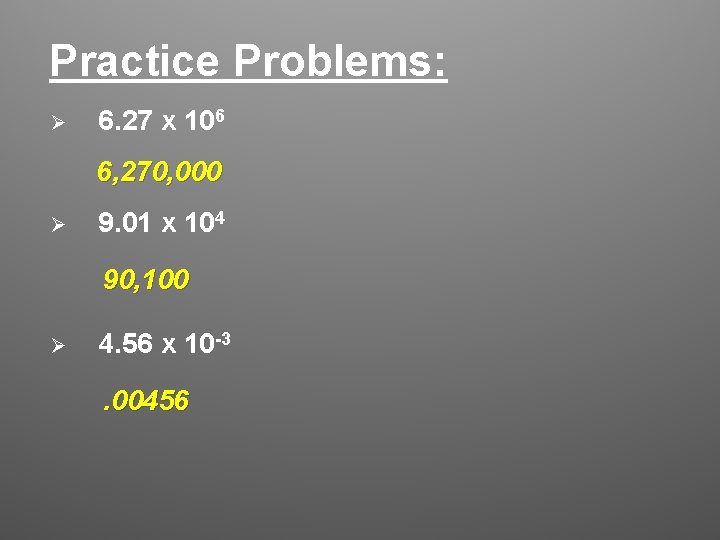
Practice Problems: Ø 6. 27 x 106 6, 270, 000 Ø 9. 01 x 104 90, 100 Ø 4. 56 x 10 -3. 00456
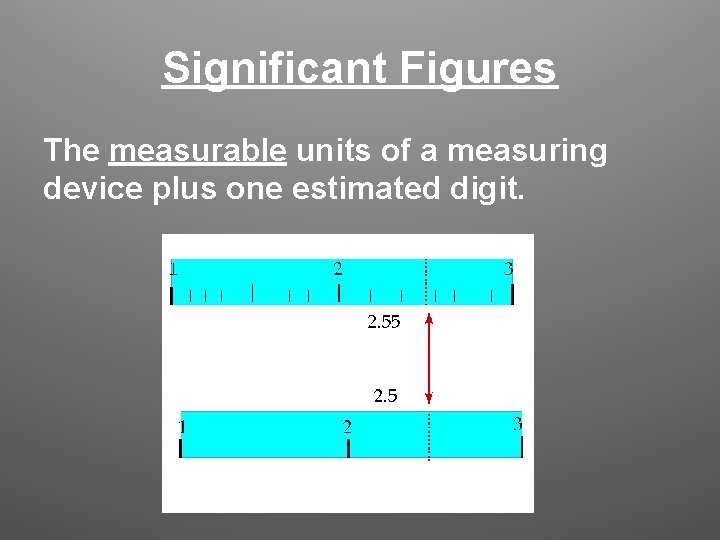
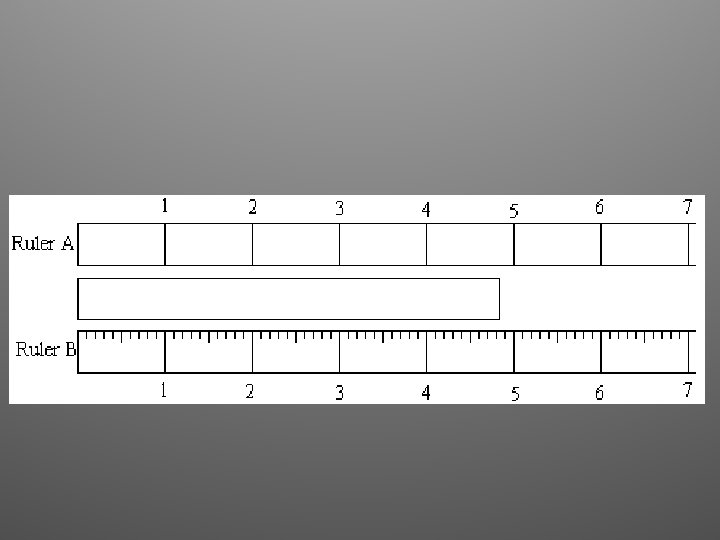
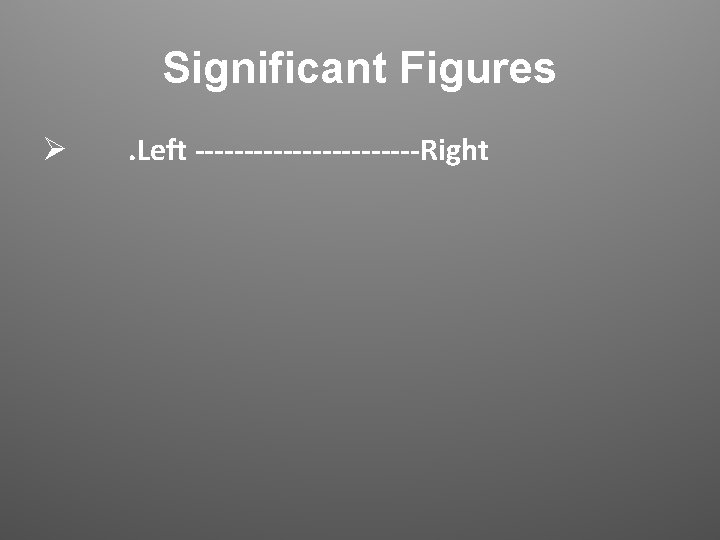
Significant Figures The measurable units of a measuring device plus one estimated digit.
Significant Figures Ø . Left ------------Right
Practice Problems • • • 34. 0078 234000 6700. 100 4000. 00 1. 005
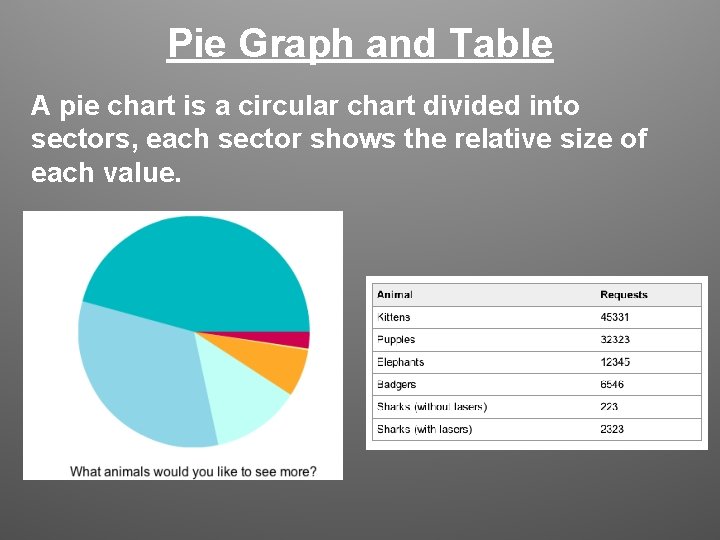
Pie Graph and Table A pie chart is a circular chart divided into sectors, each sector shows the relative size of each value.
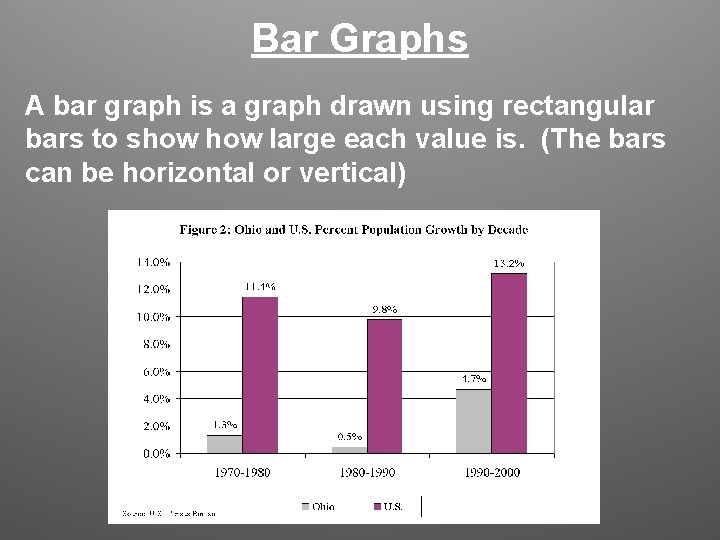
Bar Graphs A bar graph is a graph drawn using rectangular bars to show large each value is. (The bars can be horizontal or vertical)
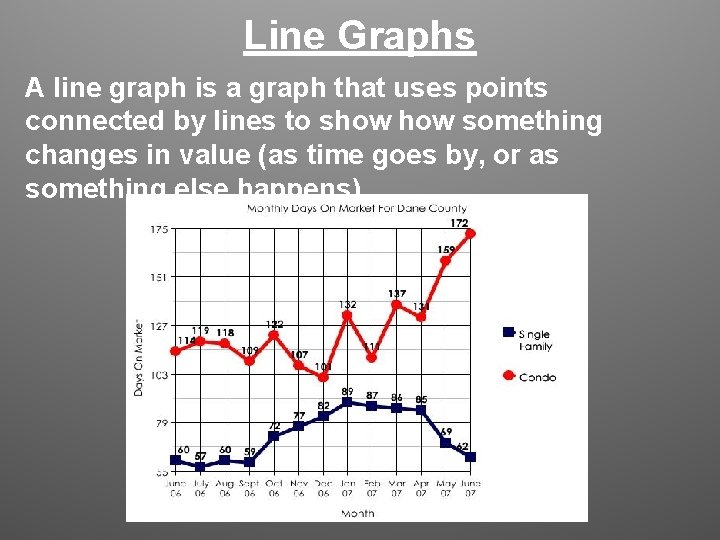
Line Graphs A line graph is a graph that uses points connected by lines to show something changes in value (as time goes by, or as something else happens).