Your Money Life Assess Net Worth Net Worth

 ▪ It is a")

 that")


 net worth in U. S. is")
")


 Name _______ Period ____ ▪ Answer the question on")
- Slides: 19
Your Money Life
Assess Net Worth ▪ Net Worth is (Assets – Liabilities) ▪ It is a financial snapshot of your financial position ▪ From another angle: Net Worth is what you own (that has market value) minus what you owe others
Liabilities ▪ Liabilities are debts, be it credit card, student loans, home loans, auto loans, or a simple IOU with a friend.
Assets ▪ Assets are cash + anything that you own (or partially own) that has value (can sell it – has market value and can be converted into cash)
Net Worth ▪ On the left side of a blank sheet of paper, write down your estimated assets. (Assets are cash + anything that you own (or partially own) that has value (can sell it – market value – converted into cash). ▪ Your assets must be your own assets, not your parents. For instance, do you own your car or do your parents own it? If you were to sell your car, who would get the money? How much do you have in a checking acct? Savings acct? Do you own something of value that you could sell for a decent amount of money? ▪ On the right side of the same paper, write down your estimated liabilities. Liabilities are debts, be it credit card, student loans, home loans, auto loans, or a simple IOU with a friend.
Your Net Worth ▪ Total your assets. Total your liabilities. ▪ Net worth: Assets – Liabilities ▪ Is your net worth positive?
Real Mr. Herdegen ▪ Go to the Excel file called "Real Mr. Herdegen" and guess which one is the real me: #1, #2, or #3
Where are you compared to others in U. S. ? If you have at least x dollars, then you are in the corresponding percentile: $50 12. 45 th Percentile $8, 800 25 th Percentile $31, 300 37. 45 th Percentile $81, 200 50 th Percentile $168, 100 62. 45 th Percentile $317, 300 75 th Percentile $505, 800 82. 45 th Percentile $941, 700 90 th Percentile $1, 871, 800 95 th Percentile Source: Federal Reserve Board Survey of Consumer Finances
U. S. stats to consider ▪ Average (mean) net worth in U. S. is $534, 600. ▪ Median net worth in U. S. is $81, 200 – this is the “middle class”. Source: Federal Reserve Board Survey of Consumer Finances
Debt Profile of the Average American Family Credit Cards (of those with any debt) $15, 799 Average Mortgage Debt $149, 667 Average Student Loan Debt $32, 559 Average Car Loan Debt $13, 125 Source: Federal Reserve, U. S. Census, IRS
Income Mobility ▪ Lots of people focus on spending in terms of being financially wise, but that is only half of the equation! ▪ Households need to make money! ▪ The following is somewhat complex – I’ll summarize it in a few slides
Can you better your parents in terms of income? *If you are born poor, you have a 42% change of staying poor. *If born in the middle, about equal chance to move anywhere *If born rich, about a 53% chance of being middle class
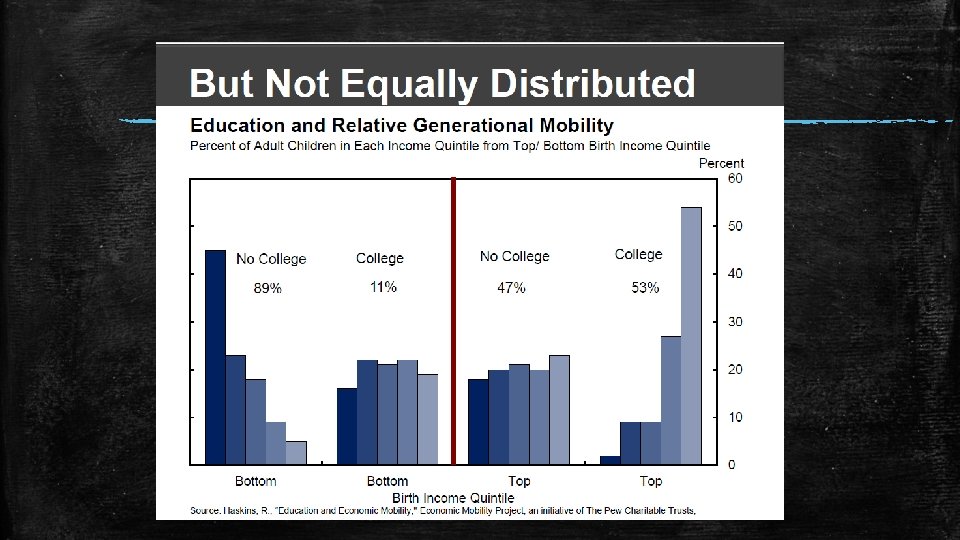
*Born poor, no college have a 43% chance of remaining poor *Born poor, and go to college, equal chance of moving to any quintile *Born rich, go to college, you have a 81% chance of being better than middle-class *Born rich, don’t go to college, equal chance of moving to any quintile
Summary of Charts ▪ Income mobility exists in U. S. and a majority of American’s exceed their parents’ family income. ▪ The American Dream that equality of opportunity exists is paramount to keeping people mobile in terms of income. ▪ Those born at the top and bottom of the income ladder are more likely to stay there. ▪ Education equalizes your birthright – if born poor and go to college, extremely likely to have more income than parents. If born rich and no college, very likely to not remain rich. ▪ Unfortunately, most poor people do not go to college (only 11%)
Financial Goals ▪ Write down two realistic financial goals by the time you are 28 years old. ▪ Write down two realistic financial goals by the time you are 38 years old.
Money ≠ Happiness ▪ Money can’t buy happiness. Most everyone believes this – so do I!! ▪ What does being in a good place financially do for you? – It gives you choices when you are older such as: I can retire earlier, I can travel more, I can give more to others…
Why do so many people stink at money? ▪ Failure to plan is planning to fail. ▪ It is easier to think about today and fulfilling desires now rather than saving. It is human nature to take the easiest path possible. ▪ Being disciplined and good with finances is hard. Most hard things in life are worth it looking back.
Assignment (answer on this slide) Name _______ Period ____ ▪ Answer the question on slide 6: ▪ Which one is the Real Mr. Herdegen? ▪ Put your response to slide 16 here: Consider keeping your financial goals and sharing them with somebody!