LO To assess your understanding of real life


 The Abram family –")
")
 1. How far along the track is")
")
")


- Slides: 12
LO To assess your understanding of real life RAG graphs Key Words: Distance, Speed, Time, Gradient, Convert 23 -Apr-13 Starter Activity Answer the questions about the graph.
Grade G/F E D C B A/A* Real life graphs Plot points from a conversion table onto a graph. Read from a conversion graph e. g. change 50 F to C Interpret horizontal lines on a distance/time graph. Answer simple questions from a distance/time graph, e. g. ‘How far is travelled in first ten minutes? ’ Answer more difficult questions from a distance/time graph. E. g. ‘What is the average speed (km/h) over first 2 hours or ½ hour? ’’ At what stage is she cycling the fastest? ’ Use formulae to calculate; average speed, distance, time, volume, density, mass etc. Give the equation of a line. Interpret complex real life graphs. Use the gradient to calculate average speed at different stages of a journey. Interpret and draw complex real life graphs. My target grade is ____
Key Words Speed Convert Formula Stationary Accelerate Density Volume Mass
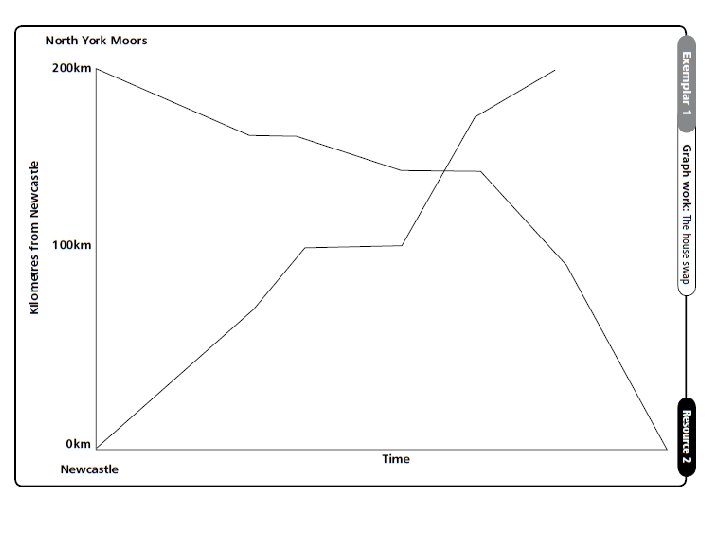
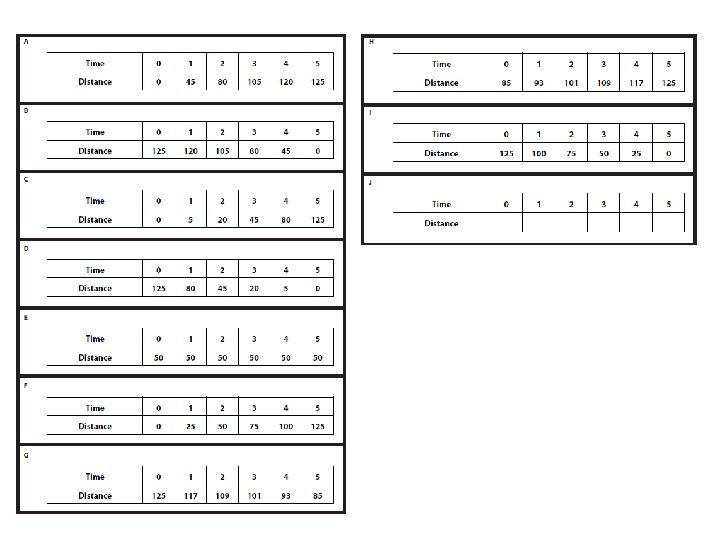
Task One – The House Swap (E/D grade task. ) The Abram family – Mr and Mrs Abram, Peter (8) and Samuel (5) – live in Newcastle while their friends the Browns – Mr and Mrs Brown, Tina (10) and Jordan (3) – live in a small village on the North Yorkshire Moors. They have arranged to swap homes for a weeks break. Both families are looking forward to discovering more about their holiday destination. However the car journey to their holiday is not straightforward. Identify where you think the statements should go on the distance-time graph, which represent their journeys. Tips • Before you begin sort the cards into two piles, ones which refer to the Abram family’s journey and ones which refer to the Brown family’s journey. • Not all of the cards are useful.
Task Two – (D/C grade task. )
Task Two Continued – (D/C grade task) 1. How far along the track is the bend? 2. Complete the tables to show the distance travelled by each car changes with time. 3. What is the average speed each car travels at in the first 5 seconds? 4. What is the average speed each car travels in the last 3 seconds. 5. You must show all your working out. Red Car Time in seconds 1 2 3 4 5 6 7 8 9 10 11 12 Distance in metres Black Car Time in seconds Distance in metres 1 2 3 4 5 6
Task Three – (C/B grade task)
Task Three – (B/A grade task)
Grade A/A* Real Life Graphs Interpret and draw complex real life graphs. B Interpret complex real life graphs. Use the gradient to calculate average speed at different stages of a journey. C Use formulae to calculate; average speed, distance, time, volume, density, mass etc. Give the equation of a line. D Answer more difficult questions from a distance/time graph. E. g. ‘What is the average speed (km/h) over first 2 hours or ½ hour? ’’ At what stage is she cycling the fastest? ’ E Interpret horizontal lines on a distance/time graph. Answer simple questions from a distance/time graph, e. g. ‘How far is travelled in first ten minutes? ’ Hints / tips
My teachers question is. . . My teachers comment. . . My answer is. . .