Wetlands Assessment Virginia Engle USEPA National Water Quality


- Slides: 22
Wetlands Assessment • Virginia Engle, USEPA • National Water Quality Monitoring Council • March 20, 2007
Surveys of the Nation’s Waters • Statistically valid surveys – history § National Coastal Assessment 2000 -2006 § Wadeable Streams Assessment 2004 -2005 • Survey Schedule 2007 – Lakes 2008 – Rivers 2009 – Streams 2010 - Coastal 2011 - Wetlands 2012 – Lakes • EPA Office of Water § Implement through state § 106 Grants
Survey of the Nation’s Lakes • What percent of the Nation’s lakes are in good, fair, and poor condition for key indicators of trophic state, ecological health, and recreation? • What is the relative importance of key stressors such as nutrients and pathogens? • • Lakes > 10 acres and ≥ 1 m 5 size classes in 48 states 909 lakes Indicators § Trophic (water quality) § Ecological Integrity • Biota • Habitat § Recreational (pathogens)
National Wetlands Condition Assessment • EPA will collaborate with State and Tribal partners to refine three objectives of the National Wetlands Condition Assessment: 1. Produce a national report that describes the quality of the nation’s wetlands, 2. Build State and Tribal capacity to implement wetland monitoring and assessment programs that will guide policy development and aid project decision-making, 3. Advance the science needed to achieve Obj. #2.
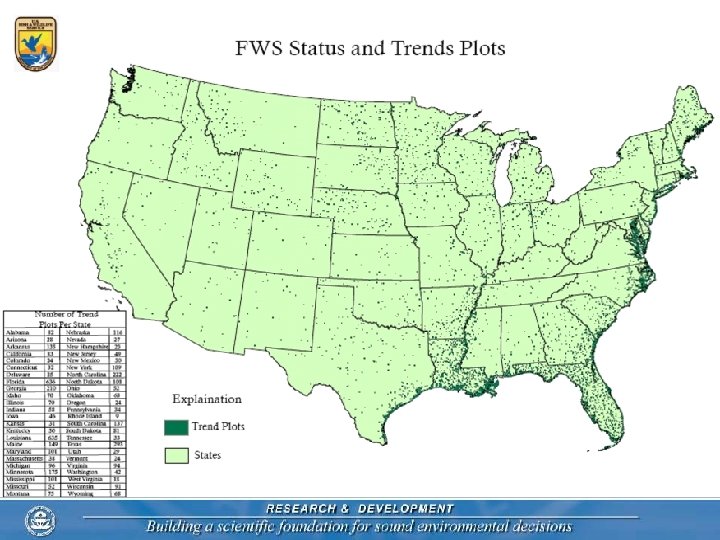
Collaboration with FWS • EPA will collaborate with FWS in designing NWCA § ensure the national condition assessment most effectively complements the Service’s Wetlands Status and Trends Study. • NWI Status and Trends documents trends in wetlands acreage • NWCA will evaluate the ambient condition of the nation’s wetlands resources. • Together these reports will offer the most comprehensive ecological evaluation of the nation’s wetlands to date and provide valuable information to support policy and resource management decisions.
National Wetlands Monitoring & Assessment Workgoup State/Tribal Program Implementation Team o Monthly Meetings o EPA and State/Tribal Reps • Building State Program Capacity • Wetlands Mapping • Regulatory Support and Methods Development Communications with Other States/Tribes Assessment Advisory Team o Meetings TBD o EPA, State/Tribal, Federal Reps • Responsive to EMAP Team and OWOW • Input on specific issues related to the national condition assessment Steering Committee o Meetings as needed o EPA HQ and Regions
NWMAWG • States/Tribes/EPA • Build state and tribal wetland monitoring programs § § Foster information exchange and technology transfer Data management and comparability Improve wetlands mapping Sustainable financing • Promote use of wetland assessment data to inform decision-making § § Wetlands restoration in a watershed context Compensatory mitigation performance standards Inform CWA 401 certification decisions Wetlands-specific water quality standards
EMAP Wetlands Team • Provide technical guidance to NWMAWG for National Wetlands Condition Assessment § § Develop Sample Frame Recommend Survey Design Options Recommend Indicators & Methods Assist with data mgmt, analysis, and reporting • Members § EPA ORD and OW § USGS, USFWS
Progress to Date National Wetlands Condition Assessment • Target Population § All wetlands of the U. S. – tidal and non-tidal wetted areas with rooted vegetation • Sample Frame § NWI S&T sample plots (4682 2 x 2 sq. mi. plots), supplemented with new plots in the Pacific coast, including only polygons classified as follows:
Wetland Classes in NWCA • • • M 2 – Marine Intertidal E 2 EM – Estuarine Intertidal Emergents E 2 SS – Estuarine Intertidal Forested/Shrub E 2 AB – Estuarine Intertidal Aquatic Bed PFO – Palustrine Forested PSS – Palustrine Scrub/Shrub PEM – Palustrine Emergents PAB – Palustrine Aquatic Bed ? Pf – Palustrine farmed
Regional Pilots Wetlands Project Partners Mid-Atlantic States Regional Wetlands Assessment EPA Region 3 & ORD Penn State, VIMS Southeast Isolated Wetlands Assessment EPA Region 4 & ORD, RTI, NC DWQ, SC OCRM, USC, OSU Minnesota Statewide Wetland Assessment EPA ORD, MN PCA California Estuarine Wetland Survey EPA ORD, SCCWRP, MLML, CCC, SFEI Gulf of Mexico Coastal Wetlands Survey EPA ORD Gulf Breeze USGS NWRC
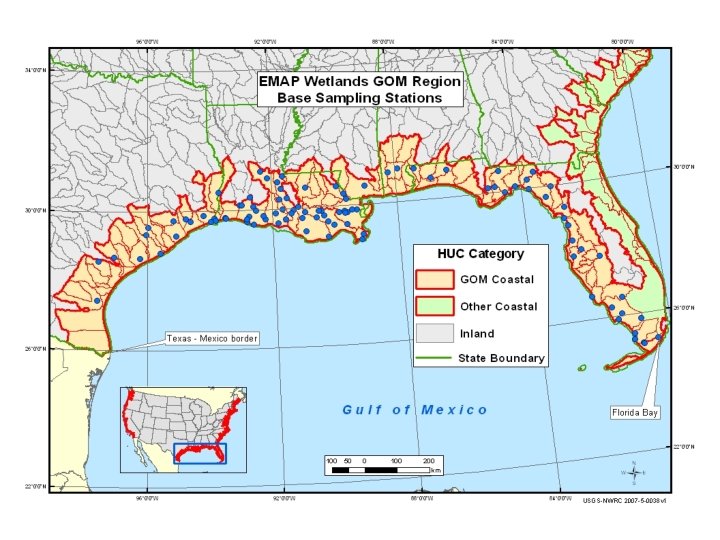
GOM Coastal Wetlands Pilot Survey • Objectives § Evaluate feasibility of implementing probability survey design on regional scale § Evaluate feasibility of indicators across multiple wetland types § Assess condition of GOM coastal wetlands
Progress to Date • Target Population § All wetlands within GOM coastal boundary defined as all 8 -digit HUCs that touch the coast, modified by NOAA EDAs where needed • Sample Frame § All NWI S&T plots within GOM coastal boundary, including the following wetland classes • Estuarine Intertidal Emergents & Forested/Shrub • Palustrine Emergents, Shrub, Forested & Farmed
Design Options Simple Random Sample Unequal Probability Sample Class % Area # Sites E 2 EM 27. 8 23 E 2 EM 28. 9 17 E 2 SS 5. 3 6 E 2 SS 5. 5 16 E 2 US 3. 8 4 PEM 15. 0 17 PEM 14. 4 13 PFO 33. 1 17 PFO 31. 8 32 PSS 7. 6 16 PSS 7. 3 8 Pf 9. 9 17 PUS 0. 1 0 Total 100 Pf 9. 5 14 Total 100
NWI S&T Class - Estuarine Intertidal Emergent
NWI S&T Class - Estuarine Intertidal Shrub/Forested
NWI S&T Class – Palustrine Forested
Assessment Levels • Level 1 – Landscape Assessment § GIS, remote sensing § Wetland coverage, land use • Level 2 – Rapid Assessment § On-site field survey - visual § Scores, metrics • Level 3 – Intensive Assessment § On-site sample collection § Vegetation, water, soils Application of Elements of a State Water Monitoring and Assessment Program For Wetlands http: //www. epa. gov/owow/wetlands/monitor/#elements
NMN & Wetlands • NMN design – wetlands deferred • Recognized importance of assessing wetland quality, not just extent • Few states monitor wetland quality but methods are evolving • Plan to add surveys of wetland quality to NMN
Questions? For more information, contact: engle. virginia@epa. gov scozzafava. michaele@epa. gov