Week at a Glance Mar 29 April 2


 is designed to give parents a")


 a) I can solve real-world and mathematical")
 • • I can recognize that generalizations")
 • • I can recognize that generalizations")
 • • I can recognize that generalizations")
 • • • I can solve")
")


- Slides: 38
Week at a Glance Mar 29 – April 2, 2021 Ms. Jenkins 7 th Grade Math
Dear Parents, This week at a glance (WAG) is designed to give parents a brief idea of what their child is learning at school. It will have the subject standards (Georgia Standards of Excellence), the main topics covered, and some sample problems with links to videos and worksheets. We encourage parents and students to review this presentation together and to stay informed on the weekly learning objectives. *** students can earn extra credit if they copy or print the sample problems or worksheets and show the teacher. If the worksheet or PDF has several pages (5 or more), you don’t have to print every page. Print at your own discretion.
se Rea d! Failure is not an option! Ple a Grade Recovery Students who failed any subject for 3 rd nine weeks will have the opportunity to complete grade recovery via Edgenuity in ALL core subjects and ALL connection classes too. Deadline April 27, 2021. a) Report Cards went home on 3/22/2021. b) Summer Enrichment: June 7 -24, 2021 The grade recovery paper must have a teacher and parent signature. In order to prepare students for success, in addition to homework, students are required to complete at least 100 minutes of i-Ready Math at home each week.
Math Help If your child is struggling with Math you may want to consider these apps photomath Quick Maths Middle School Math HD Math Practice Math Tango Math vs Zombies
3/29/2021 Standard: Geometry: (G 3, G 6) a) I can solve real-world and mathematical problems involving area of two-dimensional objects composed of triangles, quadrilaterals, and polygons. b) I can solve real-world and mathematical problems involving surface area of three dimensional objects composed of cubes and right prisms. c) I can solve real-world and mathematical problems involving volume of three dimensional objects composed of cubes and right prisms. Topic: Unit 4: Geometry Posttest Number Talk: N/A Warm Up: Opening: N/A Work Period: Students will complete Unit 4 Posttest. Early finishers will complete Edpuzzle and/or USA Test. Prep Assignments. Students may also complete i. Ready. . Closing: N/A Homework: N/A Vocabulary: LOTS: Adjacent Angle • Circumference • Complementary Angle • Congruent • Cross- section • Irregular Polygon • Parallel Lines • Pi • Regular Polygon • Supplementary Angle • Vertical Angles
3/30/2021 Standard: Inferences: (SP 1, SP 2) • • I can recognize that generalizations about a population from a sample are valid only if the sample is representative of that population. *I can apply statistics to gain information about a population from a sample of the population. *I can generalize that random sampling tends to produce representative samples and support valid inferences. I can identify an appropriate sample size I can analyze and interpret data from a random sample to draw inferences about a population with an unknown characteristic of interest. I can generate multiple samples (or simulated samples) of the same size to determine the variation in estimates or predictions by comparing and contrasting the samples. Topic: Math Lab: Inferences: Making Predictions Number Talk: a) b) c) Warm Up: Converting fractions, decimals, percent interchangeably. Opening: RATA Standard/EQ/Lesson Highlight Work Period: Interactive Power. Point on Making Predictions. Complete “ (I do, We do) Got It Activity pgs 543 -545 #a-c Closing: Lesson Quiz: Guided Practice Pg 546 #1 -6 (You do) Share out whole group Homework: Independence Practice pg 547 Vocabulary: LOTS: Box and Whisker Plot • Frequency • Grouped Frequency Table • Histogram • Inter-Quartile Range (IQR) • Maximum Value • Mean Absolute Deviation • Measures of Center • Measures of Spread • Median • Minimum Value • Mode • Mutually Exclusive • Outlier • Range • Sample • Random Sampling • Stem and Leaf Plot
3/31/2021 Standard: Inferences: (SP 1, SP 2) • • I can recognize that generalizations about a population from a sample are valid only if the sample is representative of that population. *I can apply statistics to gain information about a population from a sample of the population. *I can generalize that random sampling tends to produce representative samples and support valid inferences. I can identify an appropriate sample size I can analyze and interpret data from a random sample to draw inferences about a population with an unknown characteristic of interest. I can generate multiple samples (or simulated samples) of the same size to determine the variation in estimates or predictions by comparing and contrasting the samples. Topic: Inferences: Biased and Unbiased Samples Number Talk: RP 2/G 1 Review: a) b) c) Warm Up: Georgia Practice and Common Core Review pg 550 #19 -26 Opening: Standard/EQ Review/Review Homework Review Work Period: Interactive Power. Point Samples: (I do, We do) Got It Activity pgs 552554 Closing: Lesson Quiz: Guided Practice Pg 554 #1 -3 (You do) Share out whole group Homework: Independent Practice pg 555 #1 -4 Vocabulary: LOTS: Box and Whisker Plot • Frequency • Grouped Frequency Table • Histogram • Inter-Quartile Range (IQR) • Maximum Value • Mean Absolute Deviation • Measures of Center • Measures of Spread • Median • Minimum Value • Mode • Mutually Exclusive • Outlier • Range • Sample • Random Sampling • Stem and Leaf Plot
4/1/2021 Standard: Inferences: (SP 1, SP 2) • • I can recognize that generalizations about a population from a sample are valid only if the sample is representative of that population. *I can apply statistics to gain information about a population from a sample of the population. *I can generalize that random sampling tends to produce representative samples and support valid inferences. I can identify an appropriate sample size I can analyze and interpret data from a random sample to draw inferences about a population with an unknown characteristic of interest. I can generate multiple samples (or simulated samples) of the same size to determine the variation in estimates or predictions by comparing and contrasting the samples. Topic: Inferences Number Talk: RP 2/G 1) a) b) c) Warm Up: n/a Opening: RATA Standard/EQ, Homework Review Work Period: Students will complete Real World Problem Solving Worksheet Involving Inferences. Closing: N/A Homework: Enjoy Spring Break! Vocabulary: LOTS: Box and Whisker Plot • Frequency • Grouped Frequency Table • Histogram • Inter-Quartile Range (IQR) • Maximum Value • Mean Absolute Deviation • Measures of Center • Measures of Spread • Median • Minimum Value • Mode • Mutually Exclusive • Outlier • Range • Sample • Random Sampling • Stem and Leaf Plot
4/2/2021 3/26/2021 Standard: Geometry: (G 1 -G 6) • • • I can solve real-world and mathematical problems involving area of two-dimensional objects composed of triangles, quadrilaterals, and polygons. I can solve real-world and mathematical problems involving surface area of three dimensional objects composed of cubes and right prisms. I can solve real-world and mathematical problems involving volume of three dimensional objects composed of cubes and right prisms. Topic: Weekly Assessment/Math Lab Warm Up: N/A Opening: Homework Review/Q&A Work Period: Unit 4 Post Test/Early Finishers-i. Ready/Edpuzzle/USA Test. Prep Closing: N/A Homework: Have the Best Weekend Ever Vocabulary: LOTS: Box and Whisker Plot • Frequency • Grouped Frequency Table • Histogram • Inter-Quartile Range (IQR) • Maximum Value • Mean Absolute Deviation • Measures of Center • Measures of Spread • Median • Minimum Value • Mode • Mutually Exclusive • Outlier • Range • Sample • Random Sampling • Stem and Leaf Plot April 2 – April 12,
Textbook Correlation GO Math Teacher and Student Pages Aligned by Standards (SE=Student Edition)
Unit 5: Inferences
Unit 5: I Can Statement… What students should be able to do…
Unit 5: I Can Statement… What students should be able to do…
Unit 5: Vocabulary Sample: A part of the population that we actually examine in order to gather information. Simple Random Sample: members of the population chosen in such a way that every set of individuals has an equal chance to be a part of the sample actually selected. Poor sampling methods, that are not random and do not represent the population well, can lead to misleading conclusions. Convenience Sample: A sample that is chosen because it is easy. For example, if you wanted to find out the percentage of students who ate the school lunch, and you just asked those people at your table if they ate the school lunch, then you would have a convenience sample. voluntary-response sample: A sample you get when you ask for volunteers. For example, if you had a survey on the internet, then those who answered would do so voluntarily. Biased Sample: A sample that does not accurately represent the population. Biased samples can give inaccurate results. For example, if you wanted to know the percentage of students at your school who recycle, sampling from the ecology club would result in a biased sample.
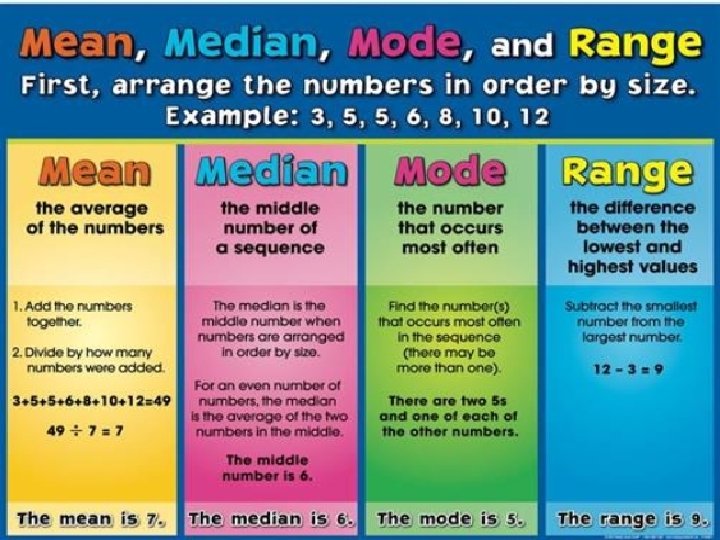
Unit 5: Vocabulary http: //www. youtube. com/watch? v=uydz. T_ Wi. Rz 4 Measures of Center: The mean and the median are both ways to measure the center for a set of data. Mean: The “average” or “fair share” value for the data. The mean is also the balance point of the corresponding data distribution. Measures of Spread: The range and the mean absolute deviation are both common ways to measure the spread for a set of data. Mean Absolute Deviation: the average distance of each data value from the mean. The MAD is a gauge of “on average” how different the data values are from the mean value. Median: The value for which half the numbers are larger and half are smaller. If there are two middle numbers, the median is the arithmetic mean of the two middle numbers. Note: The median is a good choice to represent the center of a distribution when the distribution is skewed or outliers are present.
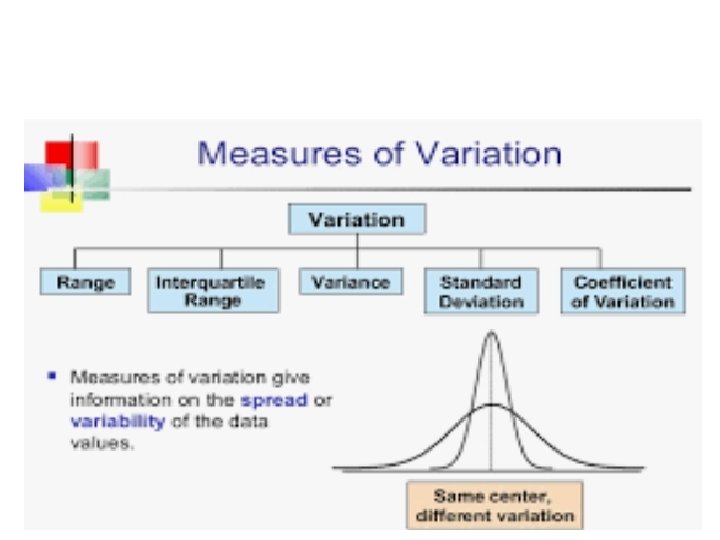
Unit 5: Vocabulary Minimum value: The smallest value in a set of data. Maximum value: The largest value in a set of data. Range: A measure of spread for a set of data. To find the range, subtract the smallest value from the largest value in a set of data. Inter-Quartile Range (IQR): The difference between the first and third quartiles. (Note that the first quartile and third quartiles are sometimes called upper and lower quartiles. ) Box and Whiskers Plot: diagram that summarizes data using the median, the upper and lowers quartiles, and the extreme values (minimum and maximum). Box and whisker plots are also known as box plots. It is constructed from the five-number summary of the data: Minimum, Q 1 (lower quartile), Q 2 (median), Q 3 (upper quartile), Maximum.
Unit 5: Vocabulary Stem & Leaf Plot: A graphical method used to represent ordered, numerical data. Once the data are ordered, the stem and leaves are determined. Typically the stem is all but the last digit of each data point and the leaf is that last digit. . Outlier: A value that is very far away from most of the values in a data set. Mode: The number that occurs the most often in a list. There can be more than one mode, or no mode. Mutually Exclusive: two events are mutually exclusive if they cannot occur at the same time (i. e. , they have not outcomes in common).
Unit 5: Vocabulary Frequency: the number of times an item, number, or event occurs in a set of data Grouped Frequency Table: The organization of raw data in table form with classes (groups) and frequencies. Histogram: A bar graph representing frequency distribution for certain ranges or intervals.
Arts Integration Thinking Maps
Arts Integration Thinking Maps
Arts Integration Thinking Maps
Arts Integration Thinking Maps
Theoretical vs Experimental
Graphical Displays
Graphical Displays
Measures of Center
Range vs Interquartile Range
Unit 5 Videos
Kuta. Software Videos with Worksheet Volume of Prisms and Cylinders Video 1 Link: https: //www. youtube. com/watch? v=It. M 14 i 4 uz. Eo Video 1 Link: https: //www. youtube. com/watch? v=s 3 Q__I 0 Zegg Worksheet Link: https: //cdn. kutasoftware. com/Worksheets/Geo/10 Volume%20 of%20 Prisms%20 and%20 Cylinders. pdf
Kuta. Software Videos with Worksheet Volume of Pyramids and Cones Video 1 Link: https: //www. youtube. com/watch? v=PYr. TYri 1 RKQ Video 2 Link: https: //www. youtube. com/watch? v=3 te. DJUGp. RAk Worksheet Link: https: //cdn. kutasoftware. com/Worksheets/Geo/10 Volume%20 of%20 Pyramids%20 and%20 Cones. pdf
Kuta. Software Videos with Worksheet Surface Area of Prisms and Cylinders Video 1 Link: https: //www. youtube. com/watch? v=s-q. AG 6 u. YF 2 Y Video 2 Link: https: //www. youtube. com/watch? v=8 sq. X 7 v. J 6 g. RU Worksheet Link: https: //cdn. kutasoftware. com/Worksheets/Geo/10 Surface%20 Area%20 of%20 Prisms%20 and%20 Cylind ers. pdf
Math Resources