Using PlatformSpecific Performance Counters for Dynamic Compilation Florian
- Slides: 25
Using Platform-Specific Performance Counters for Dynamic Compilation Florian Schneider and Thomas Gross ETH Zurich Oct 2005 1
Introduction & Motivation • Dynamic compilers common execution platform for OO languages (Java, C#) • Properties of OO programs difficult to analyze at compile-time • JIT compiler can immediately use information obtained at run-time Oct 2005 2
Introduction & Motivation Types of information: 1. Profiles: e. g. execution frequency of methods / basic blocks 2. Hardware-specific properties: cache misses, TLB misses, branch prediction failures Oct 2005 3
Outline 1. 2. 3. 4. 5. 6. Introduction Requirements Related work Implementation Results Conclusions Oct 2005 4
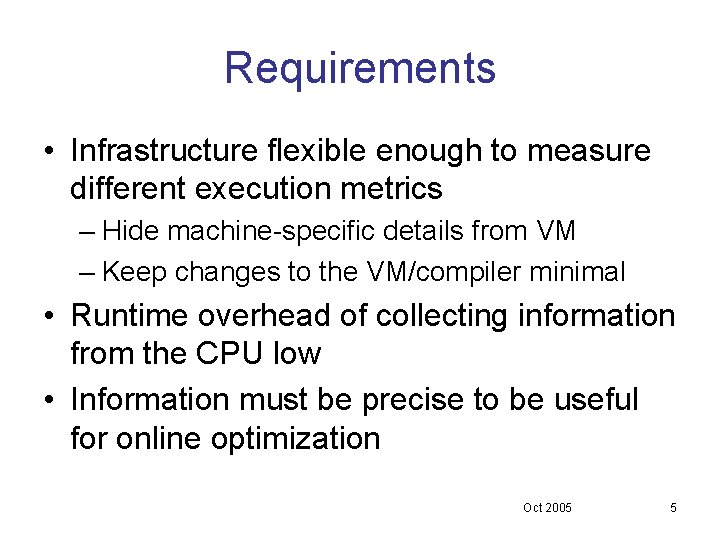
Requirements • Infrastructure flexible enough to measure different execution metrics – Hide machine-specific details from VM – Keep changes to the VM/compiler minimal • Runtime overhead of collecting information from the CPU low • Information must be precise to be useful for online optimization Oct 2005 5
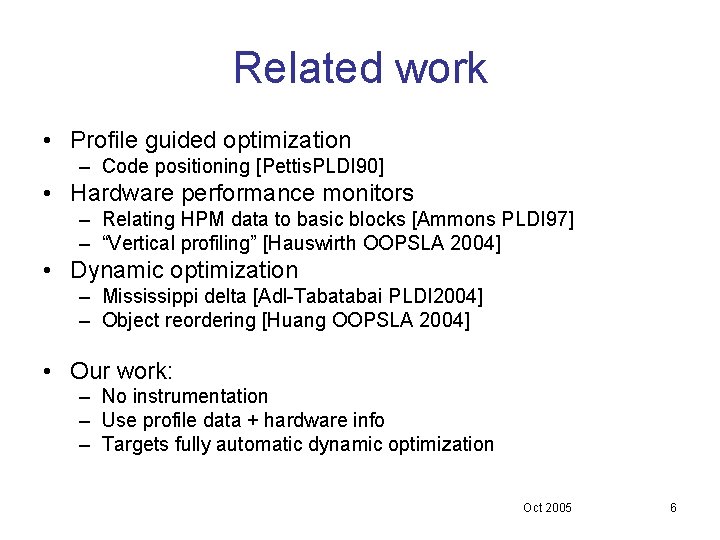
Related work • Profile guided optimization – Code positioning [Pettis. PLDI 90] • Hardware performance monitors – Relating HPM data to basic blocks [Ammons PLDI 97] – “Vertical profiling” [Hauswirth OOPSLA 2004] • Dynamic optimization – Mississippi delta [Adl-Tabatabai PLDI 2004] – Object reordering [Huang OOPSLA 2004] • Our work: – No instrumentation – Use profile data + hardware info – Targets fully automatic dynamic optimization Oct 2005 6
Hardware performance monitors • Sampling-based counting – CPU reports state every n events – Precision platform-dependent (pipelines, outof-order execution) • Sampling provides method, basic block, or instruction-level information – Newer CPUs support precise sampling (e. g. P 4, Itanium) Oct 2005 7
Hardware performance monitors • Way to localize performance bottlenecks – Sampling interval determines how fine-grained the information is • Smaller sampling interval more data – Trade-off: precision vs. runtime overhead – Need enough samples for a representative picture of the program behavior Oct 2005 8
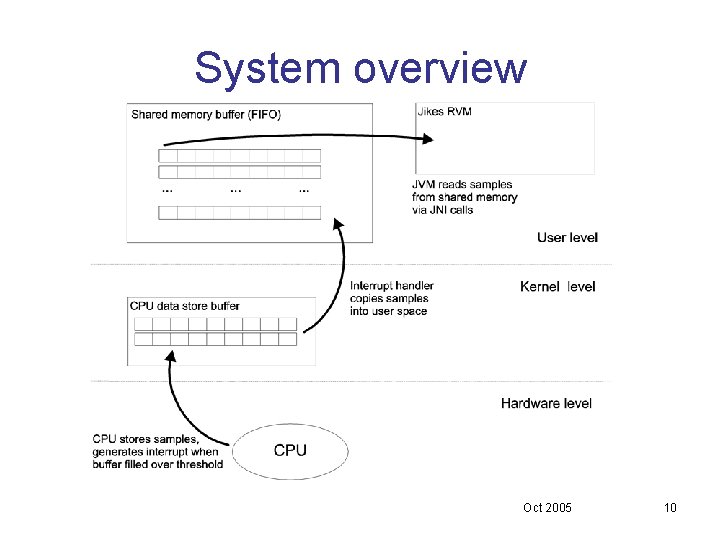
Implementation Main parts 1. Kernel module: low level access to hardware, per process counting 2. User-space library: hides kernel & device driver details from VM 3. Java VM thread: collects samples periodically, maps samples to Java code – Implemented on top of Jikes RVM Oct 2005 9
System overview Oct 2005 10
Implementation • Supported events: – L 1 and L 2 cache misses – DTLB misses – Branch prediction • Parameters of the monitoring module: – Buffer size (fixed) – Polling interval (fixed) – Sampling interval (adaptive) • Keep runtime overhead constant by changing interval during run-time automatically Oct 2005 11
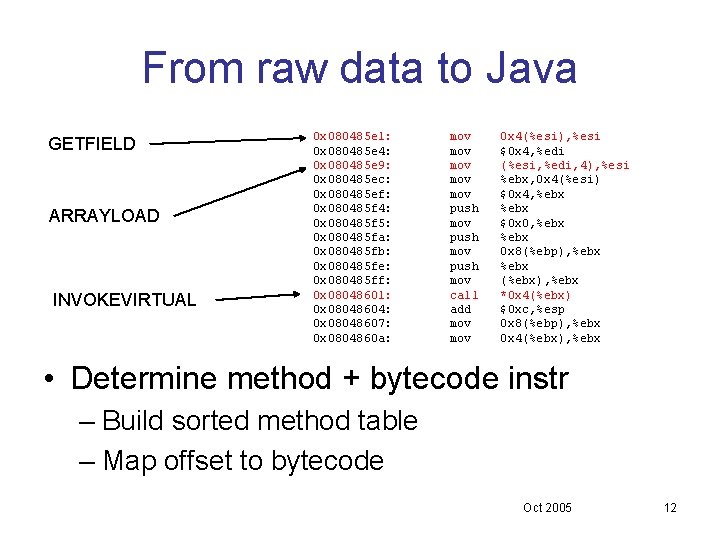
From raw data to Java GETFIELD ARRAYLOAD INVOKEVIRTUAL 0 x 080485 e 1: 0 x 080485 e 4: 0 x 080485 e 9: 0 x 080485 ec: 0 x 080485 ef: 0 x 080485 f 4: 0 x 080485 f 5: 0 x 080485 fa: 0 x 080485 fb: 0 x 080485 fe: 0 x 080485 ff: 0 x 08048601: 0 x 08048604: 0 x 08048607: 0 x 0804860 a: mov mov mov push mov call add mov 0 x 4(%esi), %esi $0 x 4, %edi (%esi, %edi, 4), %esi %ebx, 0 x 4(%esi) $0 x 4, %ebx $0 x 0, %ebx 0 x 8(%ebp), %ebx (%ebx), %ebx *0 x 4(%ebx) $0 xc, %esp 0 x 8(%ebp), %ebx 0 x 4(%ebx), %ebx • Determine method + bytecode instr – Build sorted method table – Map offset to bytecode Oct 2005 12
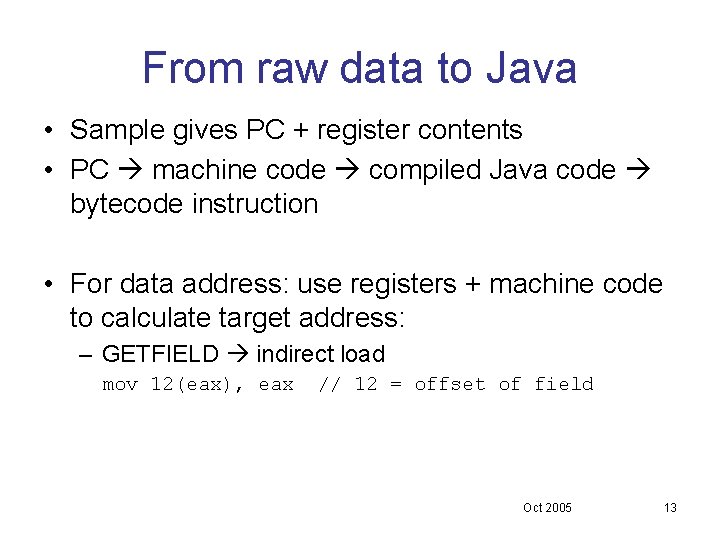
From raw data to Java • Sample gives PC + register contents • PC machine code compiled Java code bytecode instruction • For data address: use registers + machine code to calculate target address: – GETFIELD indirect load mov 12(eax), eax // 12 = offset of field Oct 2005 13
Engineering issues • Lookup of PC to get method / BC instr must be efficient – Done in parallel with user program – Use binary search / hash table – Update at recompilation, GC • Identify 100% of instructions (PCs): – Include samples from application, VM, and library code – Dealing with native parts Oct 2005 14
Infrastructure • Jikes RVM 2. 3. 5 on Linux 2. 4 kernel as runtime platform • Pentium 4, 3 GHz, 1 G RAM, 1 M L 2 cache • Measured data show: – Runtime overhead – Extraction of meaningful information Oct 2005 15
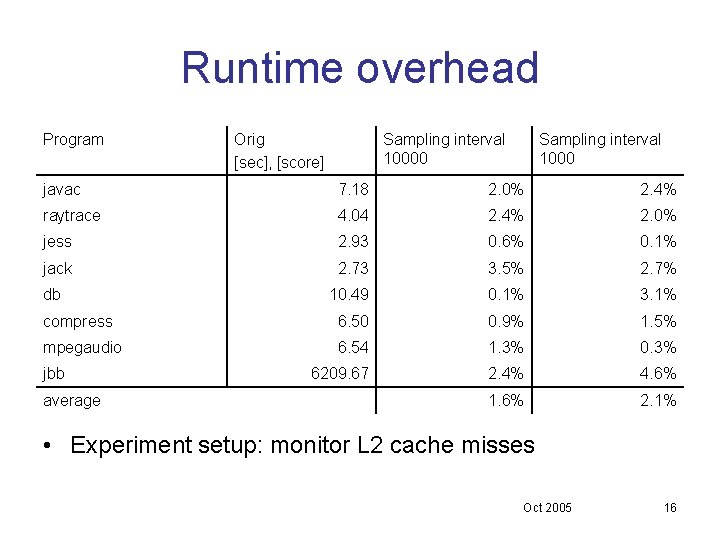
Runtime overhead Program Orig [sec], [score] Sampling interval 10000 Sampling interval 1000 javac 7. 18 2. 0% 2. 4% raytrace 4. 04 2. 4% 2. 0% jess 2. 93 0. 6% 0. 1% jack 2. 73 3. 5% 2. 7% 10. 49 0. 1% 3. 1% compress 6. 50 0. 9% 1. 5% mpegaudio 6. 54 1. 3% 0. 3% 6209. 67 2. 4% 4. 6% 1. 6% 2. 1% db jbb average • Experiment setup: monitor L 2 cache misses Oct 2005 16
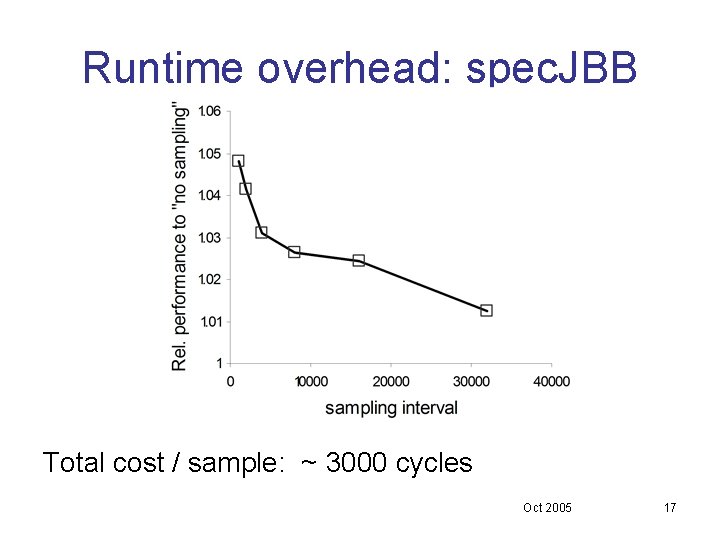
Runtime overhead: spec. JBB Total cost / sample: ~ 3000 cycles Oct 2005 17
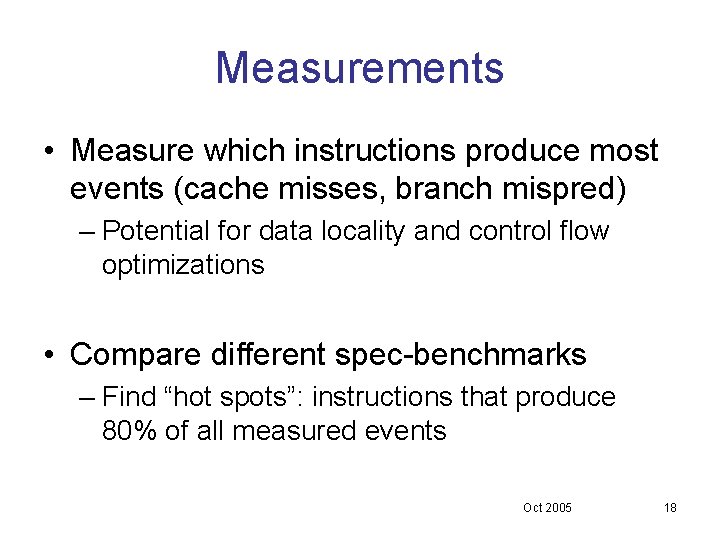
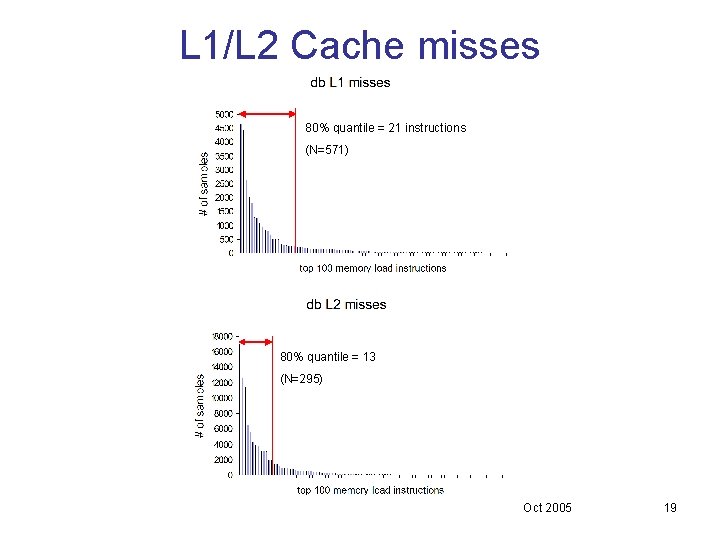
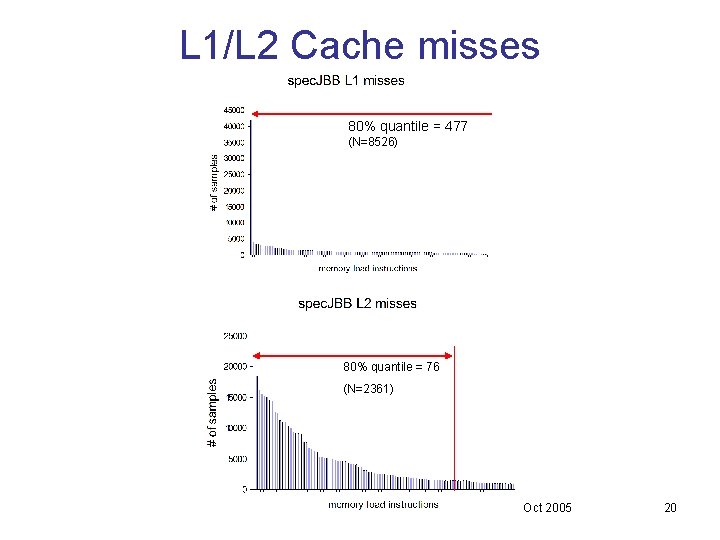
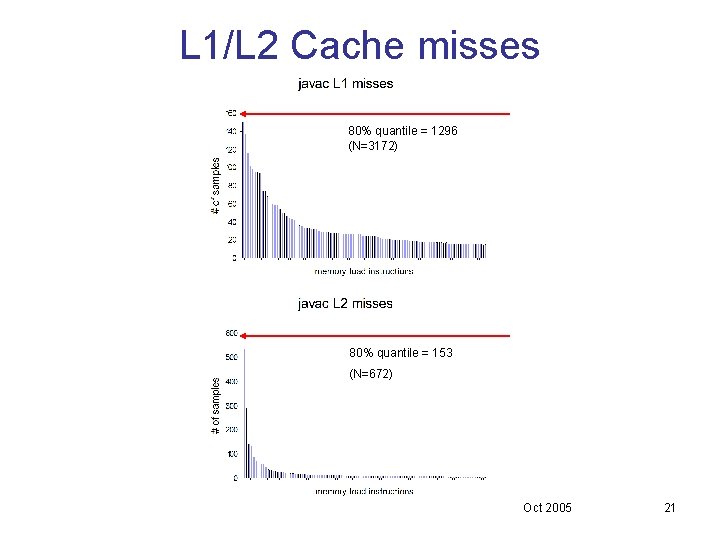
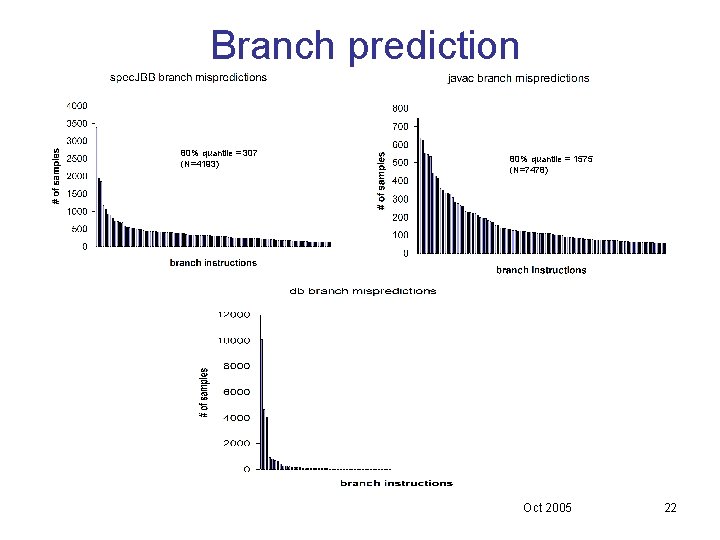
Measurements • Measure which instructions produce most events (cache misses, branch mispred) – Potential for data locality and control flow optimizations • Compare different spec-benchmarks – Find “hot spots”: instructions that produce 80% of all measured events Oct 2005 18
L 1/L 2 Cache misses 80% quantile = 21 instructions (N=571) 80% quantile = 13 (N=295) Oct 2005 19
L 1/L 2 Cache misses 80% quantile = 477 (N=8526) 80% quantile = 76 (N=2361) Oct 2005 20
L 1/L 2 Cache misses 80% quantile = 1296 (N=3172) 80% quantile = 153 (N=672) Oct 2005 21
Branch prediction 80% quantile = 307 (N=4193) 80% quantile = 1575 (N=7478) Oct 2005 22
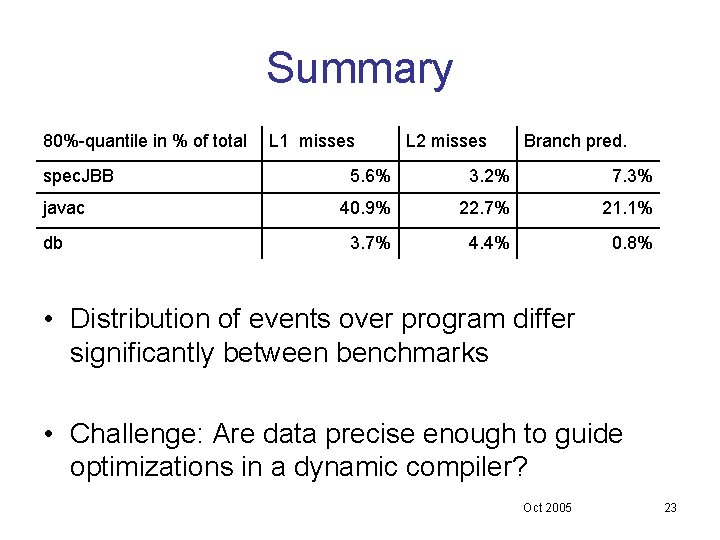
Summary 80%-quantile in % of total spec. JBB javac db L 1 misses L 2 misses Branch pred. 5. 6% 3. 2% 7. 3% 40. 9% 22. 7% 21. 1% 3. 7% 4. 4% 0. 8% • Distribution of events over program differ significantly between benchmarks • Challenge: Are data precise enough to guide optimizations in a dynamic compiler? Oct 2005 23
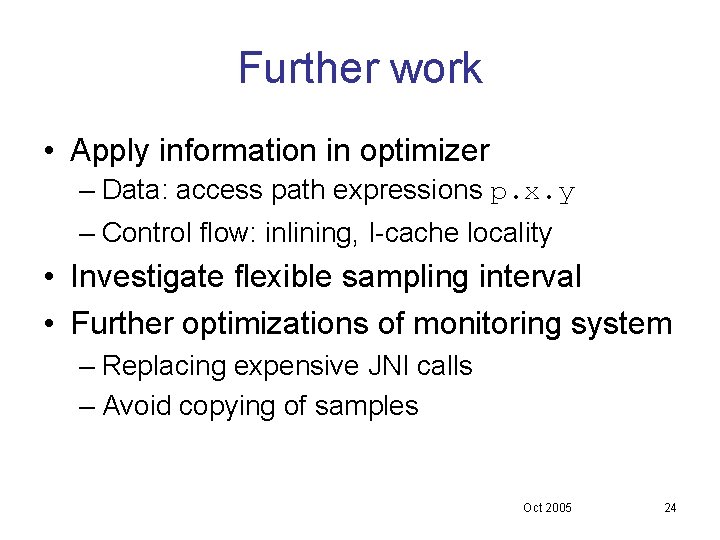
Further work • Apply information in optimizer – Data: access path expressions p. x. y – Control flow: inlining, I-cache locality • Investigate flexible sampling interval • Further optimizations of monitoring system – Replacing expensive JNI calls – Avoid copying of samples Oct 2005 24
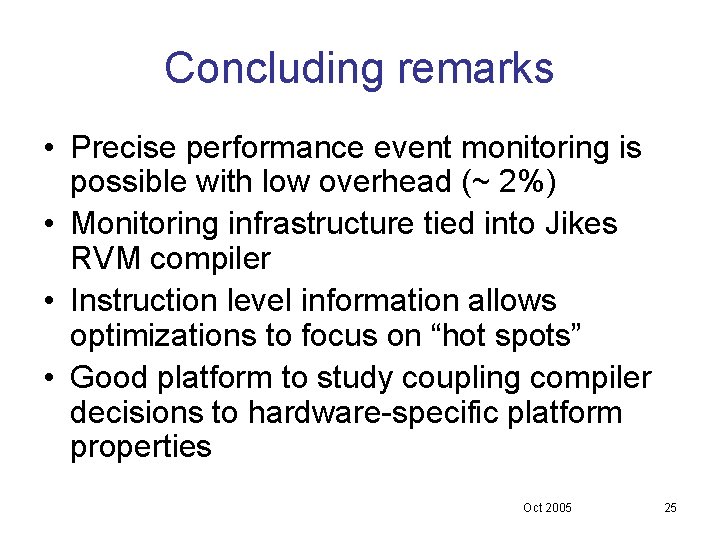
Concluding remarks • Precise performance event monitoring is possible with low overhead (~ 2%) • Monitoring infrastructure tied into Jikes RVM compiler • Instruction level information allows optimizations to focus on “hot spots” • Good platform to study coupling compiler decisions to hardware-specific platform properties Oct 2005 25