Performance Considerations for Packet Processing on Intel Architecture



- Slides: 26

Performance Considerations for Packet Processing on ® Intel Architecture Patrick Lu, Intel DCG/NPG/ASE Acknowledgement: Roman Dementiev, John Di. Giglio, Andi Kleen, Maciek Konstantynowicz, Sergio Gonzalez Monroy, Shrikant Shah, George Tkachuk, Vish Viswanathan, Jeremy Williamson

Agenda • Uncore Performance Monitoring with Hardware Counters • Measure PCIe Bandwidth • Measure Memory Bandwidth • Core Performance Monitoring • IPC revisit • Intel® Processor Trace for Performance Optimization

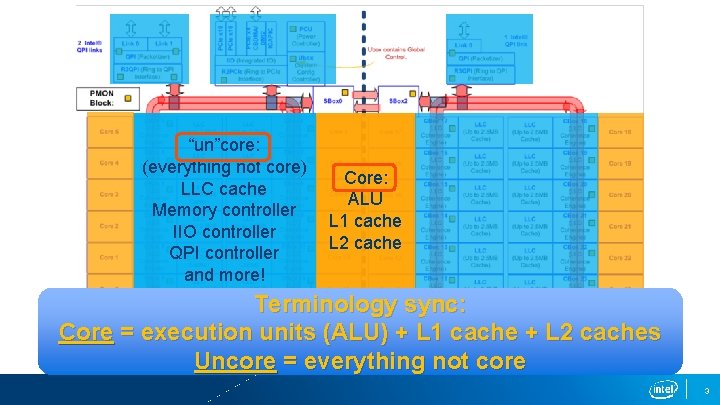
“un”core: (everything not core) LLC cache Memory controller IIO controller QPI controller and more! Core: ALU L 1 cache L 2 cache Terminology sync: Core = execution units (ALU) + L 1 cache + L 2 caches Uncore = everything not core 3

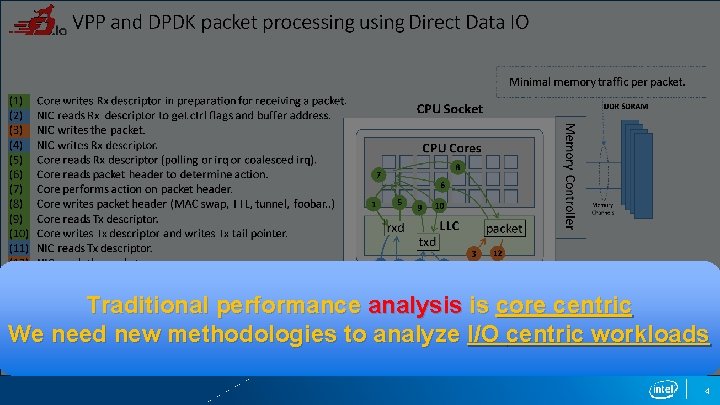
Traditional performance analysis is core centric We need new methodologies to analyze I/O centric workloads 4

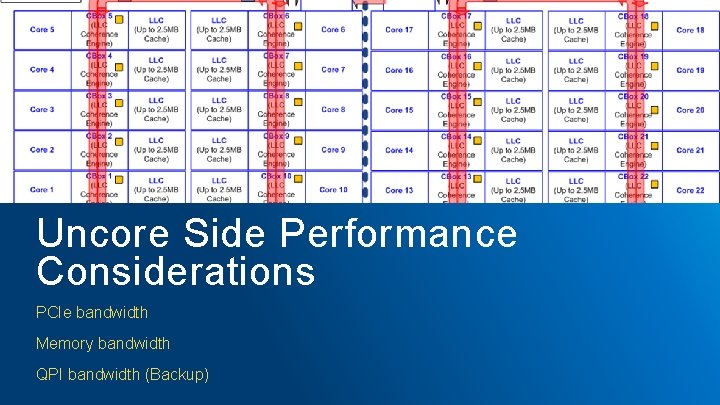
Uncore Side Performance Considerations PCIe bandwidth Memory bandwidth QPI bandwidth (Backup)

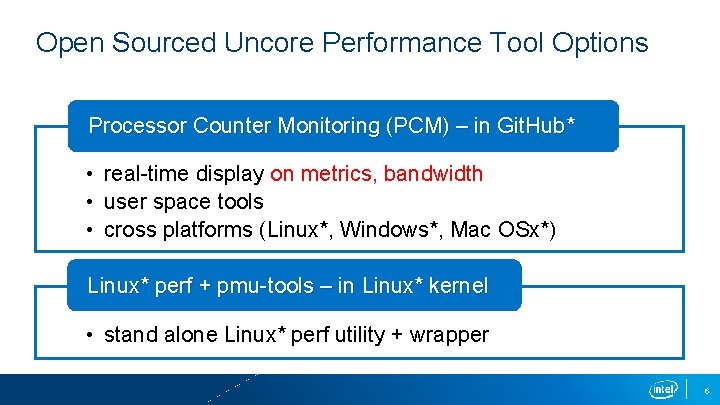
Open Sourced Uncore Performance Tool Options Processor Counter Monitoring (PCM) – in Git. Hub* • real-time display on metrics, bandwidth • user space tools • cross platforms (Linux*, Windows*, Mac OSx*) Linux* perf + pmu-tools – in Linux* kernel • stand alone Linux* perf utility + wrapper 6

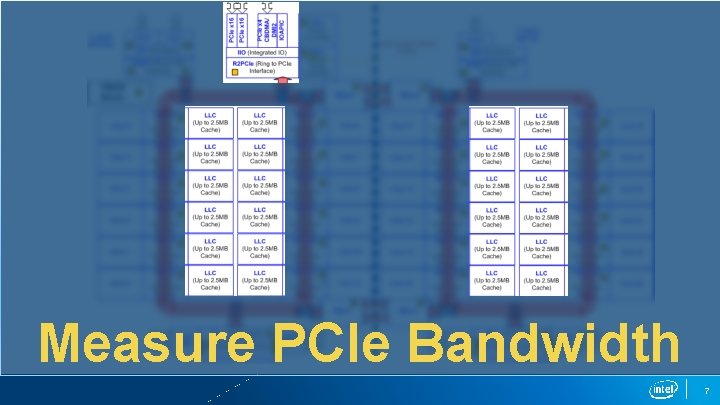
Measure PCIe Bandwidth 7

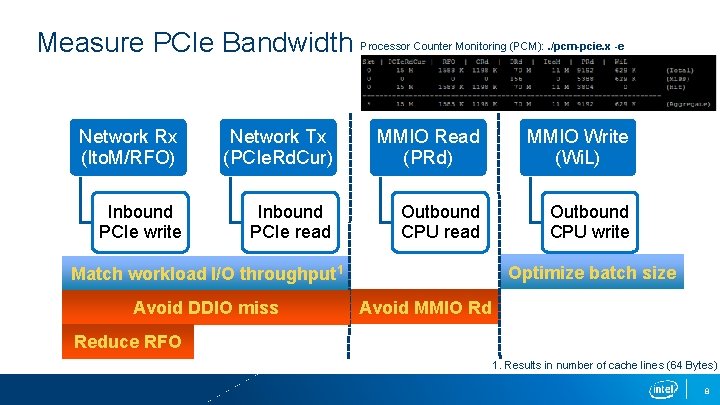
Measure PCIe Bandwidth Processor Counter Monitoring (PCM): . /pcm-pcie. x -e Network Rx (Ito. M/RFO) Network Tx (PCIe. Rd. Cur) MMIO Read (PRd) MMIO Write (Wi. L) Inbound PCIe write Inbound PCIe read Outbound CPU write Optimize batch size Match workload I/O throughput 1 Avoid DDIO miss Avoid MMIO Rd Reduce RFO 1. Results in number of cache lines (64 Bytes) 8

Measure Memory Bandwidth 9

Processor Counter Monitoring (PCM): . /pcm-memory. x Measure Memory Bandwidth Reason with memory traffic: 1) Wrong NUMA allocation 2) DDIO Miss 3) CPU data structure No memory traffic: Best 1) Fix it in the code! 2) Receive packets ASAP, descriptor ring sizes (needs tuning) 3) May be okay, but check for latency! 10

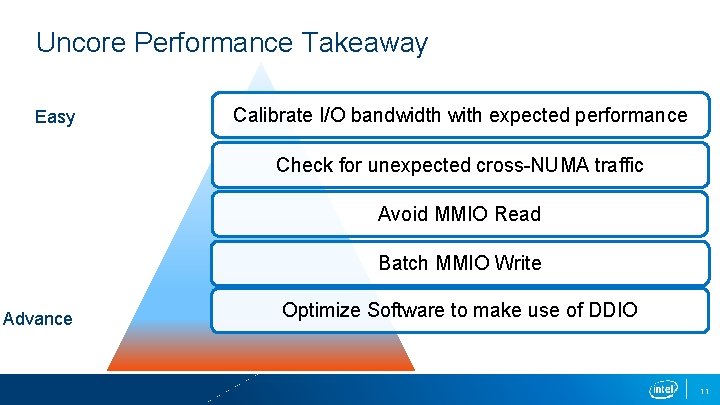
Uncore Performance Takeaway Easy Calibrate I/O bandwidth with expected performance Check for unexpected cross-NUMA traffic Avoid MMIO Read Batch MMIO Write Advance Optimize Software to make use of DDIO 11

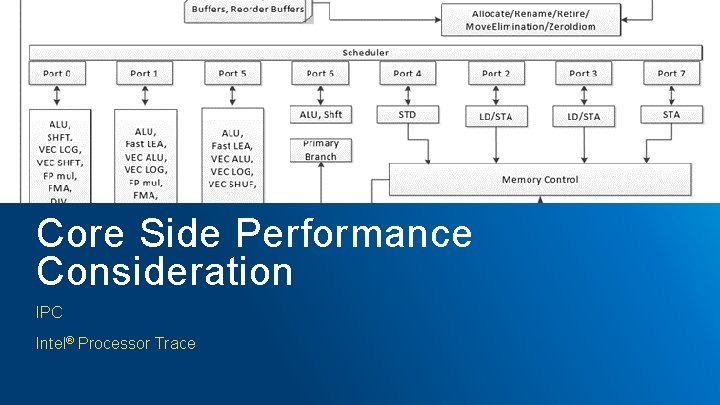
Core Side Performance Consideration IPC Intel® Processor Trace

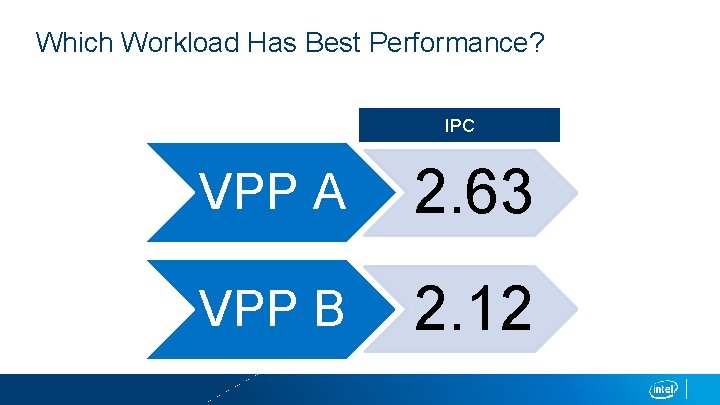
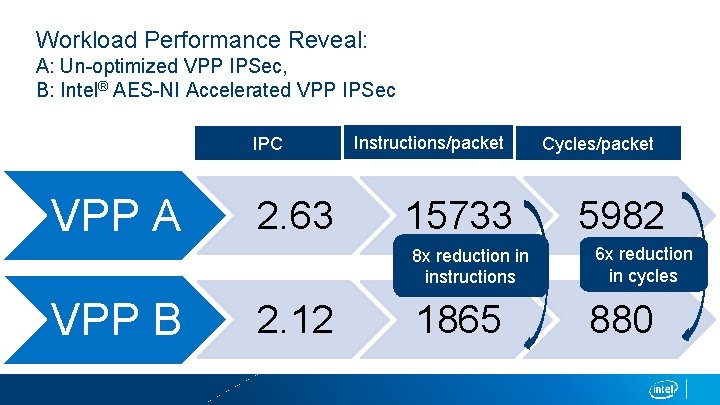
Which Workload Has Best Performance? IPC VPP A 2. 63 VPP B 2. 12

Workload Performance Reveal: A: Un-optimized VPP IPSec, B: Intel® AES-NI Accelerated VPP IPSec IPC VPP A 2. 63 Instructions/packet 15733 8 x reduction in instructions VPP B 2. 12 1865 Cycles/packet 5982 6 x reduction in cycles 880

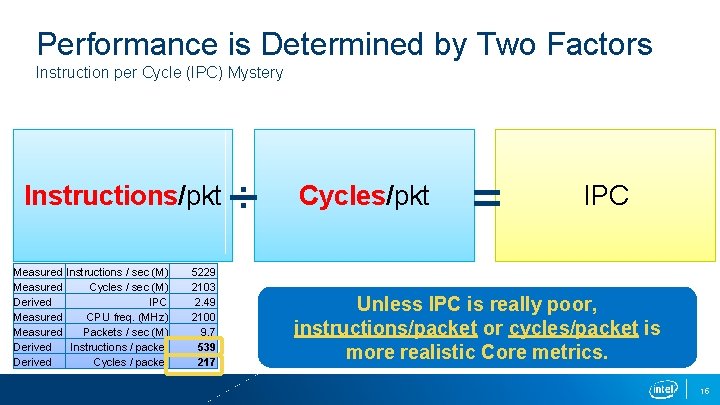
Performance is Determined by Two Factors Instruction per Cycle (IPC) Mystery Instructions/pkt Measured Instructions / sec (M) Measured Cycles / sec (M) Derived IPC Measured CPU freq. (MHz) Measured Packets / sec (M) Derived Instructions / packet Derived Cycles / packet 5229 2103 2. 49 2100 9. 7 539 217 ÷ Cycles/pkt = IPC Unless IPC is really poor, instructions/packet or cycles/packet is more realistic Core metrics. 15

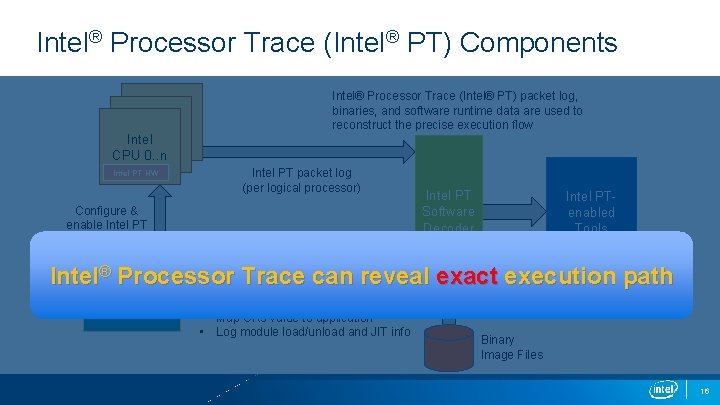
Intel® Processor Trace (Intel® PT) Components Intel CPU 0. . n Intel PT HW Intel® Processor Trace (Intel® PT) packet log, binaries, and software runtime data are used to reconstruct the precise execution flow Intel PT packet log (per logical processor) Configure & enable Intel PT Software Decoder Intel PTenabled Tools ® Processor Agent Intel. Ring 0 Trace can reveal exact execution path Runtime data, including: (OS, VMM, BIOS, Driver, …) • Map linear-address to image files • Map CR 3 value to application • Log module load/unload and JIT info Binary Image Files 16

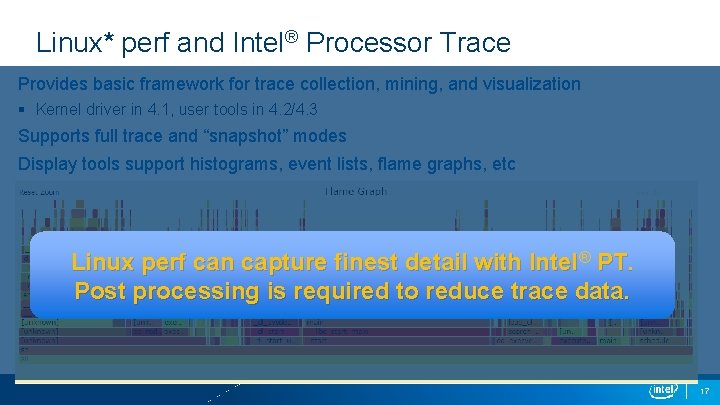
Linux* perf and Intel® Processor Trace Provides basic framework for trace collection, mining, and visualization § Kernel driver in 4. 1, user tools in 4. 2/4. 3 Supports full trace and “snapshot” modes Display tools support histograms, event lists, flame graphs, etc Linux perf can capture finest detail with Intel® PT. Post processing is required to reduce trace data. 17

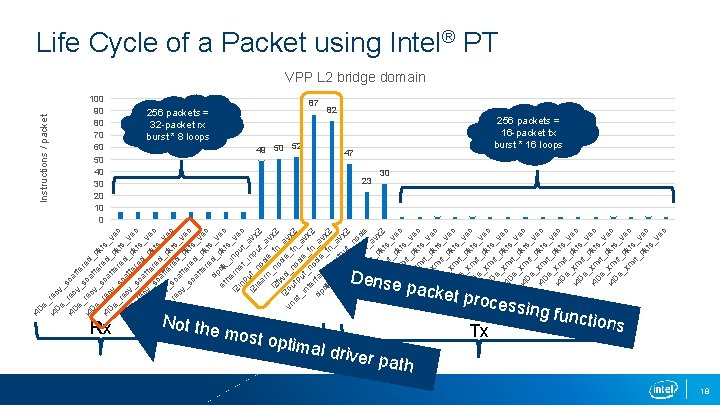
Dense e_ i 4 rec 0 e v _ _ i 4 rec sca 0 e v tte _ _ r i 4 rec sca ed_ 0 e v tte p k _ _ r i 4 rec sca ed_ ts_ 0 e v tte p ve k _ _ c r i 4 rec sca ed_ ts_ 0 e v tte p ve k _r _s c r ec ca ed_ ts_ v_ tte p ve sc re kts c at d_ _v te pk e re t c dp d_ s_v p et dk kt ec h _ s l 2 ern inp _ve in et ut p _ c _ l 2 ut_ inp avx le no ut 2 ar _ n de a l 2 _no _fn vx 2 f d _a l w vn 2 ou d_n e_f vx et tp od n_ 2 _i ut nt _n e_f avx e n 2 dp rfac ode _av dk e_ _fn x 2 _i ou _ a nt e tp v i 4 rfa ut_ x 2 0 e ce n _ _ o i 4 xm tx_ de 0 e it av _ _ i 4 xm pkts x 2 0 e it _v _ _ i 4 xm pkts ec 0 e it _v _ _ i 4 xm pkts ec 0 e it _v _ _ i 4 xm pkts ec 0 e it _v _ _ i 4 xm pkts ec 0 e it _ _x _p ve m kts c it_ _v pk ec ts _v ec i 4 0 Instructions / packet Life Cycle of a Packet using Intel® PT VPP L 2 bridge domain 100 90 80 70 60 50 40 30 20 10 0 Rx 256 packets = 32 -packet rx burst * 8 loops 87 49 50 52 82 47 256 packets = 16 -packet tx burst * 16 loops 23 30 packet p Not the Processing most o ptimal driver p ath rocess Tx ing fun ctions 18

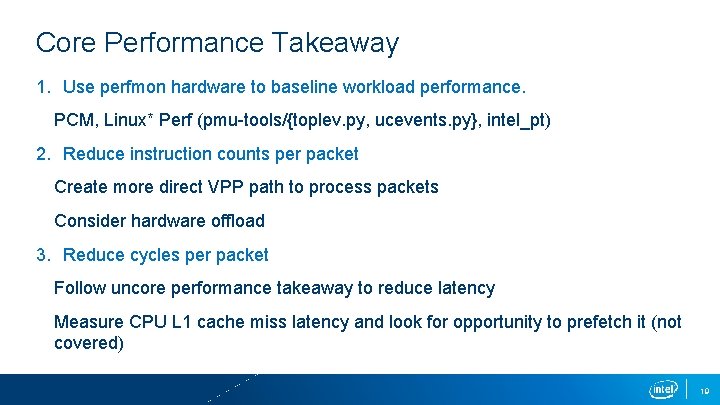
Core Performance Takeaway 1. Use perfmon hardware to baseline workload performance. PCM, Linux* Perf (pmu-tools/{toplev. py, ucevents. py}, intel_pt) 2. Reduce instruction counts per packet Create more direct VPP path to process packets Consider hardware offload 3. Reduce cycles per packet Follow uncore performance takeaway to reduce latency Measure CPU L 1 cache miss latency and look for opportunity to prefetch it (not covered) 19

References • Xeon® E 5 -v 4 Uncore Performance Monitor Unit (PMU) guide: https: //software. intel. com/en-us/blogs/2014/07/11/documentation-for-uncoreperformance-monitoring-units • Intel® 64 and IA-32 Architectures Optimization Reference Manual: http: //www. intel. com/content/www/us/en/architecture-and-technology/64 -ia-32 architectures-optimization-manual. html • Processor Counter Monitoring (PCM): https: //github. com/opcm/pcm • pmu-tools: https: //github. com/andikleen/pmu-tools • Intel® Processor Trace Linux* perf support: https: //github. com/torvalds/linux/blob/master/tools/perf/Documentation/intelpt. txt 20


Backup 22

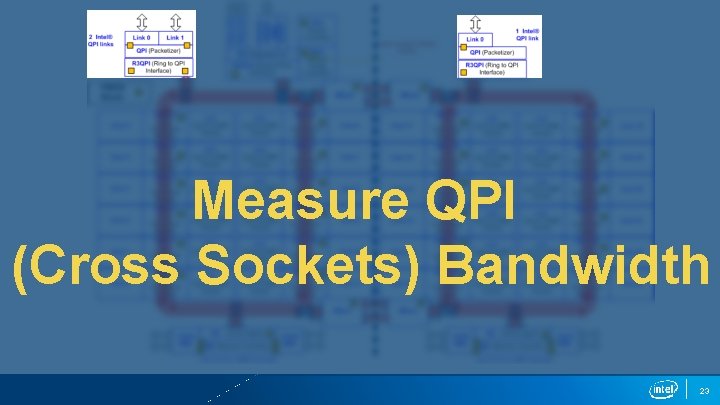
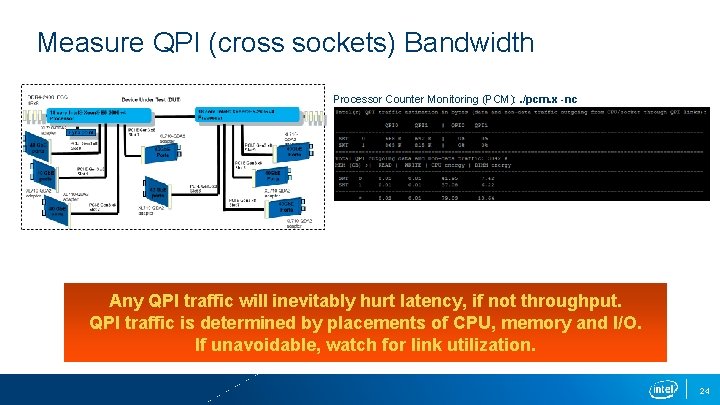
Measure QPI (Cross Sockets) Bandwidth 23

Measure QPI (cross sockets) Bandwidth Processor Counter Monitoring (PCM): . /pcm. x -nc Any QPI traffic will inevitably hurt latency, if not throughput. QPI traffic is determined by placements of CPU, memory and I/O. If unavoidable, watch for link utilization. 24

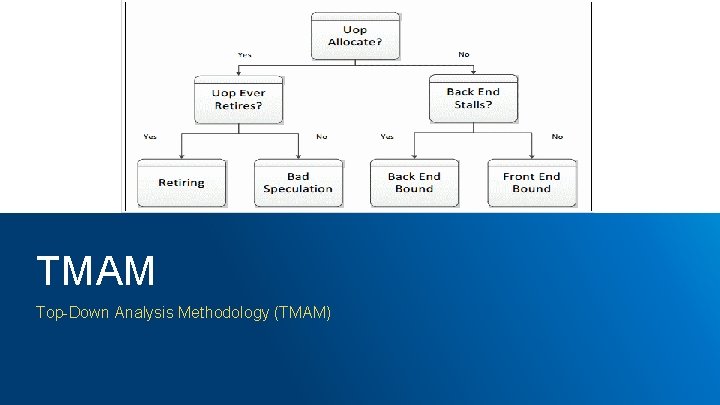
TMAM Top-Down Analysis Methodology (TMAM)

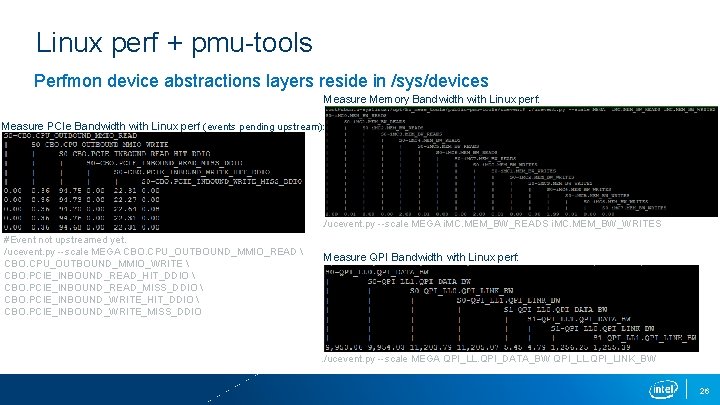
Linux perf + pmu-tools Perfmon device abstractions layers reside in /sys/devices Measure Memory Bandwidth with Linux perf: Measure PCIe Bandwidth with Linux perf (events pending upstream): . /ucevent. py --scale MEGA i. MC. MEM_BW_READS i. MC. MEM_BW_WRITES #Event not upstreamed yet. /ucevent. py --scale MEGA CBO. CPU_OUTBOUND_MMIO_READ CBO. CPU_OUTBOUND_MMIO_WRITE CBO. PCIE_INBOUND_READ_HIT_DDIO CBO. PCIE_INBOUND_READ_MISS_DDIO CBO. PCIE_INBOUND_WRITE_HIT_DDIO CBO. PCIE_INBOUND_WRITE_MISS_DDIO Measure QPI Bandwidth with Linux perf: . /ucevent. py --scale MEGA QPI_LL. QPI_DATA_BW QPI_LL. QPI_LINK_BW 26