Using Li DARDerived DEMs to Predict Wet Soils

 • USDA-NRCS")
 • Identify potential")


")
 • Soil profile every")


")
")


- Slides: 25
Using Li. DAR-Derived DEMs to Predict Wet Soils Gary Montgomery • GEOG 596 A Advisor: Patrick Drohan Funding partners:
Credits/Acknowledgement • Penn State University’s Soil Characterization Lab (http: //soilislife. psu. edu/) • USDA-NRCS Pennsylvania • Lycoming County Planning Department
Study Goals • Identify potential wet soils (saturated above 50 cm) • Identify potential hydric soils and unmapped wetlands. • Validate model for NCPA/Appalachian Plateau region – Demonstrate applicability with ground truthing – Determine correlation with other indices: SOM, depth
Study Purpose/Application • • Hydric soil identification Wetland identification Surface/stormwater runoff prediction BMP implementation that enhances E&S plans Landslide susceptibility Road maintenance Amphibian migratory pathways Nutrient runoff potential in agricultural areas
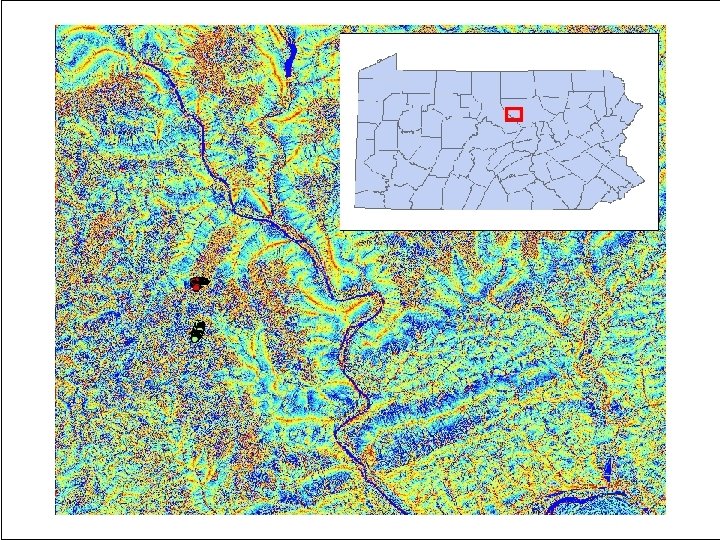
Methods • PAMAP 1 m Li. DAR Data – 42 -tile study area – Mosaiced to new, export • With Whitebox GAT, run topographic wetness index analysis – Field verified by pit descriptions, well recording, soil moisture sensors, and “wet boot” monitoring.
Topographic Wetness Index • Predictor of wetted areas based on grid analysis – Fill DEM (Planchon & Darboux algorithm) – Flow direction (D-inf) – Flow accumulation (D-inf) – Slope • Natural log(upslope catchment/tangent(slope))
TWI vs other indices • Appropriate for rolling/hilly terrain • D-inf flow pointer and accumulation are multi-directional: high resolution DEM unsuited to single-direction flow algorithms
Whitebox GAT UI (http: //www. uoguelph. ca/~hydrogeo/Whitebox/index. html)
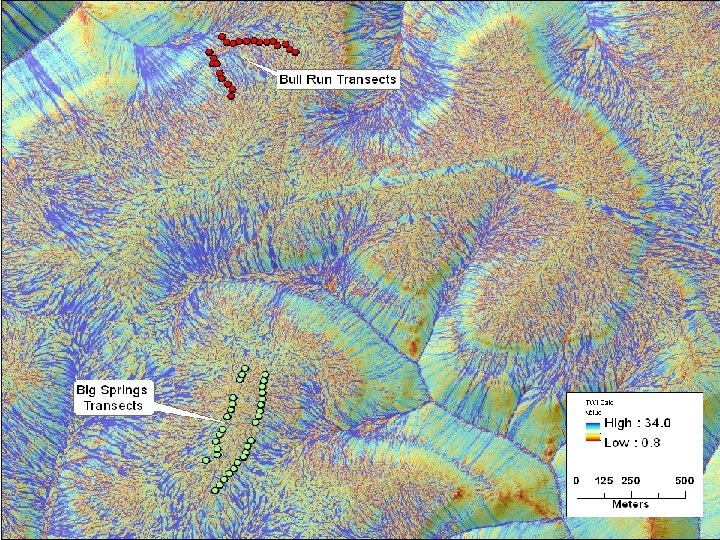
Ground truthing • Cross-contour transects • GPS (Trimble Geo. XT) • Soil profile every 30 m – A and O horizon thickness – Depth to fragipan and/or Bt horizon (high clay) – Depth to redox
Saturation expressed as visual depletions and concentrations of soil color. Redoximorphic features are used to identify soil drainage classes Drohan, 2011
Drohan, 2011
TWI > 7. 89 Hydro C/D Hydro D NWI
Preliminary Results Non-parametric, Mood median test: P = 0. 09
Preliminary Results
Example Use: Gas Extraction • Infrastructure needs – access, clearing, roads, rightsof-way • Often in remote, rugged area • Soil effects from construction, support traffic – Soil moisture loss/compaction – Soil organic carbon loss – Change in surficial flow: “flashy”
Drohan, 2011
Gas Well Sites and Soil Drainage Class % of wells Excessively drained <1 Well drained 41 Moderately well drained 30 Somewhat poorly drained 28 Poorly drained <1 Very poorly drained <1 Sw. PD: Wet soil for significant periods; redox features in the upper 50 cm Drohan, 2011
Drohan et al. (2011)
Doherty et al. (2008)
Project Timeline • Summer 2011 – Field forays wrap up • September – October 2011 – Paper revision/finalization • October – December 2011 – Conference presentation
Future work • Other DEM sources – Comparison w/ 10 & 30 m DEMs • Stats on C/D and D soil hydro group polygons
References • • Mc. Kergrow, L. A. et al. Modeling wetland extent using terrain indices, Lake Taupo, NZ. Proceedings of MODSIM 2007 International Congress on Modelling and Simulation Society of Australia and New Zealand, December 2007, 74– 80. Pei, Tao et al. Mapping soil organic matter using the topographic wetness index: A comparative study based on different flow-direction algorithms and kriging methods. 2010. Ecological Indicators 10, 610 -619. Schmidt, Frank et al. Comparison of DEM Data Capture and Topographic Wetness Indices. 2003. Precision Agriculture 4, 179 -192. Sorenson, R. et al. On the calculation of the topographic wetness index: evaluation of different methods based on field observations. 2006. Hydrology and Earth System Sciences 10, 101 -112.
Any questions?