UPS Meteorology AMDAR Forecasting Aid WVSS Data Fog

- Slides: 32
UPS Meteorology - AMDAR • Forecasting Aid – WVSS Data − Fog − Winter Precipitation Types • Diagnostic Aid/Case Studies − Document Events − Develop New Forecast Techniques
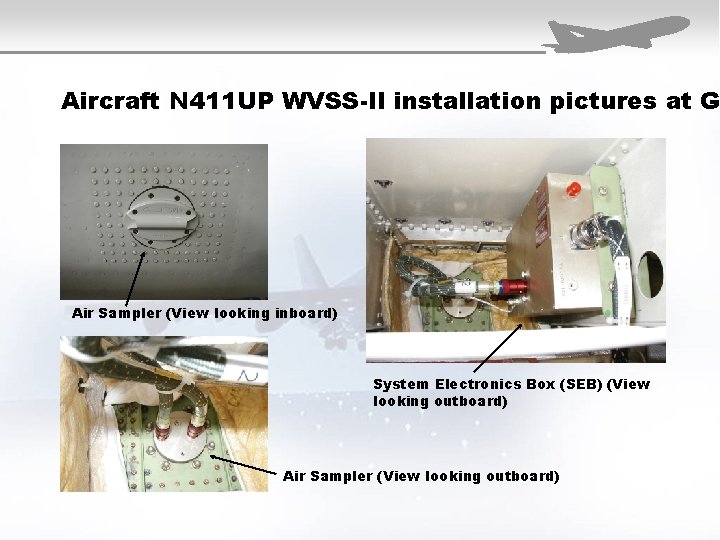
Aircraft N 411 UP WVSS-II installation pictures at G Air Sampler (View looking inboard) System Electronics Box (SEB) (View looking outboard) Air Sampler (View looking outboard)
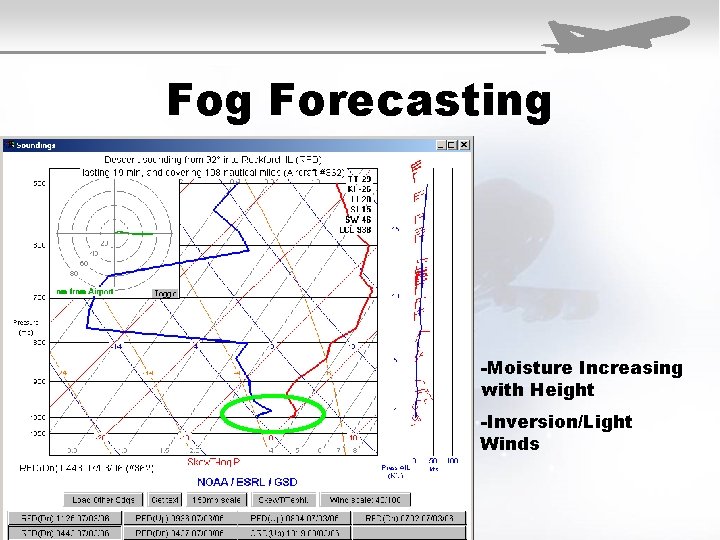
Fog Forecasting -Moisture Increasing with Height -Inversion/Light Winds
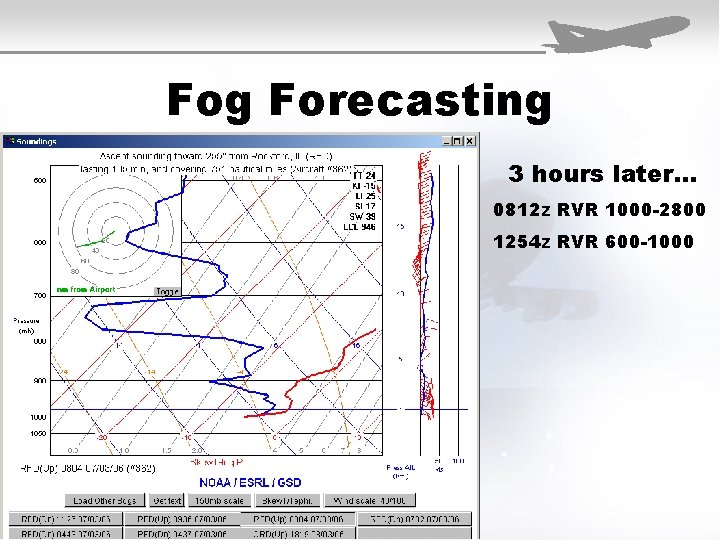
Fog Forecasting 3 hours later… 0812 z RVR 1000 -2800 1254 z RVR 600 -1000
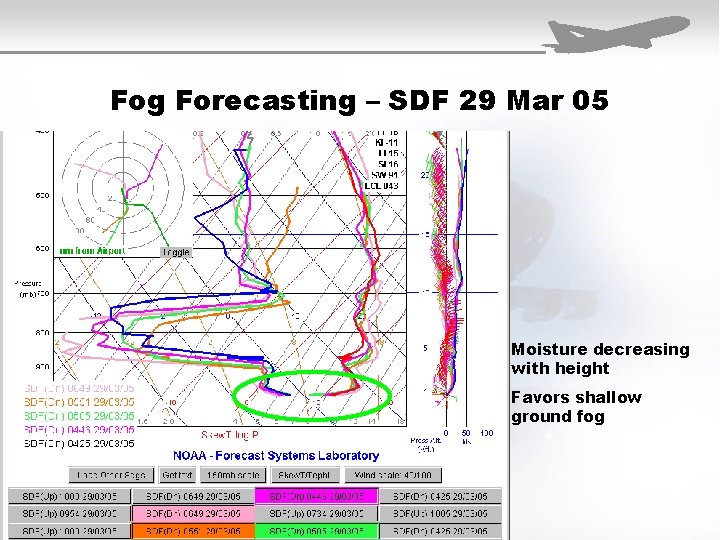
Fog Forecasting – SDF 29 Mar 05 Moisture decreasing with height Favors shallow ground fog
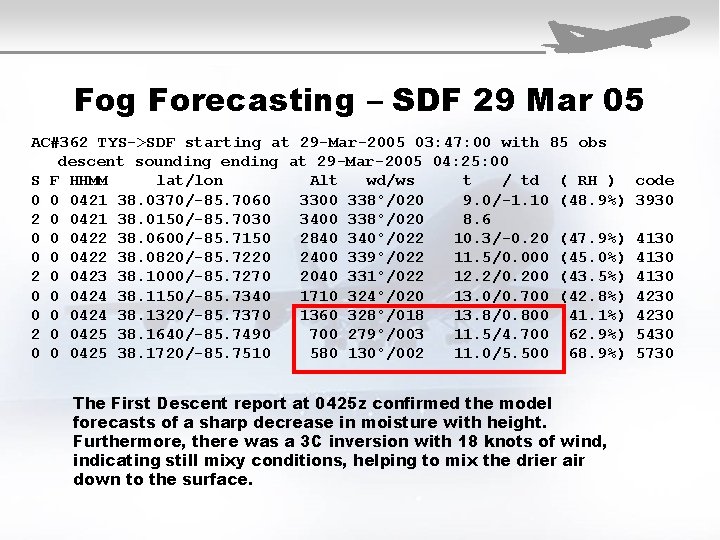
Fog Forecasting – SDF 29 Mar 05 AC#362 TYS->SDF starting at 29 -Mar-2005 03: 47: 00 with 85 obs descent sounding ending at 29 -Mar-2005 04: 25: 00 S F HHMM lat/lon Alt wd/ws t / td ( RH ) 0 0 0421 38. 0370/-85. 7060 3300 338°/020 9. 0/-1. 10 (48. 9%) 2 0 0421 38. 0150/-85. 7030 3400 338°/020 8. 6 0 0 0422 38. 0600/-85. 7150 2840 340°/022 10. 3/-0. 20 (47. 9%) 0 0 0422 38. 0820/-85. 7220 2400 339°/022 11. 5/0. 000 (45. 0%) 2 0 0423 38. 1000/-85. 7270 2040 331°/022 12. 2/0. 200 (43. 5%) 0 0 0424 38. 1150/-85. 7340 1710 324°/020 13. 0/0. 700 (42. 8%) 0 0 0424 38. 1320/-85. 7370 1360 328°/018 13. 8/0. 800 (41. 1%) 2 0 0425 38. 1640/-85. 7490 700 279°/003 11. 5/4. 700 (62. 9%) 0 0 0425 38. 1720/-85. 7510 580 130°/002 11. 0/5. 500 (68. 9%) The First Descent report at 0425 z confirmed the model forecasts of a sharp decrease in moisture with height. Furthermore, there was a 3 C inversion with 18 knots of wind, indicating still mixy conditions, helping to mix the drier air down to the surface. code 3930 4130 4230 5430 5730
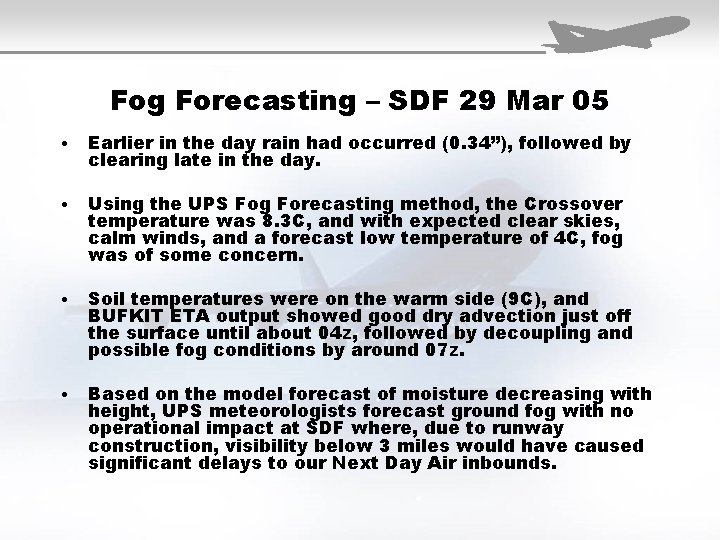
Fog Forecasting – SDF 29 Mar 05 • Earlier in the day rain had occurred (0. 34”), followed by clearing late in the day. • Using the UPS Fog Forecasting method, the Crossover temperature was 8. 3 C, and with expected clear skies, calm winds, and a forecast low temperature of 4 C, fog was of some concern. • Soil temperatures were on the warm side (9 C), and BUFKIT ETA output showed good dry advection just off the surface until about 04 z, followed by decoupling and possible fog conditions by around 07 z. • Based on the model forecast of moisture decreasing with height, UPS meteorologists forecast ground fog with no operational impact at SDF where, due to runway construction, visibility below 3 miles would have caused significant delays to our Next Day Air inbounds.
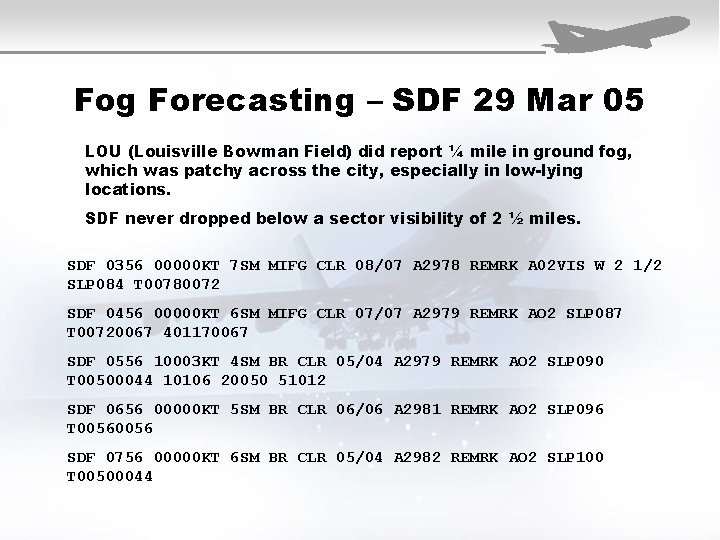
Fog Forecasting – SDF 29 Mar 05 LOU (Louisville Bowman Field) did report ¼ mile in ground fog, which was patchy across the city, especially in low-lying locations. SDF never dropped below a sector visibility of 2 ½ miles. SDF 0356 00000 KT 7 SM MIFG CLR 08/07 A 2978 REMRK A 02 VIS W 2 1/2 SLP 084 T 00780072 SDF 0456 00000 KT 6 SM MIFG CLR 07/07 A 2979 REMRK AO 2 SLP 087 T 00720067 401170067 SDF 0556 10003 KT 4 SM BR CLR 05/04 A 2979 REMRK AO 2 SLP 090 T 00500044 10106 20050 51012 SDF 0656 00000 KT 5 SM BR CLR 06/06 A 2981 REMRK AO 2 SLP 096 T 0056 SDF 0756 00000 KT 6 SM BR CLR 05/04 A 2982 REMRK AO 2 SLP 100 T 00500044
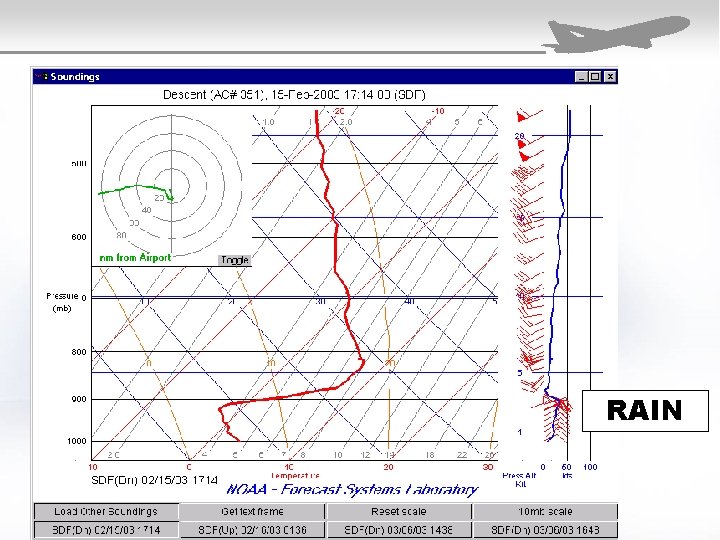
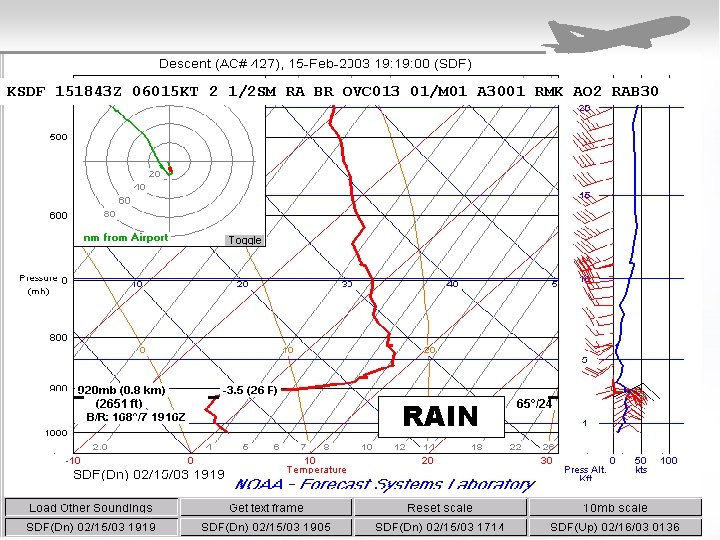
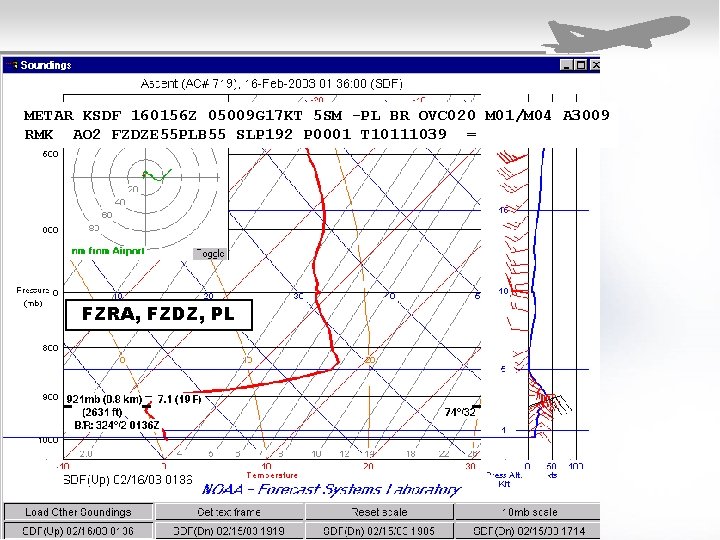
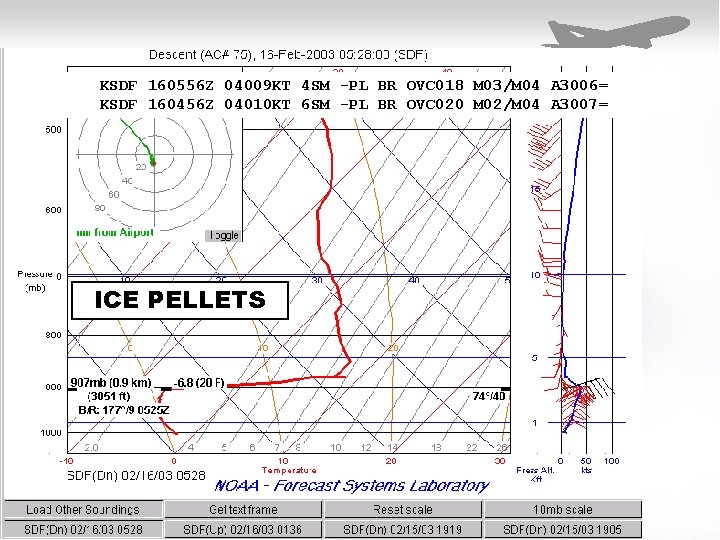
Winter Precipitation Types SDF 15 -16 Feb 2003
RAIN
KSDF 151843 Z 06015 KT 2 1/2 SM RA BR OVC 013 01/M 01 A 3001 RMK AO 2 RAB 30 RAIN
METAR KSDF 160156 Z 05009 G 17 KT 5 SM -PL BR OVC 020 M 01/M 04 A 3009 RMK AO 2 FZDZE 55 PLB 55 SLP 192 P 0001 T 10111039 = FZRA, FZDZ, PL
KSDF 160556 Z 04009 KT 4 SM -PL BR OVC 018 M 03/M 04 A 3006= KSDF 160456 Z 04010 KT 6 SM -PL BR OVC 020 M 02/M 04 A 3007= ICE PELLETS
Diagnostic Aid/Case Studies − Document Events What happened? Why did it happen? − Develop New Forecast Techniques Were there clues in the model output? If so, develop forecast techniques to predict the next event.
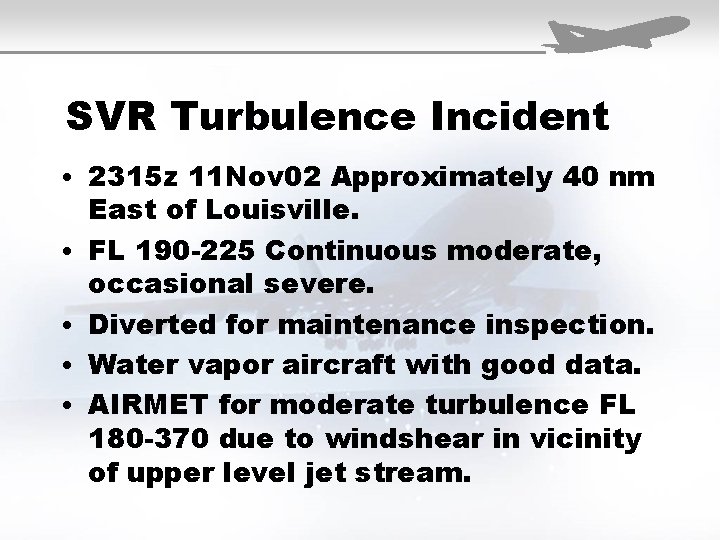
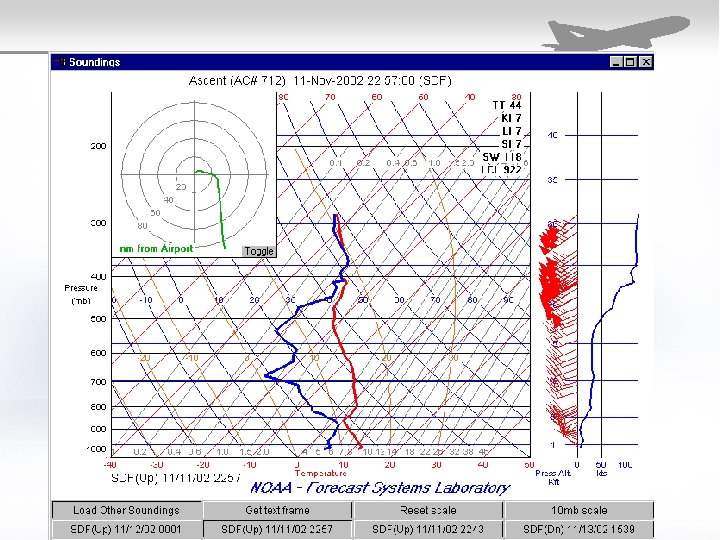
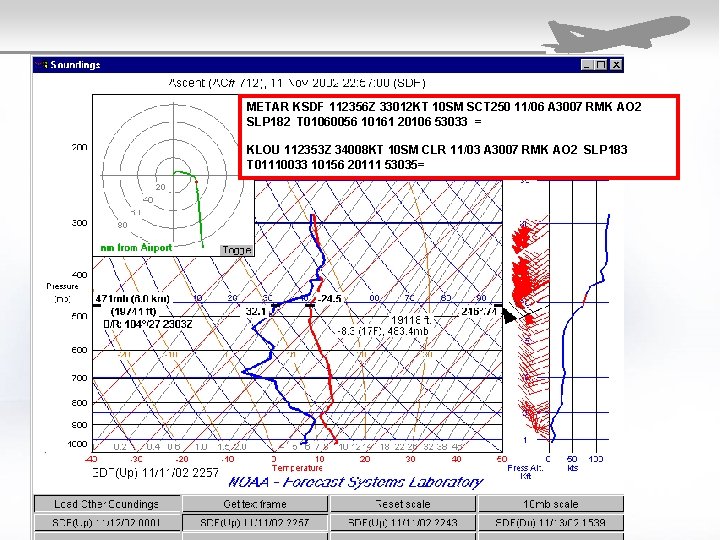
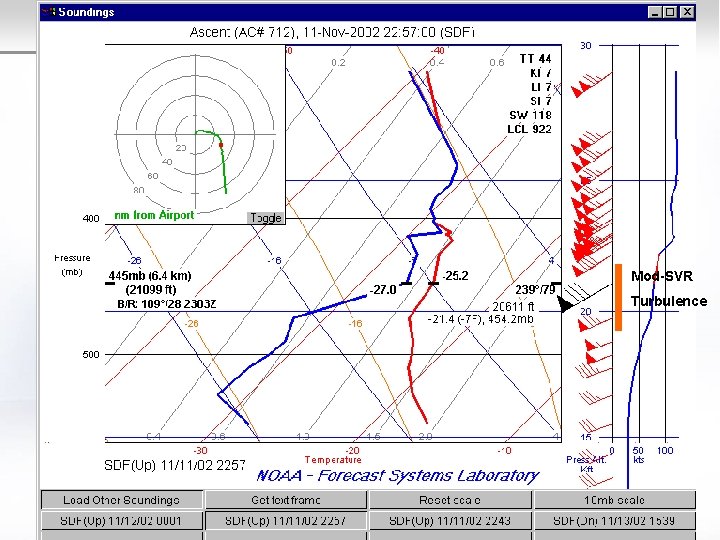
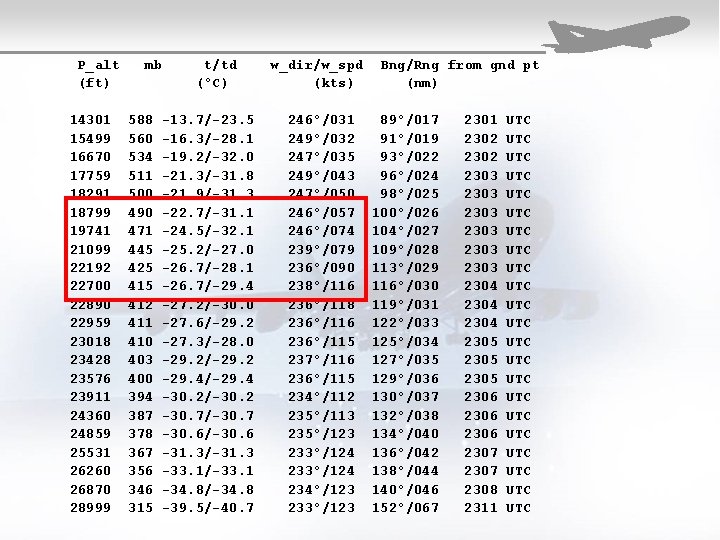
SVR Turbulence Incident • 2315 z 11 Nov 02 Approximately 40 nm • • East of Louisville. FL 190 -225 Continuous moderate, occasional severe. Diverted for maintenance inspection. Water vapor aircraft with good data. AIRMET for moderate turbulence FL 180 -370 due to windshear in vicinity of upper level jet stream.
METAR KSDF 112356 Z 33012 KT 10 SM SCT 250 11/06 A 3007 RMK AO 2 SLP 182 T 01060056 10161 20106 53033 = KLOU 112353 Z 34008 KT 10 SM CLR 11/03 A 3007 RMK AO 2 SLP 183 T 01110033 10156 20111 53035=
Mod-SVR Turbulence
P_alt (ft) 14301 15499 16670 17759 18291 18799 19741 21099 22192 22700 22890 22959 23018 23428 23576 23911 24360 24859 25531 26260 26870 28999 mb 588 560 534 511 500 490 471 445 425 412 411 410 403 400 394 387 378 367 356 346 315 t/td (°C) -13. 7/-23. 5 -16. 3/-28. 1 -19. 2/-32. 0 -21. 3/-31. 8 -21. 9/-31. 3 -22. 7/-31. 1 -24. 5/-32. 1 -25. 2/-27. 0 -26. 7/-28. 1 -26. 7/-29. 4 -27. 2/-30. 0 -27. 6/-29. 2 -27. 3/-28. 0 -29. 2/-29. 2 -29. 4/-29. 4 -30. 2/-30. 2 -30. 7/-30. 7 -30. 6/-30. 6 -31. 3/-31. 3 -33. 1/-33. 1 -34. 8/-34. 8 -39. 5/-40. 7 w_dir/w_spd (kts) 246°/031 249°/032 247°/035 249°/043 247°/050 246°/057 246°/074 239°/079 236°/090 238°/116 236°/118 236°/116 236°/115 237°/116 236°/115 234°/112 235°/113 235°/123 233°/124 234°/123 233°/123 Bng/Rng from gnd pt (nm) 89°/017 91°/019 93°/022 96°/024 98°/025 100°/026 104°/027 109°/028 113°/029 116°/030 119°/031 122°/033 125°/034 127°/035 129°/036 130°/037 132°/038 134°/040 136°/042 138°/044 140°/046 152°/067 2301 2302 2303 2303 2304 2305 2306 2307 2308 2311 UTC UTC UTC UTC UTC UTC
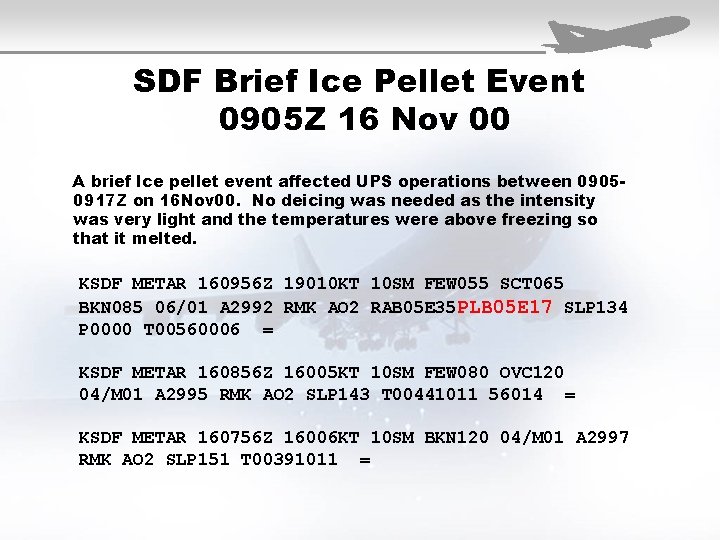
SDF Brief Ice Pellet Event 0905 Z 16 Nov 00 A brief Ice pellet event affected UPS operations between 09050917 Z on 16 Nov 00. No deicing was needed as the intensity was very light and the temperatures were above freezing so that it melted. KSDF METAR 160956 Z 19010 KT 10 SM FEW 055 SCT 065 BKN 085 06/01 A 2992 RMK AO 2 RAB 05 E 35 PLB 05 E 17 SLP 134 P 0000 T 00560006 = KSDF METAR 160856 Z 16005 KT 10 SM FEW 080 OVC 120 04/M 01 A 2995 RMK AO 2 SLP 143 T 00441011 56014 = KSDF METAR 160756 Z 16006 KT 10 SM BKN 120 04/M 01 A 2997 RMK AO 2 SLP 151 T 00391011 =
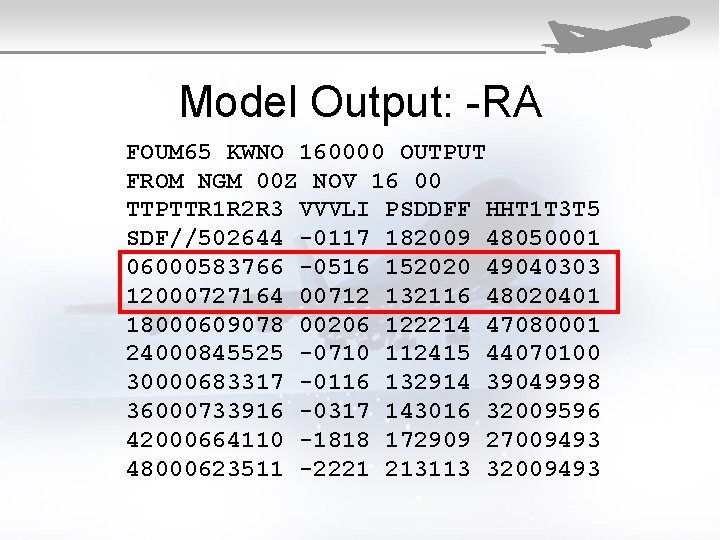
Model Output: -RA FOUM 65 KWNO 160000 OUTPUT FROM NGM 00 Z NOV 16 00 TTPTTR 1 R 2 R 3 VVVLI PSDDFF HHT 1 T 3 T 5 SDF//502644 -0117 182009 48050001 06000583766 -0516 152020 49040303 12000727164 00712 132116 48020401 18000609078 00206 122214 47080001 24000845525 -0710 112415 44070100 30000683317 -0116 132914 39049998 36000733916 -0317 143016 32009596 42000664110 -1818 172909 27009493 48000623511 -2221 213113 32009493
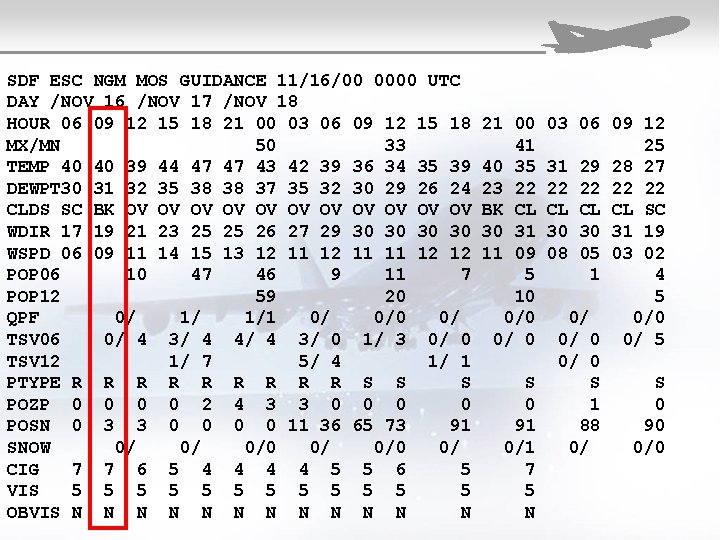
SDF ESC NGM MOS GUIDANCE 11/16/00 0000 UTC DAY /NOV 16 /NOV 17 /NOV 18 HOUR 06 09 12 15 18 21 00 03 06 09 12 15 18 MX/MN 50 33 TEMP 40 40 39 44 47 47 43 42 39 36 34 35 39 DEWPT 30 31 32 35 38 38 37 35 32 30 29 26 24 CLDS SC BK OV OV OV WDIR 17 19 21 23 25 25 26 27 29 30 30 WSPD 06 09 11 14 15 13 12 11 11 12 12 POP 06 10 47 46 9 11 7 POP 12 59 20 QPF 0/ 1/ 1/1 0/ 0/0 0/ TSV 06 0/ 4 3/ 4 4/ 4 3/ 0 1/ 3 0/ 0 TSV 12 1/ 7 5/ 4 1/ 1 PTYPE R R R R R S S S POZP 0 0 2 4 3 3 0 0 POSN 0 3 3 0 0 11 36 65 73 91 SNOW 0/ 0/ 0/0 0/ CIG 7 7 6 5 4 4 5 5 6 5 VIS 5 5 5 OBVIS N N N 21 00 41 40 35 23 22 BK CL 30 31 11 09 5 10 0/ 0 S 0 91 0/1 7 5 N 03 06 09 12 25 31 29 28 27 22 22 CL CL CL SC 30 30 31 19 08 05 03 02 1 4 5 0/ 0/0 0/ 5 0/ 0 S S 1 0 88 90 0/ 0/0
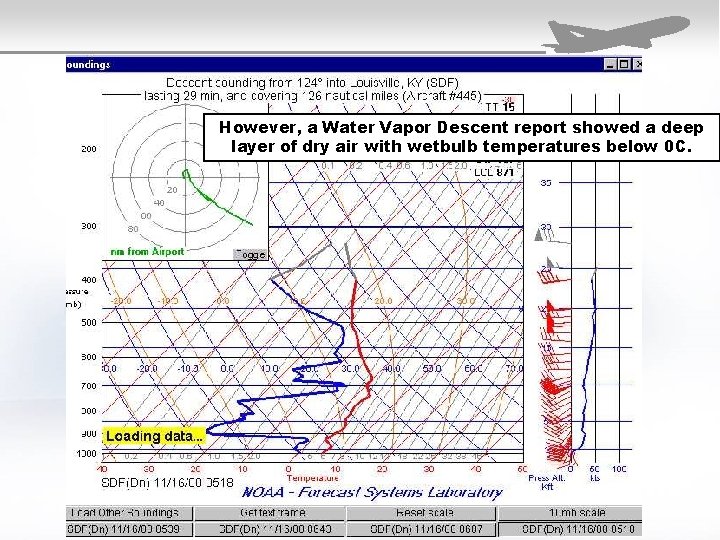
However, a Water Vapor Descent report showed a deep layer of dry air with wetbulb temperatures below 0 C.
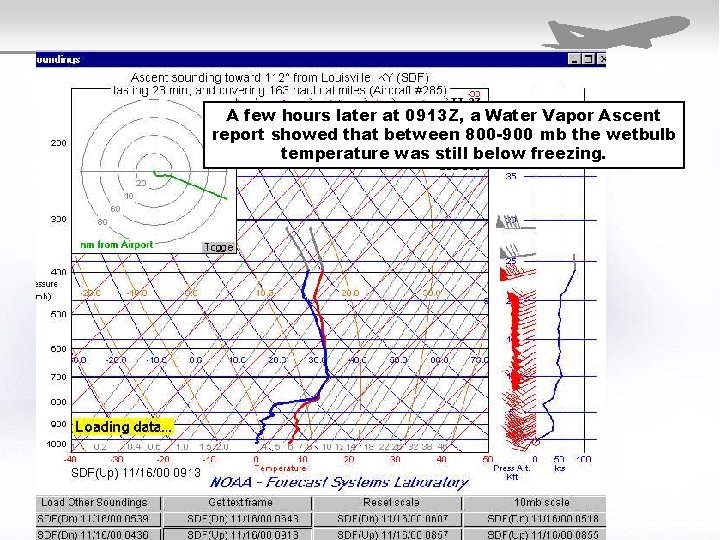
A few hours later at 0913 Z, a Water Vapor Ascent report showed that between 800 -900 mb the wetbulb temperature was still below freezing.
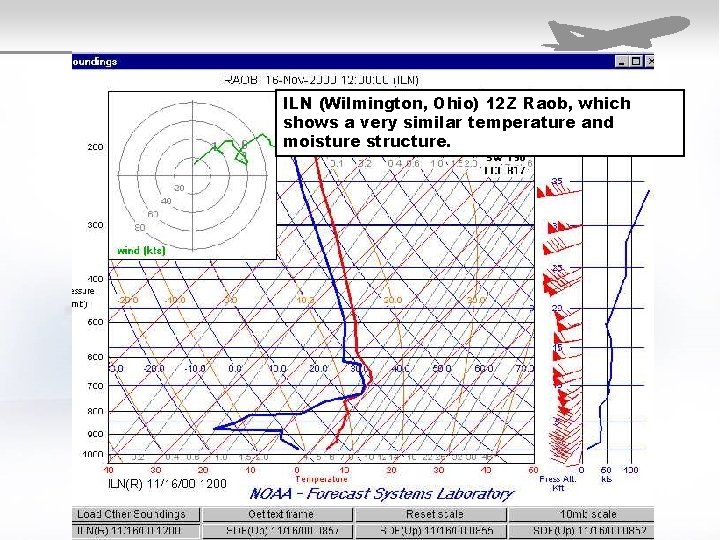
ILN (Wilmington, Ohio) 12 Z Raob, which shows a very similar temperature and moisture structure.
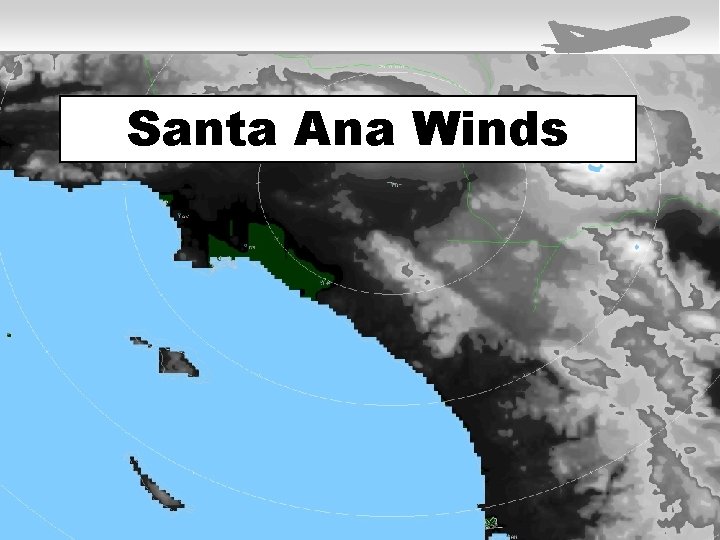
Santa Ana Winds
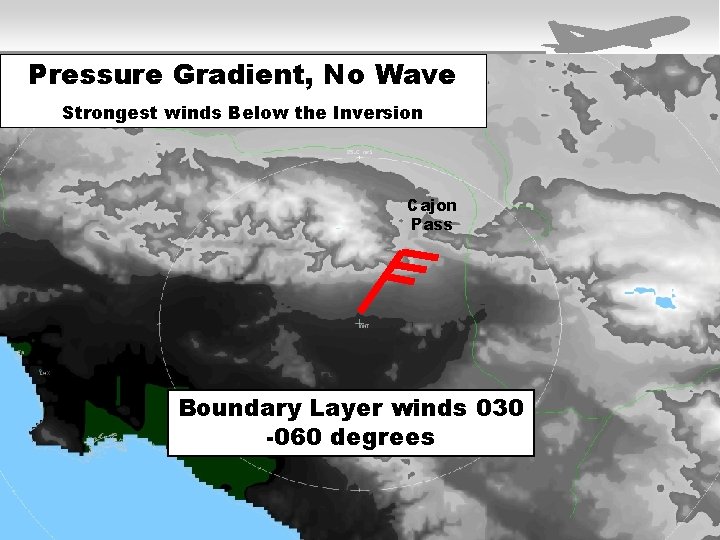
Pressure Gradient, No Wave Strongest winds Below the Inversion Cajon Pass Boundary Layer winds 030 -060 degrees
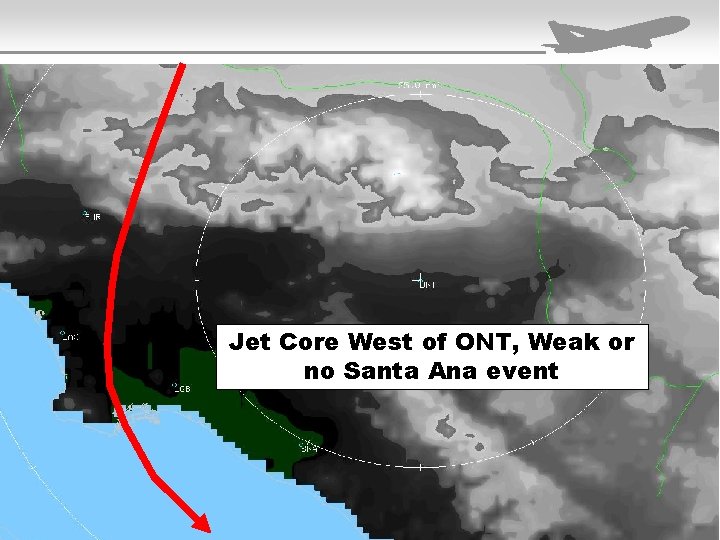
Jet Core West of ONT, Weak or no Santa Ana event
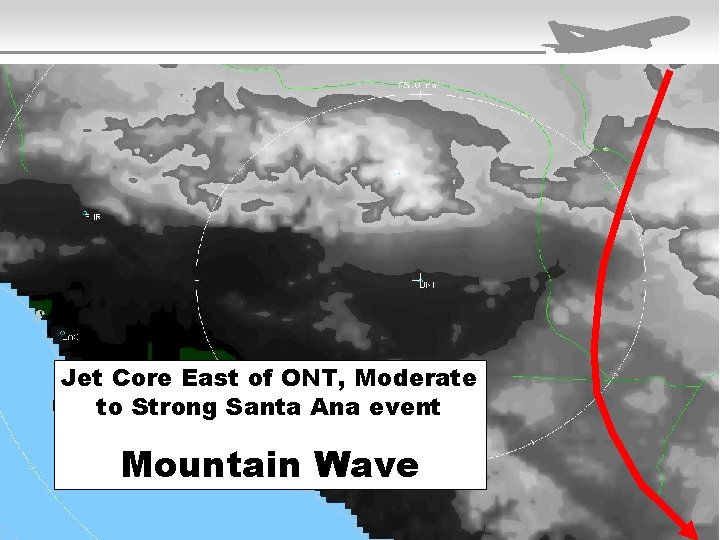
Jet Core East of ONT, Moderate to Strong Santa Ana event Mountain Wave
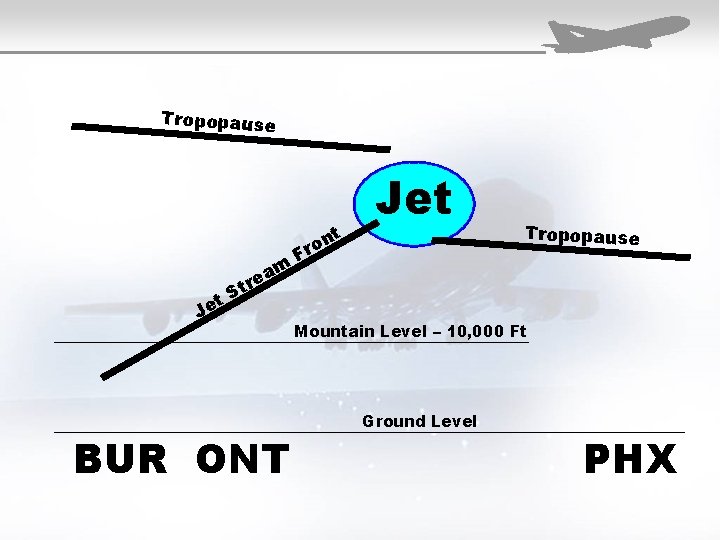
Tropopause t Je re t S am BUR ONT t n ro F Jet Tropopause Mountain Level – 10, 000 Ft Ground Level PHX
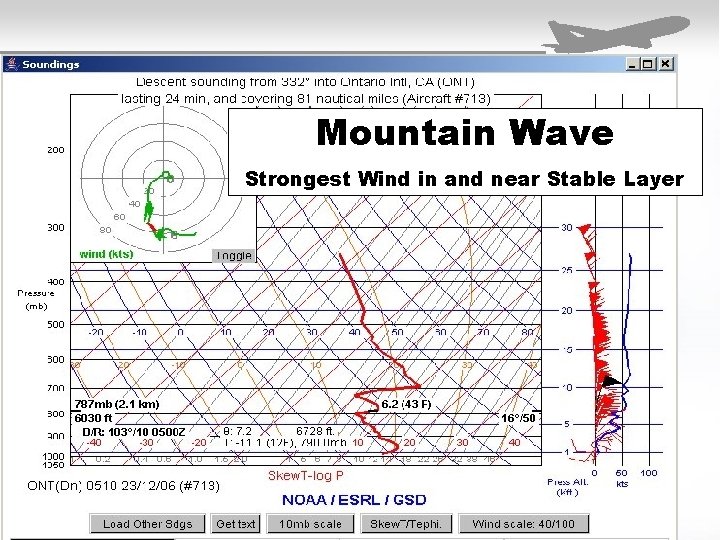
Mountain Wave Strongest Wind in and near Stable Layer
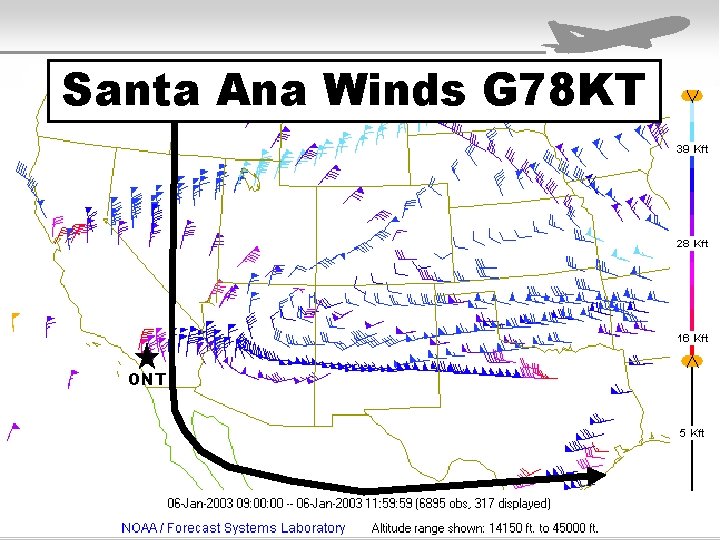
Santa Ana Winds G 78 KT ONT