TOPIC 1 TECTONIC PROCESSES AND HAZARDS Lesson 23
")


")
")

 • Read")


- Slides: 18
TOPIC 1: TECTONIC PROCESSES AND HAZARDS (Lesson 23)
Last lesson’s objectives: • To know the difference between predicting and forecasting hazard events • What prediction methods are currently in place?
Today’s lesson objectives: • To understand the Hazard management Cycle • To understand Park’s Model (Disaster Response Curve) and be able to relate it to hazard examples , comparing different levels of response based on levels of development
Specification content • 1. 8 Theoretical frameworks can be used to understand the prediction, impact and management of tectonic hazards • b) The importance of different stages in the ‘Hazard Management Cycle’ • ( response, recovery, mitigation, preparedness: ‘Players’: the role of emergency planners) • c) Use of Park’s model (Disaster response curve)to compare the response curve of hazard events, comparing areas at different stages of development.
The Hazard Management Cycle
The Hazard Management Cycle ( see Fig 1: p. 38 Oxford: P. 58 of booklet) • 1. This is a process in which governments and other organisations work together to protect people from the natural hazards that threaten their communities. The aim is to avoid or reduce loss of life and property, provide help to those affected and ensure a rapid and effective recovery. • 2. Fig 1 shows a theoretical model of hazard management as a continuous 4 stage cycle. • 3. The ‘key players’ in this cycle are: • a)Governments ( at all levels) local, regional, national • b) International organisations • c) Businesses • d) Community groups all involved in emergency planning
Tasks: • 1. Fill in info about all 4 stages on p. 57 using the info on p. 58 • 2. Answer the ‘Over to you’ questions 1 a) and 1 b)
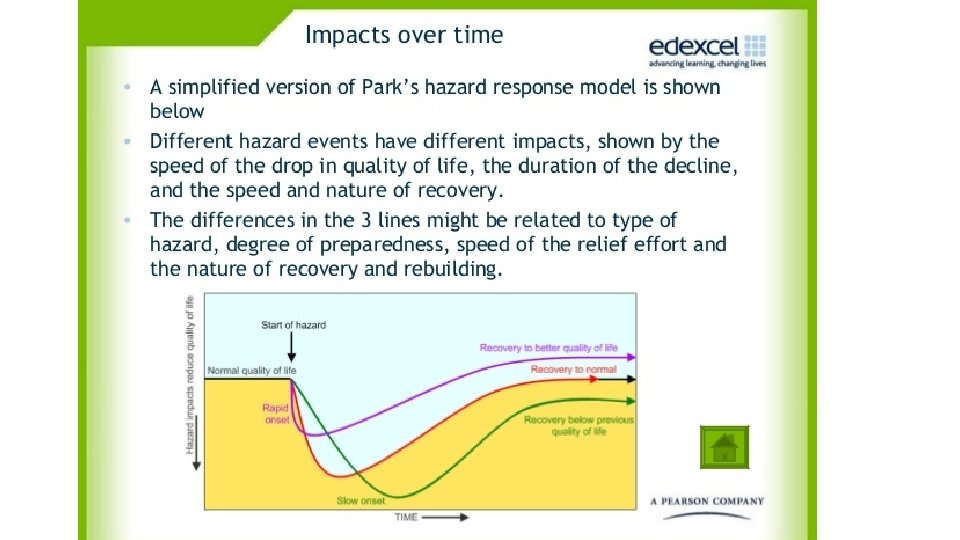
Park’s Response model (1991)
Park’s Response Model (Disaster response Curve)
Article from News Security Beat: ‘Bouncing forward : why resilience is important’ • https: //www. newsecuritybeat. org/2014/02/bouncing-forward-resilienceimportant-definition/ • (Listen to Diane Davies – 4 mins) • Think of this in relation to stage 5 of Park’s model- ‘Nature of recovery’…
TASK See Hodder p. 37 Table 3. 6 ( booklet p. 61) • Read and highlight ‘Understanding the stages in the Disaster Response Curve’…. ( you can write notes in your own time. . )
Modified Park’s model showing how quality of life changes over time after a hazard event
WHITEBOARD PAIRED THINKING • What are the advantages of this model? • What are the limitations of this model?
Advantages of using Park’s model 1. It is visually effective and quite easy to interpret 2. It enables different events to be compared and highlights the significance of emergency relief and rehabilitation in the aftermath of natural hazards.
Limitations of the Park response Model • 1. It is only a generalised model • 2. It does not account for differences in development or other impacts regarding hazard impact and recovery. • 3. No account of varying capacity to respond • E. g. does not examine the fact some countries need more help from outside than others
H/W TASK **YOU MUST MAKE SURE THAT ALL OTHER NOTES FROM THIS LESSON ARE COMPLETE** • Using your knowledge from : • 1) Haiti earthquake disaster ( developing country) • 2) New Zealand earthquake disaster (developed country) • Re- draw the Park Hazard Response curve to show it fits EACH particular example. • Write a short summary to explain why you have drawn the model each time. • ( You will need knowledge on each disaster from previous case study notes – see additional article – ‘The Christchurch earthquake’ in this booklet P. 65 -69)
Have we met our lesson objectives? : • To understand the Hazard management Cycle • To understand Park’s Model (‘Disaster Response Curve’) and be able to relate it to hazard examples , comparing different levels of response based on levels of development