To protect promote and improve the health of
- Slides: 12
To protect, promote and improve the health of all people in Florida through integrated state, county, and community efforts. Created: 12/27/13 Revision: 10/02/14 Progression of AIDS Cases in Florida Diagnosed through 2013 Florida Department of Health HIV/AIDS Section Division of Disease Control and Health Protection Annual data as of 06/30/2014
Surveillance Case Definition for AIDS in Florida AIDS Cases became reportable in Florida in 1981. A person with a positive confirmatory HIV antibody test or positive virologic test (qualitative or quantitative) and In Adult/Adolescent Case Only (13 years of age or older): • Has a CD 4 absolute count below 200, or • Has a CD 4 of less than 14 percent total lymphocytes In Adult/Adolescent and Pediatric Cases: • Has been diagnosed with one or more AIDS-defining illness (Opportunistic Infection)
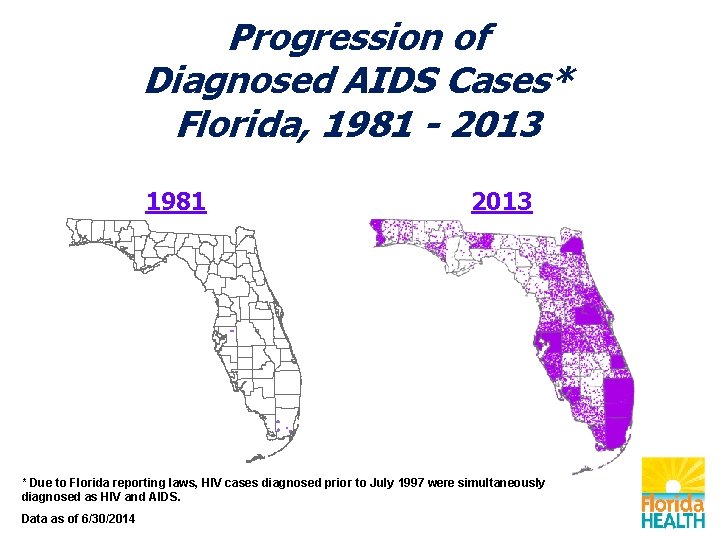
Progression of Diagnosed AIDS Cases* Florida, 1981 - 2013 1981 2013 * Due to Florida reporting laws, HIV cases diagnosed prior to July 1997 were simultaneously diagnosed as HIV and AIDS. Data as of 6/30/2014
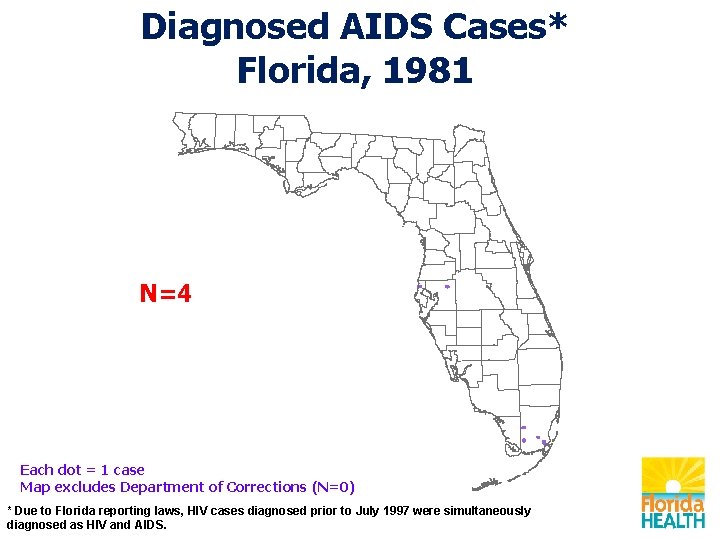
Diagnosed AIDS Cases* Florida, 1981 N=4 Each dot = 1 case Map excludes Department of Corrections (N=0) * Due to Florida reporting laws, HIV cases diagnosed prior to July 1997 were simultaneously diagnosed as HIV and AIDS.
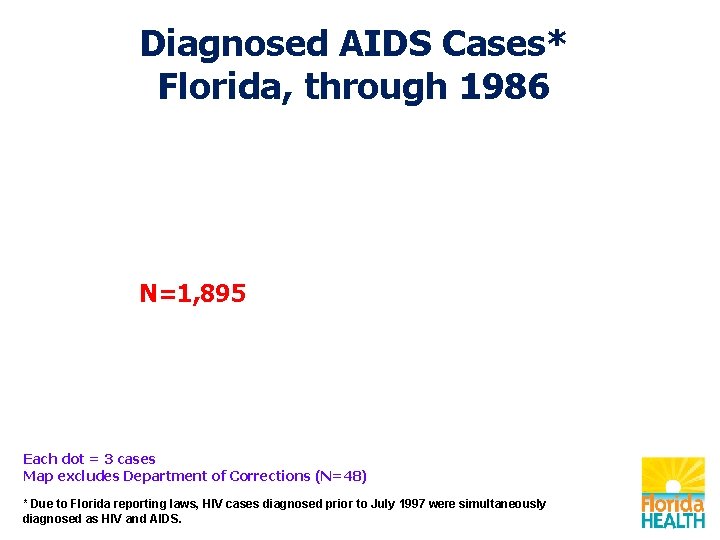
Diagnosed AIDS Cases* Florida, through 1986 N=1, 895 Each dot = 3 cases Map excludes Department of Corrections (N=48) * Due to Florida reporting laws, HIV cases diagnosed prior to July 1997 were simultaneously diagnosed as HIV and AIDS.
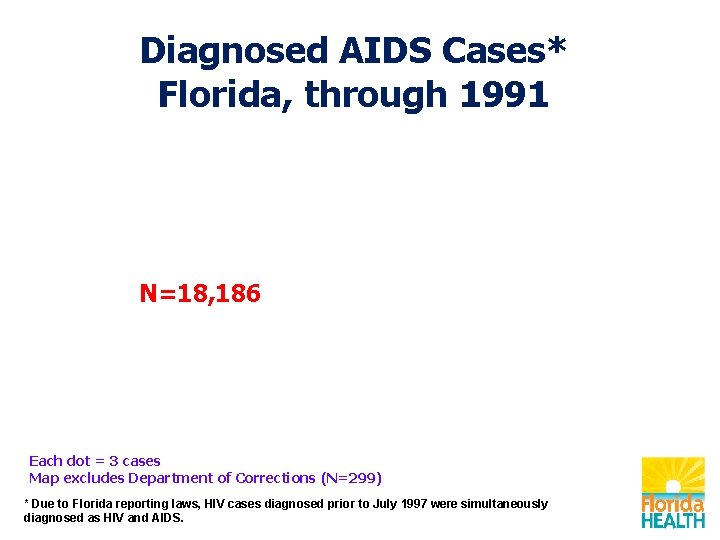
Diagnosed AIDS Cases* Florida, through 1991 N=18, 186 Each dot = 3 cases Map excludes Department of Corrections (N=299) * Due to Florida reporting laws, HIV cases diagnosed prior to July 1997 were simultaneously diagnosed as HIV and AIDS.
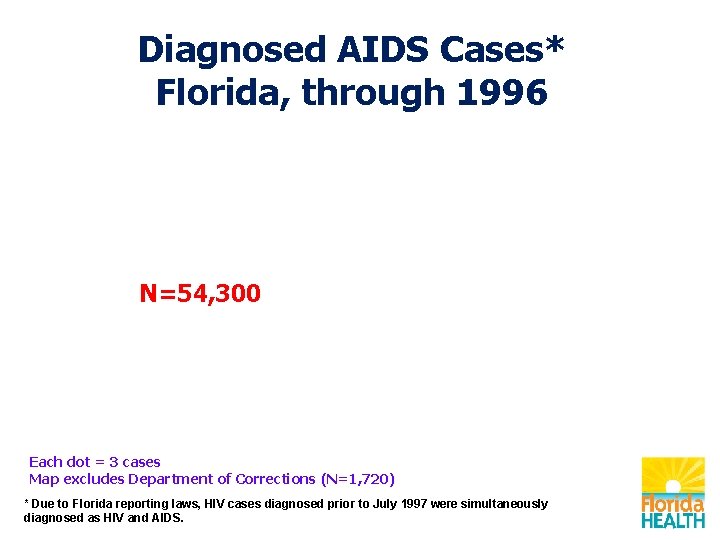
Diagnosed AIDS Cases* Florida, through 1996 N=54, 300 Each dot = 3 cases Map excludes Department of Corrections (N=1, 720) * Due to Florida reporting laws, HIV cases diagnosed prior to July 1997 were simultaneously diagnosed as HIV and AIDS.
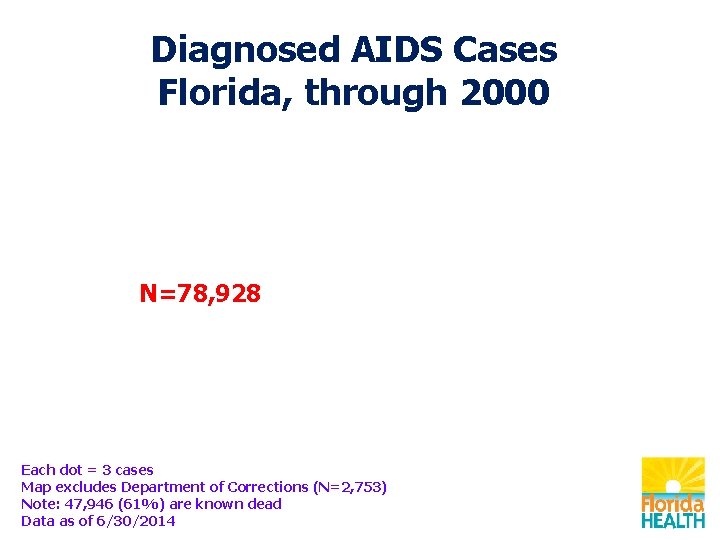
Diagnosed AIDS Cases Florida, through 2000 N=78, 928 Each dot = 3 cases Map excludes Department of Corrections (N=2, 753) Note: 47, 946 (61%) are known dead Data as of 6/30/2014
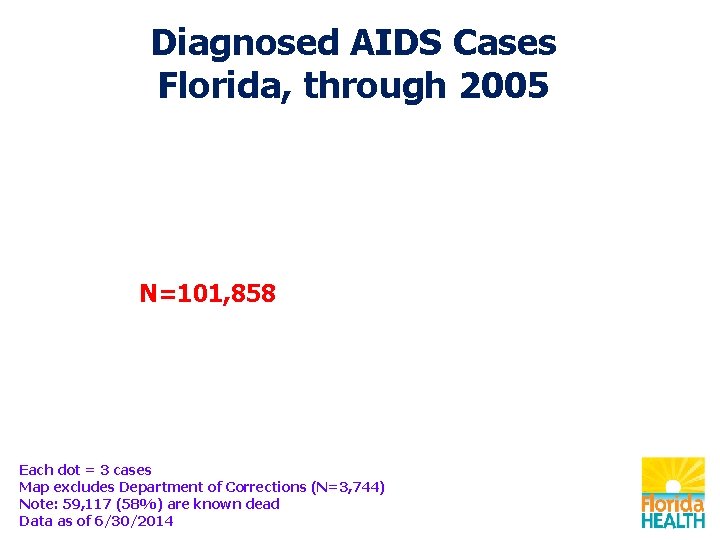
Diagnosed AIDS Cases Florida, through 2005 N=101, 858 Each dot = 3 cases Map excludes Department of Corrections (N=3, 744) Note: 59, 117 (58%) are known dead Data as of 6/30/2014
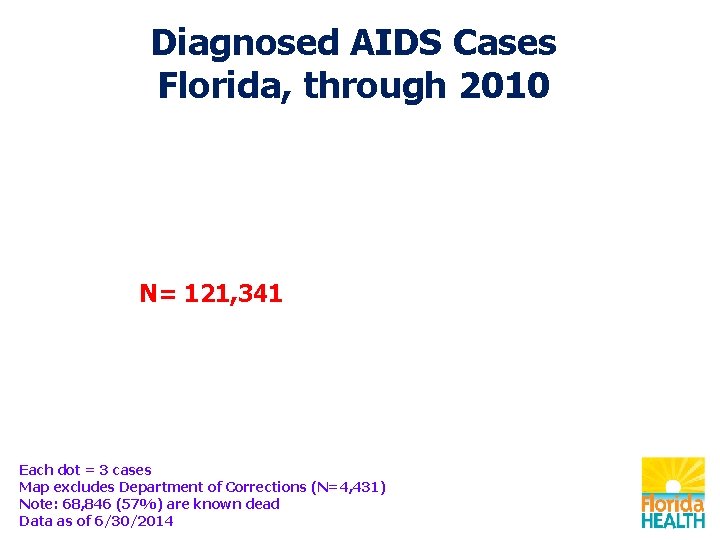
Diagnosed AIDS Cases Florida, through 2010 N= 121, 341 Each dot = 3 cases Map excludes Department of Corrections (N=4, 431) Note: 68, 846 (57%) are known dead Data as of 6/30/2014
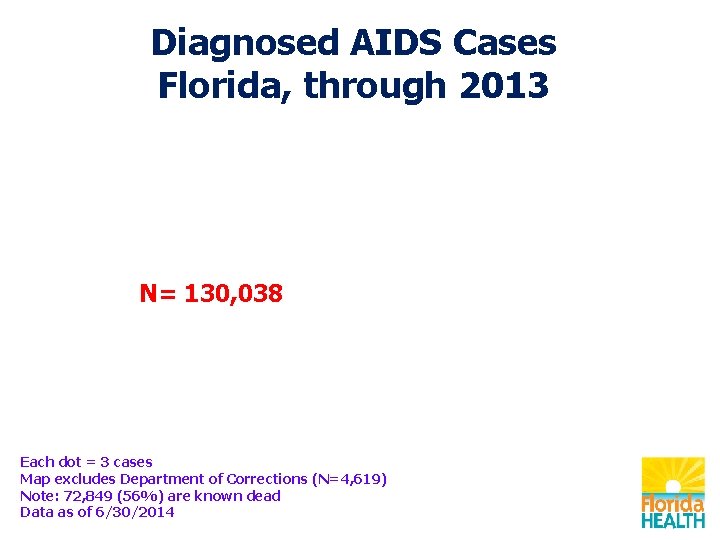
Diagnosed AIDS Cases Florida, through 2013 N= 130, 038 Each dot = 3 cases Map excludes Department of Corrections (N=4, 619) Note: 72, 849 (56%) are known dead Data as of 6/30/2014
For Florida HIV/AIDS Surveillance Data Contact: (850) 245 -4444 Lorene Maddox, MPH Tracina Bush, BSW Madgene Moise, MPH Ext. 2613 Ext. 2612 Ext. 2373 Visit Florida’s internet site for: Monthly Surveillance Reports Slide Sets and Fact Sheets Annual Reports and Epi Profiles http: //www. floridahealth. gov/diseases-and-conditions/aids/surveillance/index. html Visit CDC’s HIV/AIDS internet site for: Surveillance Reports, fact sheets and slide sets http: //www. cdc. gov/hiv/topics/surveillance/resources/reports/index. htm