The Lost Discipline of Developing Analytics Celeste Fralick

- Slides: 23
The Lost Discipline of Developing Analytics Celeste Fralick, Ph. D. , CQA Chief Technology Officer-Analytics, Intel Security Group Research Faculty – International Institute of Analytics 09/21/16 celeste. r. fralick@intel. com 480 -554 -0248 Join the Conversation #Wolfram. Data. Summit
Agenda • Why Now • Why We Should Care • Analytic Product Life Cycles • Select Recommended Content • Summary
Why Now?
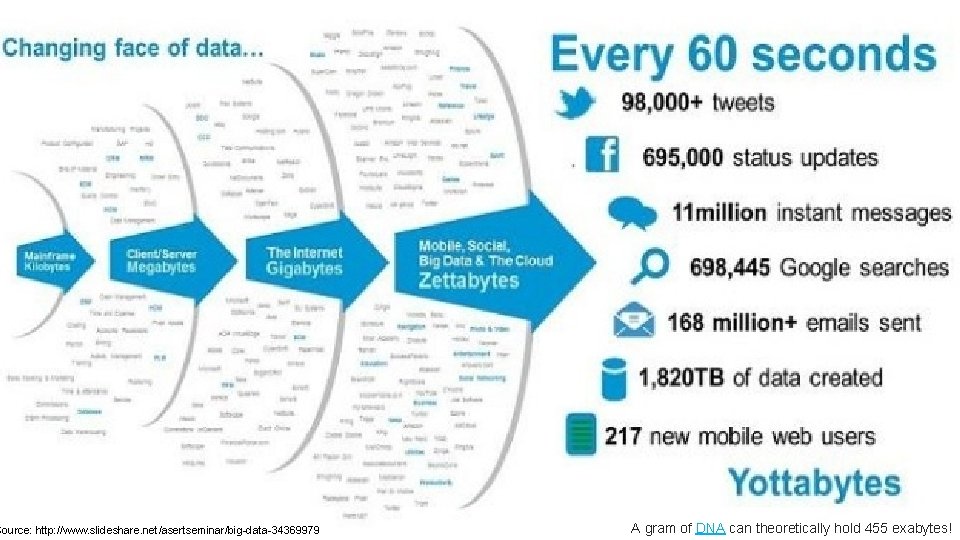
Source: http: //www. slideshare. net/asertseminar/big-data-34369979 A gram of DNA can theoretically hold 455 exabytes!
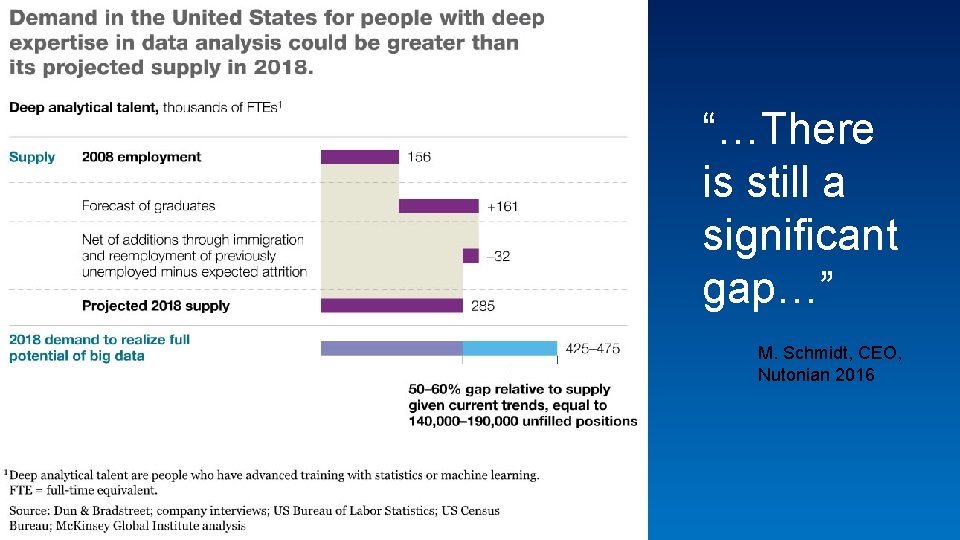
“…There is still a significant gap…” M. Schmidt, CEO, Nutonian 2016
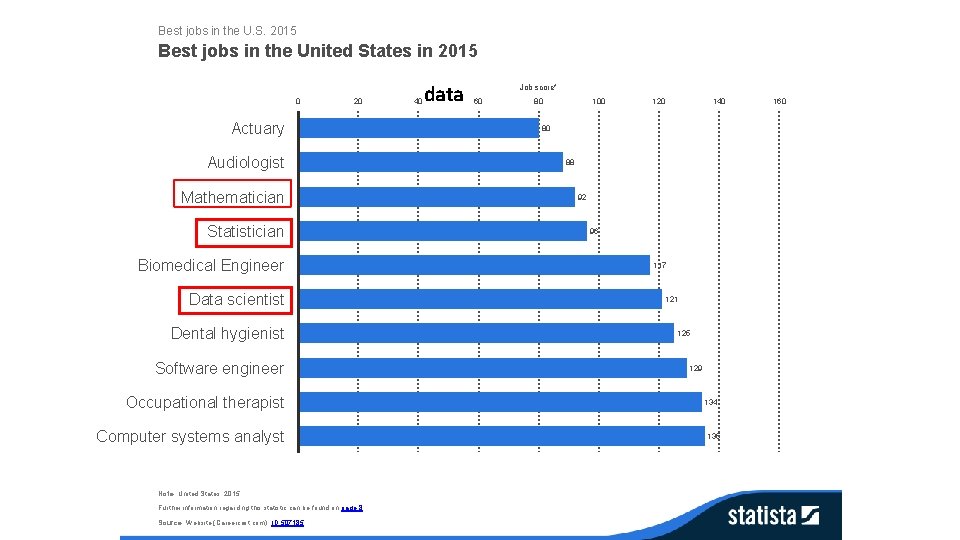
Best jobs in the U. S. 2015 Best jobs in the United States in 2015 0 20 Actuary Audiologist Mathematician Statistician Biomedical Engineer Data scientist Dental hygienist Software engineer Occupational therapist Computer systems analyst Note: United States; 2015 Further information regarding this statistic can be found on page 8. Source: Website (Careercast. com); ID 507185 40 data Job score* 60 80 100 120 140 80 88 92 96 117 121 125 129 134 135 160
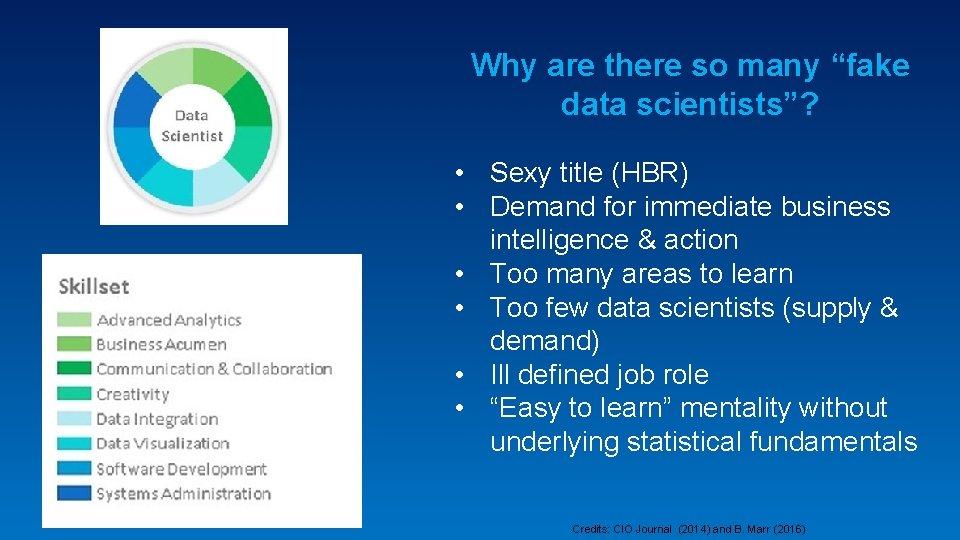
Why are there so many “fake data scientists”? • Sexy title (HBR) • Demand for immediate business intelligence & action • Too many areas to learn • Too few data scientists (supply & demand) • Ill defined job role • “Easy to learn” mentality without underlying statistical fundamentals Credits: CIO Journal (2014) and B. Marr (2016)
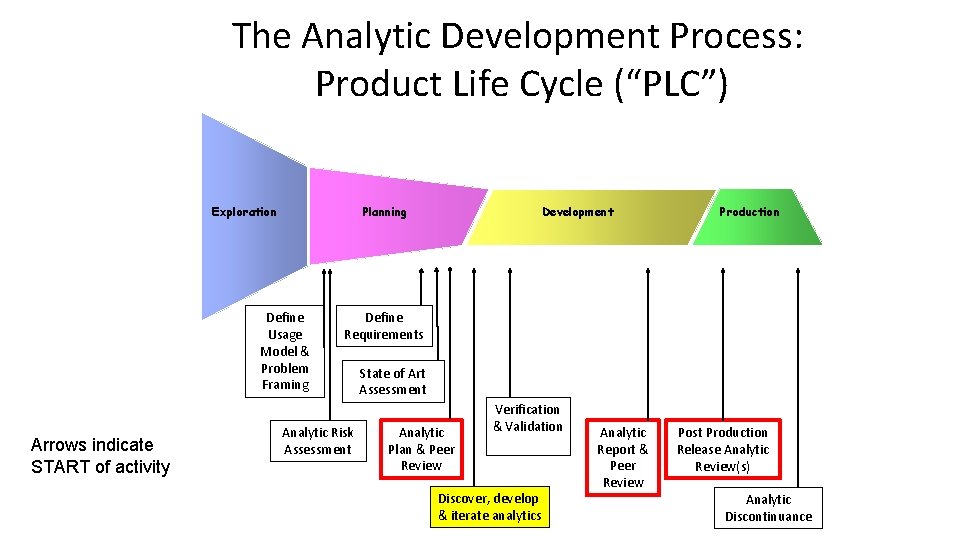
The Analytic Development Process: Product Life Cycle (“PLC”) Planning Exploration Define Usage Model & Problem Framing Arrows indicate START of activity Development Production Define Requirements Analytic Risk Assessment State of Art Assessment Analytic Plan & Peer Review Verification & Validation Discover, develop & iterate analytics Analytic Report & Peer Review Post Production Release Analytic Review(s) Analytic Discontinuance
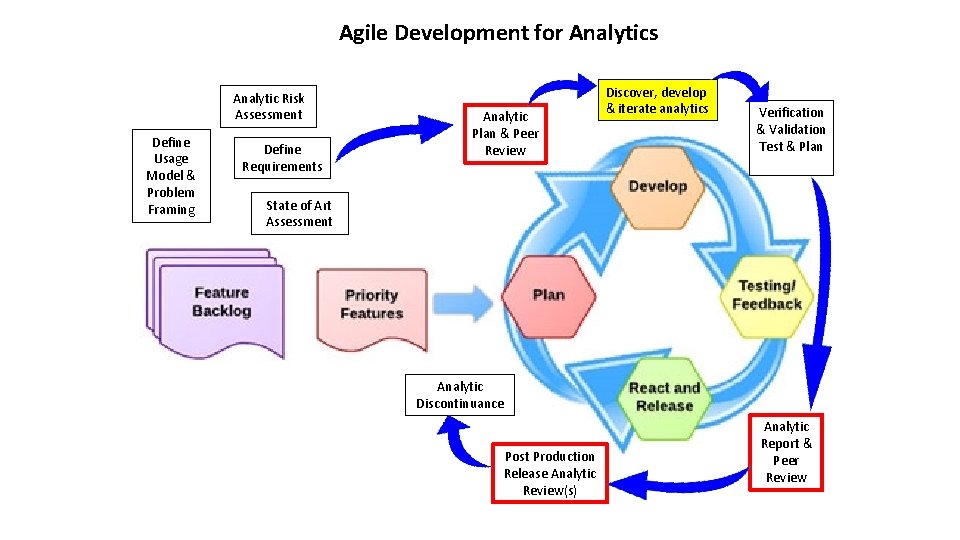
Agile Development for Analytics Analytic Risk Assessment Define Usage Model & Problem Framing Define Requirements Analytic Plan & Peer Review Discover, develop & iterate analytics Verification & Validation Test & Plan State of Art Assessment Analytic Discontinuance Post Production Release Analytic Review(s) Analytic Report & Peer Review
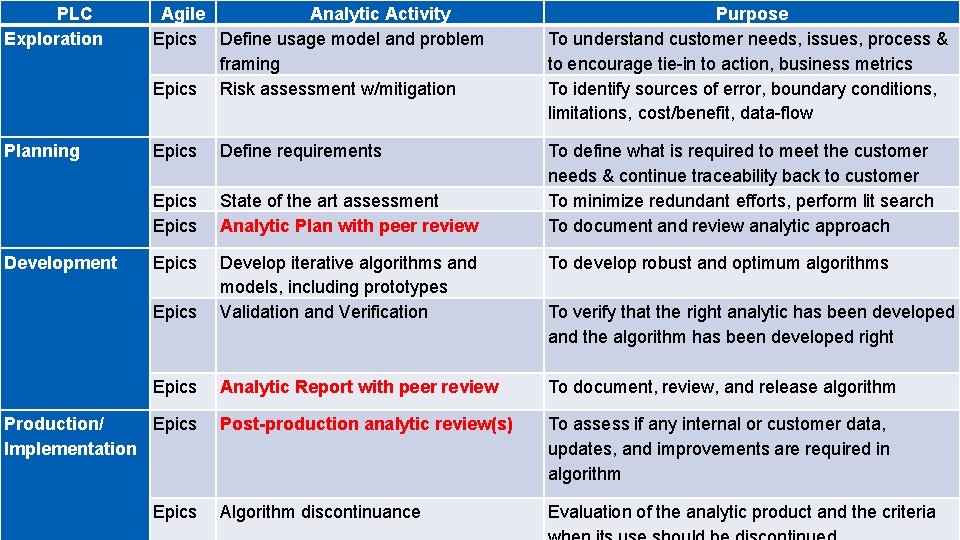
PLC Exploration Agile Analytic Activity Epics Define usage model and problem framing Epics Risk assessment w/mitigation Purpose To understand customer needs, issues, process & to encourage tie-in to action, business metrics To identify sources of error, boundary conditions, limitations, cost/benefit, data-flow Planning Epics To define what is required to meet the customer needs & continue traceability back to customer To minimize redundant efforts, perform lit search To document and review analytic approach Define requirements Epics State of the art assessment Epics Analytic Plan with peer review Development Epics Develop iterative algorithms and models, including prototypes Epics Validation and Verification To develop robust and optimum algorithms Epics Analytic Report with peer review To document, review, and release algorithm Production/ Epics Implementation Epics To verify that the right analytic has been developed and the algorithm has been developed right Post-production analytic review(s) To assess if any internal or customer data, updates, and improvements are required in algorithm Algorithm discontinuance Evaluation of the analytic product and the criteria
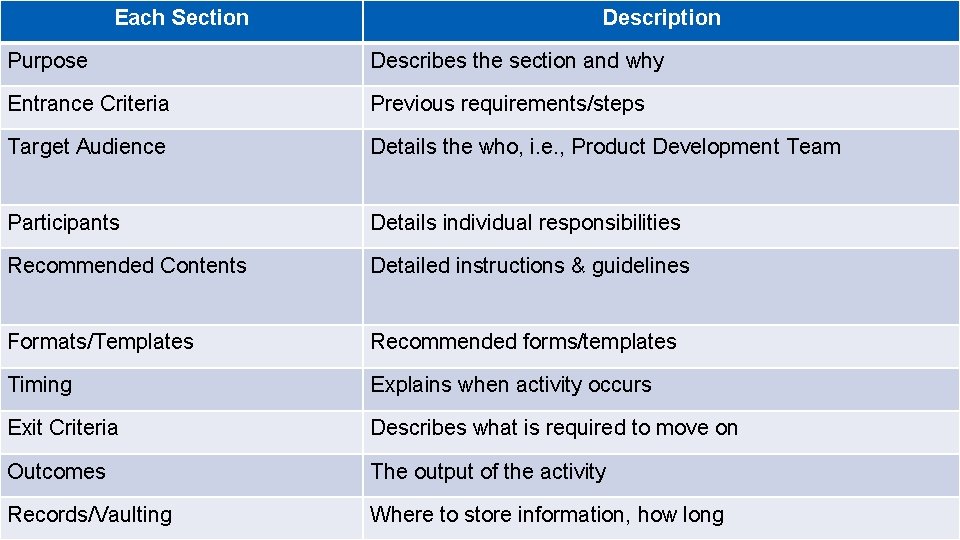
Each Section Description Purpose Describes the section and why Entrance Criteria Previous requirements/steps Target Audience Details the who, i. e. , Product Development Team Participants Details individual responsibilities Recommended Contents Detailed instructions & guidelines Formats/Templates Recommended forms/templates Timing Explains when activity occurs Exit Criteria Describes what is required to move on Outcomes The output of the activity Records/Vaulting Where to store information, how long
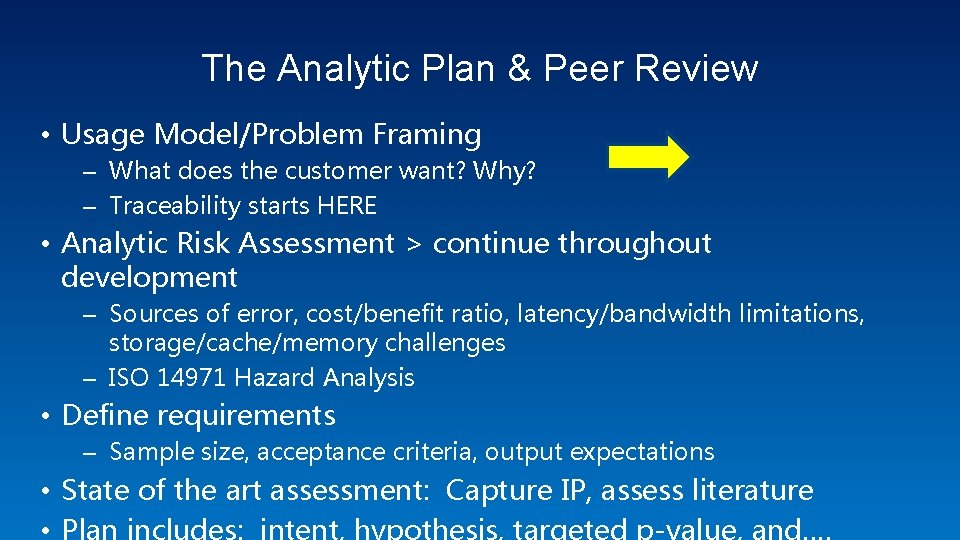
The Analytic Plan & Peer Review • Usage Model/Problem Framing – What does the customer want? Why? – Traceability starts HERE • Analytic Risk Assessment > continue throughout development – Sources of error, cost/benefit ratio, latency/bandwidth limitations, storage/cache/memory challenges – ISO 14971 Hazard Analysis • Define requirements – Sample size, acceptance criteria, output expectations • State of the art assessment: Capture IP, assess literature
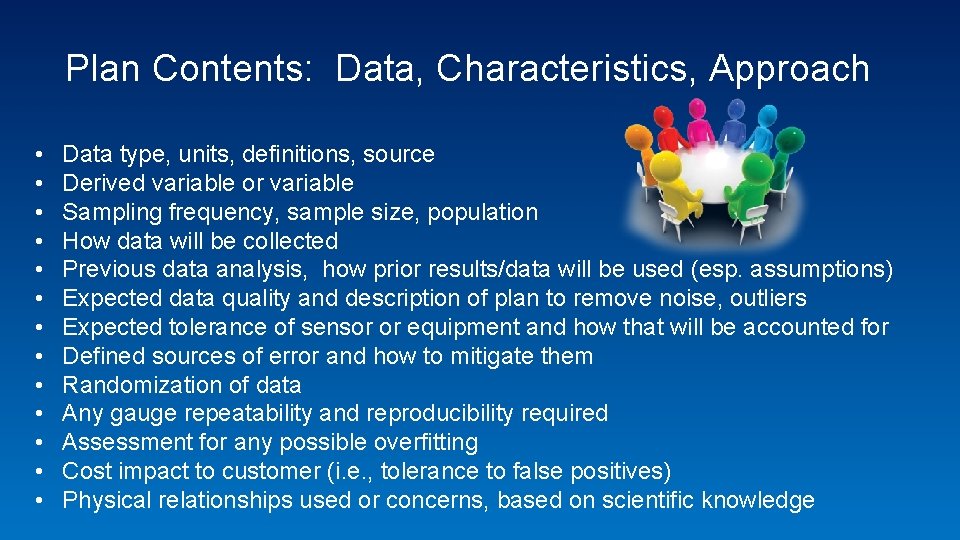
Plan Contents: Data, Characteristics, Approach • • • • Data type, units, definitions, source Derived variable or variable Sampling frequency, sample size, population How data will be collected Previous data analysis, how prior results/data will be used (esp. assumptions) Expected data quality and description of plan to remove noise, outliers Expected tolerance of sensor or equipment and how that will be accounted for Defined sources of error and how to mitigate them Randomization of data Any gauge repeatability and reproducibility required Assessment for any possible overfitting Cost impact to customer (i. e. , tolerance to false positives) Physical relationships used or concerns, based on scientific knowledge
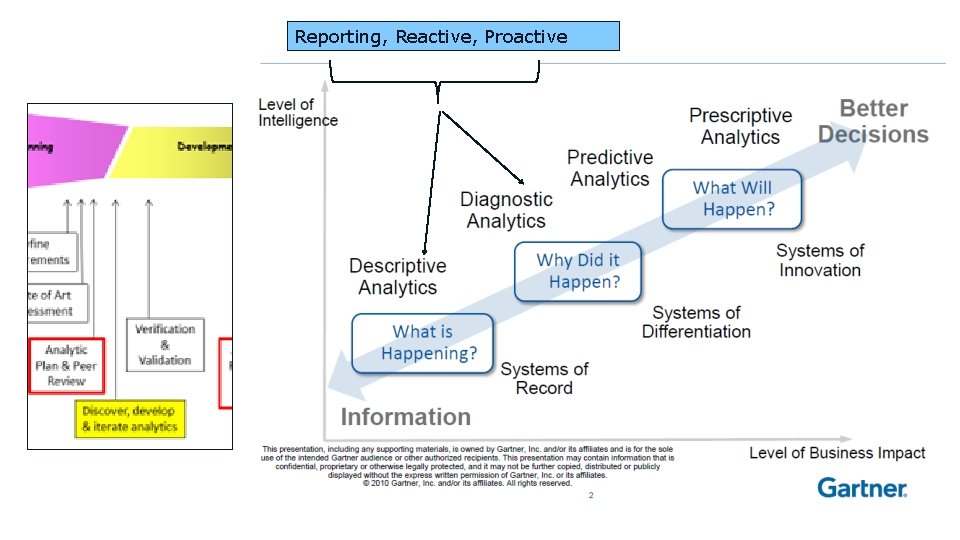
Reporting, Reactive, Proactive
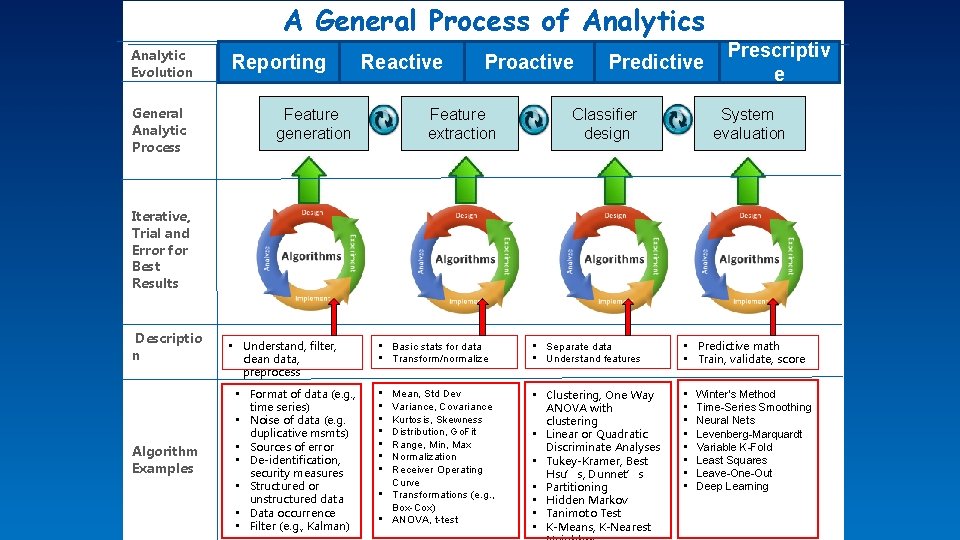
A General Process of Analytics Analytic Evolution General Analytic Process Reporting Reactive Proactive Feature extraction Feature generation Predictive Classifier design Prescriptiv e System evaluation Iterative, Trial and Error for Best Results Descriptio n Algorithm Examples • Understand, filter, clean data, preprocess • Format of data (e. g. , time series) • Noise of data (e. g. duplicative msmts) • Sources of error • De-identification, security measures • Structured or unstructured data • Data occurrence • Filter (e. g. , Kalman) • Basic stats for data • Transform/normalize • Separate data • Understand features • Predictive math • Train, validate, score • • Clustering, One Way ANOVA with clustering • Linear or Quadratic Discriminate Analyses • Tukey-Kramer, Best Hsu’s, Dunnet’s • Partitioning • Hidden Markov • Tanimoto Test • K-Means, K-Nearest • • Mean, Std Dev Variance, Covariance Kurtosis, Skewness Distribution, Go. Fit Range, Min, Max Normalization Receiver Operating Curve • Transformations (e. g. , Box-Cox) • ANOVA, t-test Winter’s Method Time-Series Smoothing Neural Nets Levenberg-Marquardt Variable K-Fold Least Squares Leave-One-Out Deep Learning
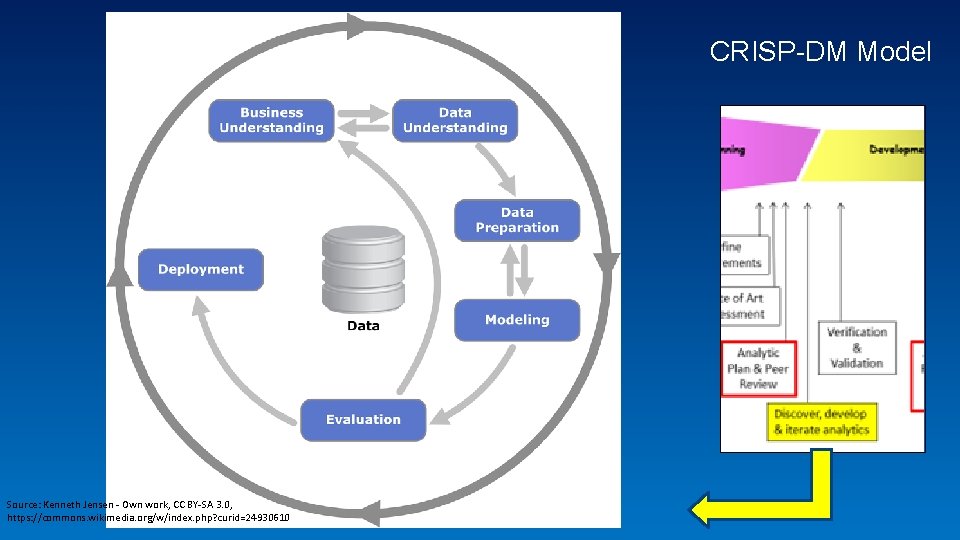
CRISP-DM Model Source: Kenneth Jensen - Own work, CC BY-SA 3. 0, https: //commons. wikimedia. org/w/index. php? curid=24930610
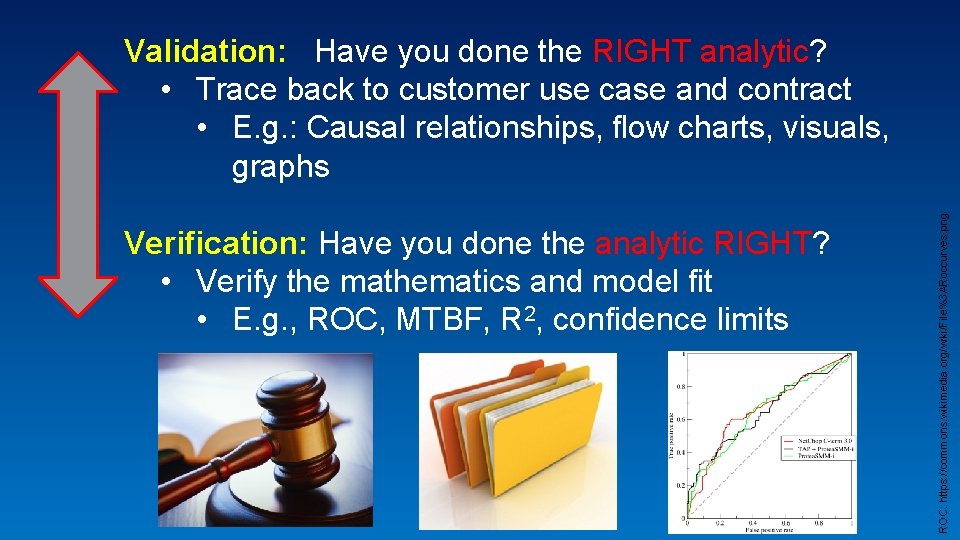
Verification: Have you done the analytic RIGHT? • Verify the mathematics and model fit • E. g. , ROC, MTBF, R 2, confidence limits ROC: https: //commons. wikimedia. org/wiki/File%3 ARoccurves. png Validation: Have you done the RIGHT analytic? • Trace back to customer use case and contract • E. g. : Causal relationships, flow charts, visuals, graphs
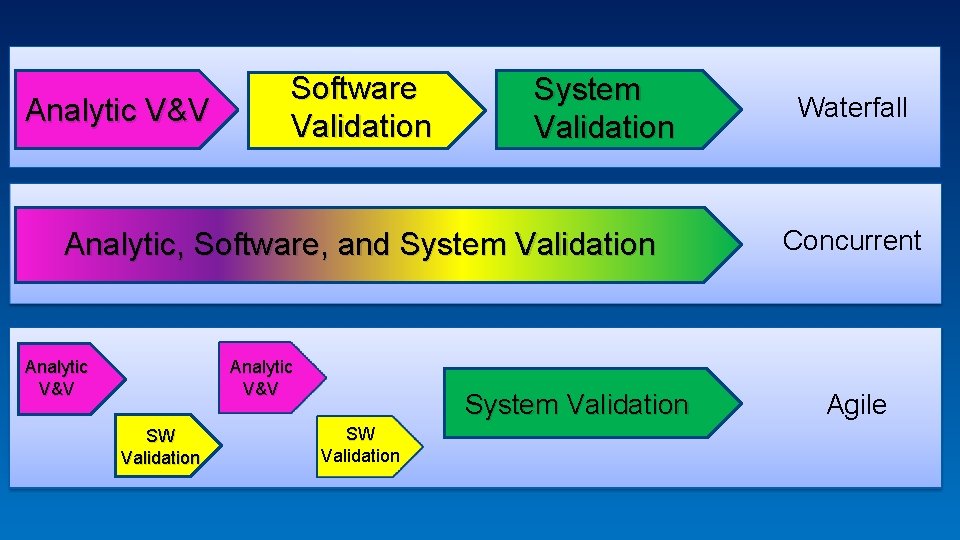
Analytic V&V Software Validation System Validation Analytic, Software, and System Validation Analytic V&V SW Validation System Validation SW Validation Waterfall Concurrent Agile
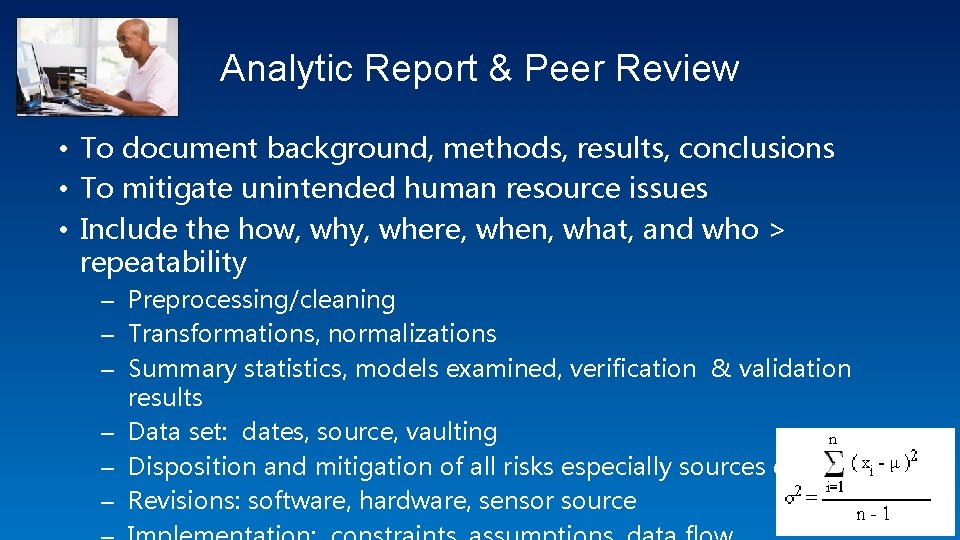
Analytic Report & Peer Review • To document background, methods, results, conclusions • To mitigate unintended human resource issues • Include the how, why, where, when, what, and who > repeatability – Preprocessing/cleaning – Transformations, normalizations – Summary statistics, models examined, verification & validation results – Data set: dates, source, vaulting – Disposition and mitigation of all risks especially sources of error – Revisions: software, hardware, sensor source
Post-Production Release Analytic Review • Review Analytic Report, current data status & management*, ask if it’s still the same • Why? – – – – Features and design space change Data decays Processes move Data flow changes Minimize liability Protect IP Mergers/Acquisitions * e. g. , policy, governance, compliance, quality, flow, regulations, APIs, interoperability, metadata
Analytic discipline protects you and your customer Legal Repeatability Model Optimization Monitoring post implementation “Data Scientists” Meeting customer needs
Thank You!!
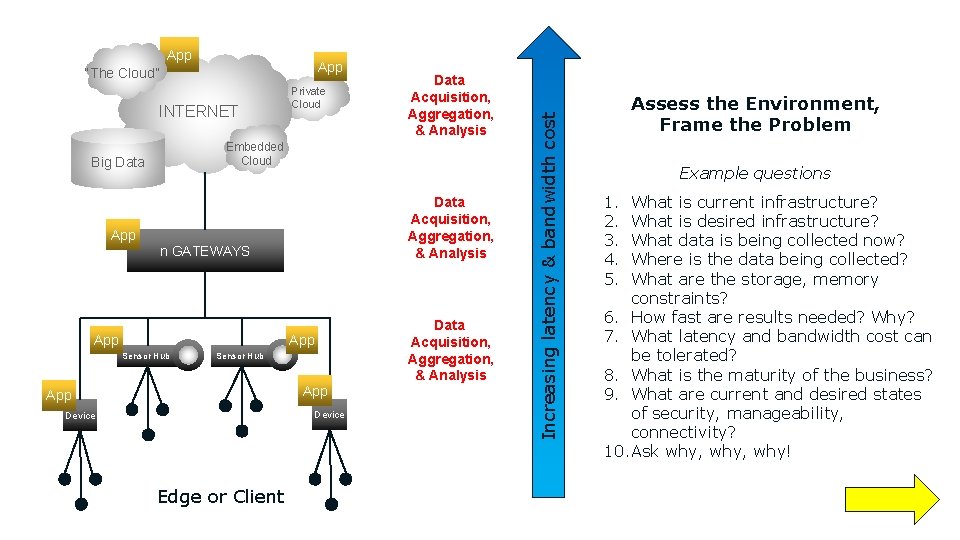
App “The Cloud” INTERNET Private Cloud Data Acquisition, Aggregation, & Analysis Embedded Cloud Big Data Acquisition, Aggregation, & Analysis App n GATEWAYS App Sensor Hub App Device Edge or Client Data Acquisition, Aggregation, & Analysis Increasing latency & bandwidth cost App Assess the Environment, Frame the Problem Example questions 1. 2. 3. 4. 5. What is current infrastructure? What is desired infrastructure? What data is being collected now? Where is the data being collected? What are the storage, memory constraints? 6. How fast are results needed? Why? 7. What latency and bandwidth cost can be tolerated? 8. What is the maturity of the business? 9. What are current and desired states of security, manageability, connectivity? 10. Ask why, why!